

Abstract
Mitogen-activated protein kinase (MPK) cascades are important for eukaryotic signal transduction. They convert extracellular stimuli (e.g. some hormones, growth factors, cytokines, microbe- or damage-associated molecular patterns) into intracellular responses while at the same time amplifying the transmitting signal. By doing so, they ensure proper performance, and eventually survival, of a given organism, for example in times of stress. MPK cascades function via reversible phosphorylation of cascade components MEKKs, MEKs, and MPKs. In plants the identity of most MPK substrates remained elusive until now. Here, we provide a robust and powerful approach to identify and quantify, with high selectivity, site-specific phosphorylation of MPK substrate candidates in the model plant Arabidopsis thaliana. Our approach represents a two-step chromatography combining phosphoprotein enrichment using Al(OH)3-based metal oxide affinity chromatography, tryptic digest of enriched phosphoproteins, and TiO2-based metal oxide affinity chromatography to enrich phosphopeptides from complex protein samples. When applied to transgenic conditional gain-of-function Arabidopsis plants supporting in planta activation of MPKs, the approach allows direct measurement and quantification ex vivo of site-specific phosphorylation of several reported and many yet unknown putative MPK substrates in just a single experiment.
Mitogen-activated protein kinase (MPK)1 cascades are conserved signal amplification modules in eukaryotes (1). They transduce extracellular stimuli (such as some hormones, growth factors, cytokines, microbe or damage-associated molecular patterns) into cellular responses. Signaling through MPK cascades requires stimulus-activated MPK kinase (MEK)-activating kinases (MEKKs) that activate their MEK substrates by phosphorylation. MEKs also use phosphorylation to activate their MPK substrates. While MPK cascades have been intensively studied over the past decade, in plants the identity of in vivo MPK substrates that ultimately cause the physiological changes, however, remained largely elusive. This presumably is because of the transient nature of the phosphorylation event and the ephemeral interaction between MPKs and their protein substrates. Compartmentalization and, thus, spatial separation of MPKs and their protein substrates may also impede identification of in vivo MPK substrates.
Phosphoproteomics is a powerful tool to identify bona-fide MPK substrates. This is because it allows unbiased localization and site-specific quantification of in vivo phosphorylation of hundreds of proteins in a single experiment. In recent years enrichment of phosphorylated peptides using TiO2 and similar metal oxides on proteolytic digestion of the protein extract has become popular and was applied successfully (2). However, despite the high sensitivity of modern mass spectrometers the large dynamic range of protein abundance and the transient nature of protein phosphorylation remained major difficulties in MS-based phosphoproteomics.
Here, we used a novel approach combining dual metal oxide affinity chromatography (MOAC) of proteins and peptides with LC-MS/MS to identify and quantify site-specific phosphorylation of in vivo MPK substrate candidates in Arabidopsis thaliana. We took advantage of transgenic, conditional gain-of-function Arabidopsis plants harboring a gene for a constitutively active MEKDD mutant protein of Nicotiana tabacum (NtMEK2DD) under control of the dexamethasone (DEX)-inducible GVG promoter (3, 4). In the NtMEK2DD mutant protein amino acids serine (S) and threonine (T) are substituted by aspartic acid (D) within the phosphorylation site motif (S/T-X5-S/T) between kinase subdomains VII and VIII of NtMEK2. In GVG:FLAG-NtMEK2DD transgenic plants, DEX treatment leads to NtMEK2DD accumulation associated with constitutive and specific phosphorylation of the MEK2 target proteins AtMPK3 and AtMPK6 (4) and their in vivo substrates. By combined use of GVG::FLAG-NtMEK2DD plants with a powerful consecutive enrichment of phosphoproteins and phosphopeptides followed by LC-MS/MS analysis, we directly measured site-specific phosphorylation of 141 putative and mostly novel MPK substrates. Among the MPK substrate candidates were previously unknown transcription coactivators, kinases other than MPKs, and other proteins with a role in cell signaling. Network analysis of MPK substrate candidates and their interaction partners disclosed significant enrichment of these groups of proteins. The analyses also closely link, for the first time, MPK signaling modules with the central oscillator of the circadian clock, TIME FOR COFFEE (TIC), and gating of red-light signaling to the clock, and to phototropism.
EXPERIMENTAL PROCEDURES
Plant Growth and Treatment
Seedlings of Arabidopsis thaliana GVG::FLAG-NtMEK2DD were grown in 50 ml of half-strength Murashige and Skoog medium at 22 °C in continuous light (70 μE/m2/sec). Twelve-day-old seedlings were treated with DEX (1 μm) in ethanol or with ethanol as the control and collected 6 h after treatment.
Protein Extraction and MOAC-Enrichment of Phosphoproteins
Protein extraction from seedlings and enrichment of phosphoproteins have been described previously (5). Protein concentration in extracts was determined with the Bio-Rad (Hercules, CA) protein assay kit with BSA as the standard.
Western blotting Analysis and Immunodetection
Protein samples were subjected to SDS-PAGE, transferred to nitrocellulose, and used for immunodetection as described (6). Mouse monoclonal anti-Flag M2 antibodies were purchased from Sigma-Aldrich; all other antibodies were from New England Biolabs. Chemiluminescence detection of antigen-antibody complexes was done with Immobilon™ Western substrate (Millipore).
Enrichment of Phosphopeptides by MOAC
For in-solution protein digestion, total proteins or MOAC-enriched phosphoproteins were predigested for 5 h with endoproteinase Lys-C (1/100 w/w) followed by trypsin digestion (Poroszyme immobilized trypsin (1/100 v/w)) overnight. Protein digests were desalted using a SPEC C-18 96-well plate (Varian, Palo Alto, CA) according to the manufacturer's instructions. TiO2 beads were purchased from Glygen Inc. Phosphopeptide enrichment was performed as previously described (7).
Mass Spectrometry
Peptides were dissolved in 8 μl of 5% (v/v) acetonitrile (ACN), 0.5% (v/v) formic acid (FA) in ultrapure H2O and spun at 21,400 × g for 10 min at 4 °C to pellet insoluble debris. Seven μl peptide solution were transferred to a glass vial from which 5 μl were injected into an Eksigent nano LC liquid chromatography system (Thermo Scientific). Chromatography was performed using a Chromolith CapRod monolithic column with C18 stationary phase with a length of 150 mm and an inner diameter of 0.1 mm. The mobile phases were 0.1% (v/v) FA in ultrapure H2O and 90% (v/v) ACN, 0.1% (v/v) FA also in ultrapure H2O. Peptides were eluted with a gradient from 10% to 35% organic phase within 120 min at a flow rate of 500 nl/min into an ESI source and electrosprayed into an LTQ-Orbitrap XL mass spectrometer (Thermo Electron). Spray voltage was set to maintain a spray current below 0.5 μA (1.5 to 2 kV for the replicate experiments). Capillary temperature was 170 °C. Data-dependent analysis was done in which high accuracy full scan mass spectra of the total ion population were acquired in the OrbiTrap mass analyzer. CID tandem mass spectra (MS/MS spectra) of the five most intense ions were acquired in the linear triple quadrupole (LTQ) mass analyzer. Automatic gain control (AGC) for full scan acquisition in the Orbitrap was set to 5e+05. Maximum injection time (max IT) was set to 500 msec, and injection wave forms were enabled. Full scan mass spectra were internally calibrated on the fly using lock mass for an average mass error of less than 1 ppm. Exclusion duration for data-dependent selection of MS/MS precursor ions was set to 30 s and exclusion width was ± 10 ppm. Charge state screening was enabled and single-charged ions excluded from MS/MS acquisition. Multistage activation/pseudoMS3 was enabled with a neutral loss mass list of 293.91, 195.94, 97.97, 48.999, 32.66, and 24.49 Da. The AGC for MS/MS acquisition in the LTQ was set to 3e+04; the max IT was set to 100 msec. Per MS/MS spectrum three microscans were acquired.
Peptide Identification
Database-dependent peptide and protein identification, and phosphorylation site mapping were performed with the Proteome Discoverer Software version 1.3 on Windows 7 using the SEQUEST algorithm (hereafter referred to as PD) and the MaxQuant software version 1.2.2.5. on Windows Vista (hereafter referred to as MQ). For PD, the intensity threshold and minimum ion count were set to 0 and 1, respectively. For peak list generation from MS/MS spectra the signal-to-noise threshold (S/N) was set to 2. MS/MS precursor mass tolerance was set to 7 ppm, the MS/MS fragment mass tolerance to 0.4 Da. The b- and y-ions were given the maximum weight, and a, c, x, and z ion series were deprecated for calculation of peptide sequences. Oxidation of methionine and phosphorylation of serine, threonine, and tyrosine were set as variable modifications. Peak lists were used to search the TAIR10 database to which the sequences of porcine modified trypsin, and common contaminants such as various keratins were added (35394 sequences, 13419867 residues). The enzyme was set to trypsin tolerating two missed cleavages. A false discovery rate (FDR) was calculated by searching a decoy database that contained all of the sequences in the target database in reverse order. PSMs with a q-value <0.05 which corresponds to a corrected significance threshold of 0.05 employing the Benjamini-Hochberg FDR procedure to control the family wise error rate were kept. Only the highest ranking peptide annotation for each MS/MS spectrum was kept and used for protein identification. Protein grouping was enabled and PSMs were counted only in the top-scoring protein. The PhosphoRS module is integrated in PD v. 1.3 and was used for probabilistic mapping of phosphosites.
For MQ, the TAIR10 database was searched with the Andromeda search engine which is incorporated into the MQ software. Oxidation of methionine and phosphorylation of serine, threonine, and tyrosine were set as variable modifications. The enzyme was set to trypsin excluding cleavage before proline. Two missed cleavages, a maximum of four modifications, and a maximum charge state of four per peptide were allowed. A precursor ion mass error of 7 ppm and a 0.4 Da-MS/MS fragment mass error were tolerated for the main search. The peptide and protein FDR threshold was set to 0.05; the phosphorylation site FDR threshold, which was applied separately, was set to 0.01 for increased stringency and highest confidence mapping of phosphorylation sites.
Protein abundance was determined by the spectral count that is the number of all peptide spectral matches (PSMs) assigned to a protein group by PD. Peptide and phosphopeptide abundance was determined by the ion count with the ProtMAX 2012 software version 2.0.1.1 (Egelhofer et al., unpublished work). In analogy to the spectral count the ion count is the number of times a certain peptide ion signal, as defined by its mass to charge ratio (m/z) and retention time, is recorded at the MS level throughout the shotgun proteomics LC-MS analysis. Phosphopeptide abundance also was determined by integration of the peptide ion signal peak with the Xcalibur software version 2.0.7 SP1.
Protein Interaction Network Analysis
A positive reference set was produced by selecting the 141 Arabidopsis proteins with the most known binary interactions (maximum 132, average of 5) supported by the most experimental approaches (average of 3) and at least 3 literature references from the BioGRID v.3.1. A random reference set was used as a null model and produced by randomly selecting a set of 141 proteins from all Arabidopsis open reading frames in TAIR10 and subsequently iteratively purging all proteins with known interactions in the BioGRID. Protein interaction networks were generated with the STRING database v.9.0 with different score (confidence) thresholds, tolerating the maximum of 500 binary interaction partners for the input set. For the query with the set of 141 MPK substrate candidates, an additional maximum of 500 binary interactions of a greater depth, i.e. binary interactions not directly linked to the input set (white nodes) were tolerated. All network analysis and visualization was done with Cytoscape v.2.8 (8). The average clustering coefficient <C> was adjusted to account for an equal number of nodes including isolated nodes in all networks by normalizing to the number of input nodes recognized by STRING (639). GO enrichment analysis was done with the BiNGO plugin (9).
RESULTS AND DISCUSSION
MOAC Enables Enrichment of Putative in vivo MPK Substrate Candidates
Unambiguous data on in vivo MPK substrate phosphorylation are limited in plants. A few reports describe the characterization of bona-fide target proteins of MPK3 and MPK6 in Arabidopsis with supporting functional data. Such confirmed in vivo MPK3/6 substrates are ACS2/6 (4, 10), PHOS32 (11), EIN3 (12), SPEECHLESS (13), ERF104 (14), NIA2 (15), and WRKY33 (16). However, the diverse roles of MPK3, MPK6, and other MPKs in cell signaling suggest there are many more, yet unidentified MPK substrates in plants. To globally identify MPK3/6 protein substrates in Arabidopsis we used transgenic Arabidopsis seedlings conditionally expressing tobacco NtMEK2DD, which was previously shown to strongly activate endogenous MPK3/6 in this plant (3, 4). We prepared phenolic total protein extracts from GVG::FLAG-NtMEK2DD transgenic plants at the 6-hour time point post DEX treatment and confirmed both induced expression of FLAG-tagged NtMEK2DD and phosphorylation of endogenous MPK3/6 protein (Fig. 1A). We applied a MOAC method for the enrichment of phosphoproteins to identify phosphorylation substrate proteins of MPK3/6 and, eventually also of other MPKs (17, 18). MOAC enrichment of phosphoproteins is based on the electrostatic affinity of the phosphate group to Al(OH)3. Phosphoproteins were enriched from denatured total protein samples by MOAC and both total protein and MOAC-enriched phosphoprotein fractions were subjected to Western blotting and immunodetection analyses using antibodies against the phosphorylated high- or low-stringency MPK phosphorylation site motif (PX(pS/pT)P or (pS/pT)P). The results in Fig. 1B show that presumably phosphorylated MPK substrate candidate proteins were detected with higher signal intensity in the MOAC fraction than in the total protein extract. This result strongly suggested that the MOAC procedure indeed enables enrichment of potential MPK(3/6) substrate proteins. As a result of the NtMEK2DD-mediated activation of MPKs, most notably MPK3/6 (4), about a dozen endogenously phosphorylated MPK substrate candidate proteins were specifically detected in MOAC samples of DEX-treated GVG::FLAG-NtMEK2DD plants when compared with the controls (Fig. 1B).
Fig. 1.
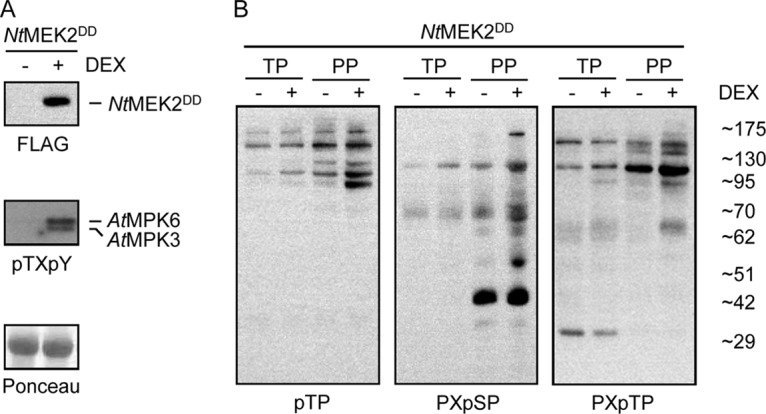
MOAC-enriched protein substrates of in vivo activated MPKs. Twelve-day old GVG::FLAG-NtMEK2DD seedlings were treated with ethanol as a control (-) or with 1 μm DEX in ethanol (+) to activate transgene expression. Six hours after treatment seedlings were harvested in liquid nitrogen and ground to a fine powder. A, Total protein was extracted and analyzed by SDS-PAGE, Western blotting analysis, and immunodetection with specific antibodies to examine expression of the transgene (FLAG) and phosphorylation of MPK3/6 (pTXpY). The blot was stained with Ponceau S to check gel loading. B, Phosphoproteins were enriched by MOAC. Aliquots of total protein (TP) and phosphoprotein (PP) fractions were loaded on denaturing polyacrylamide gels. After gel electrophoresis and Western blotting membranes were probed with several phospho-motif-specific antibodies recognizing low- (pTP) or high- (PXpSP, PXpTP) stringency MPK phosphorylation sites.
In-depth Phosphoproteome Analysis by Tandem MOAC
Next, we embarked on a tandem MOAC strategy to identify in vivo MPK substrates. The successive Al(OH)3–based MOAC of phosphoproteins in a first, and TiO2-MOAC of phosphopeptides in a second step strongly enriched the phosphoproteome. The tandem approach allowed for the recording by LC-MS/MS of low abundant, transiently phosphorylated peptides, and it allowed the direct identification and site-specific quantification of differential phosphorylation events induced by in planta activation of MPKs, most likely MPK3 and MPK6. In three replicate experiments, LC-MS/MS analysis of the phosphopeptide fraction of tandem MOAC yielded 1′905 MS/MS spectra annotated as phosphopeptides (pPSMs) with PD (Supplemental Table S1) and 1′505 pPSMs annotated with MQ (Supplemental Table S2). The three biological replicates produced 2′201 total pPSMs annotated by either or both softwares, which yielded 1′012 nonredundant phosphopeptides. These were mapped to 382 phosphoproteins. All pPSMs and corresponding MS/MS spectra can be found in PRIDE (http://www.ebi.ac.uk/pride/) and the ProMEX database (http://promex.pph.univie.ac.at/promex/). Tandem MOAC achieved a phosphopeptide enrichment of 55% (∑pPSM/∑PSM) and a phosphoprotein enrichment of 38% (∑P-proteins/∑Proteins). PD and MQ both implement a specialized, probabilistic scoring algorithm for the interpretation of MS/MS spectra of phosphopeptides to map phosphosites to the primary structure of a peptide. In total 733 phosphosites were identified, 362 of these were not found in the P3DB (19) or PhosPhAt (20) protein phosphorylation databases.
Protein abundance was determined by spectral counting which revealed that DEX treatment per se did not appreciably change protein abundance (Fig. 2A). This finding suggests that changes in the phosphoproteome most likely resulted from DEX-induced accumulation of active NtMEK2 rather than from DEX-induced differential expression of genes encoding phosphoproteins (Fig. 2A). This conclusion is supported by RT-qPCR analysis of more than 100 gene transcripts which include mRNAs for proteins found to be phosphorylated in this study (Supplemental Fig. S1). Moreover, in each of the three experiments performed DEX-treated and control samples could readily be separated in a principal component analysis based on differential abundance of all recorded peptide ions validating that the three biological replicates yielded similar results (Fig. 2B).
Fig. 2.
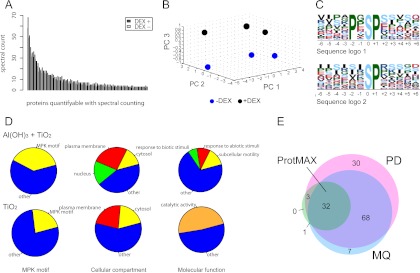
Tandem-MOAC LC-MS/MS analysis of in vivo MPK protein substrate candidates. A, DEX treatment of GVG::FLAG-NtMEK2DD plants did not lead to a significant change in protein abundance. The cumulative spectral count of all proteins (three nonsignificant outliers were removed) in DEX-treated and control plants with a total spectral count of 6 or greater in the three repetitive experiments (average spectral count of 1 in each analysis) is plotted. Protein abundance was not significantly up- or down-regulated following DEX treatment (paired Student's t test, α = 0.05, p value = 0.51). B, Principal component analysis (PCA) of all quantified peptide ion signals in the three experiments separates DEX- from mock-treated samples. Peptide ions with cumulative ion counts in all six shotgun proteomics LC-MS/MS analyses that were below the 25% quantile were removed. Remaining ion counts were log10 transformed. PCA was done using COVAIN software (21). C, Sequence logo of the phosphorylation sites mapped to peptide amino acid sequences with the MaxQuant software generated using Motif-X with a significance of 0.000001 and the IPI Arabidopsis proteome as background. The MPK high-stringency phosphorylation motif (PXpSP) was the highest scoring motif (motif score 24.19, fold increase 23.47) followed by the low-stringency motif (pSP) (score 16, fold increase 6.26). D, GO annotations of phosphorylated proteins identified by tandem MOAC or TiO2 MOAC in DEX-treated samples only. Double MOAC substantially enriches phosphorylated proteins with a high- and/or low-stringency motif. Double MOAC significantly enriched cytosolic (13.5%, Fischer Exact test with BH-correction, p value = 2.39e-13), plasma membrane associated (26%, p value = 2.13e-13) and nuclear proteins (17.2%, p value = 0.00314) whereas TiO2 MOAC alone enriched only cytosolic (19.4%, p value = 2.42e-07) and plasma membrane associated (22.6%, p value = 0.00739) but no nuclear proteins. Double MOAC significantly enriched proteins involved in subcellular motility (an arbitrary group combining the GO categories chloroplast accumulation movement, Golgi vesicle transport, vesicle mediated transport, establishment of localization in cell, and regulation of stomatal movement; total 13.5%, each with p value = 0.03) and proteins in the GO categories response to abiotic (9.9%, p value = 0.03) and biotic stresses (6.8%, p value = 0.02). TiO2 MOAC alone only enriched proteins in the higher order GO category catalytic activity (48.4%, p value = 0.05). GO analysis was done with VirtualPlant 1.2 (22) using TAIR 9 and 10 as the background. E, The Proteome Discoverer (PD) and MaxQuant (MQ) softwares identified an overlapping set of 100 proteins containing the high- or low-stringency MPK phosphorylation motif. Site-specific phosphorylation of 32 of these motifs was significantly up-regulated following DEX-treatment (paired Student's t test, α = 0.05). Phosphopeptide abundance was quantified with the ion count using ProtMAX software.
We used Motif-X (23) to extract overrepresented patterns from identified phosphopeptides. Strikingly, we found the high-stringency MPK phosphorylation site motif predominates mapped phosphosites, followed by the minimal motif required for these proline-directed kinases (Fig. 2C). When analyzing phosphoproteins identified from DEX-treated samples, tandem MOAC strongly enriched phosphoproteins with these MPK phosphorylation site motifs when compared with TiO2 enrichment alone (Fig. 2D). In addition, there was much higher enrichment of nuclear proteins by tandem MOAC. These findings suggest MPK3/6 substrates predominantly localize to the nucleus (Fig. 2D). The high enrichment of the two GO biological process categories “subcellular motility” and ‘response to biotic and abiotic stimuli’ also suggested we succeeded in the enrichment of MPK substrates, because MPK3/6 are activated by many diverse biotic and abiotic stresses and do interact with the cytoskeleton (Fig. 2D).
In all three biological replicates, PD identified 133, and MQ 108 proteins containing a phosphorylated MPK substrate phosphorylation site motif. An overlapping subset of 100 of these proteins was identified by both softwares (Fig. 2E).
Together, these data demonstrate that combined MOAC-enrichment of phosphoproteins and TiO2-based phosphopeptide enrichment allow for the analysis of in vivo phosphorylation of high- and low-abundant phosphoproteins, the detection of large numbers of novel phosphorylation sites, as well as identification of 141 MPK protein substrate candidates in just a single experiment.
Increased in vivo Phosphorylation of Potential MPK Target Proteins
To confidently identify MPK3/6-specific substrate proteins from the list of 141 phosphoproteins we first did a ranking of candidates based on three criteria: (1) presence of a known MPK substrate motif in the appropriate phosphopeptide as identified by PD, (2) presence of known MPK substrate motif as identified with MQ, and (3) the MPK phosphorylation site motif-specific regulation of phosphorylation following MPK3/MPK6 activation on DEX treatment. For relative quantification of phosphorylation we determined peptide ion counts in the DEX-treated and control samples in all three biological replicates using the ProtMAX algorithm (Supplemental Table S3). A paired Student's t test with α = 0.05 revealed phosphorylation at a MPK phosphorylation site motif of 36 out of the 141 MPK substrate candidates was significantly up-regulated by in planta activation of MPK3/6. Thirty two of these were identified by both PD and MQ (Fig. 2E). They represent the highest confidence in vivo MPK3/6 substrates on top of the ranking (Supplemental Table S4). In addition, by performing RT-qPCR analysis we excluded that phosphosite-specific regulation of the candidate proteins was because of major changes in the expression of genes for these proteins (Supplemental Fig. S1).
Among the MPK3/6-specific substrate candidates is PHOS34, which together with its closest homolog PHOS32 (>80% amino acid identity) is known to be rapidly phosphorylated on treatment of Arabidopsis suspension cells with the flagellin-derived peptide flg22, a microbe-associated molecular pattern which elicits a strong activation of MPK3/6 in Arabidopsis (11). Although PHOS32 was previously identified as a substrate of MPK3/6 (11), we show here that activation of MPK3/6 significantly up-regulates phosphorylation of PHOS34. The phosphopeptide ion count also suggested that another known substrate of MPKs, the microtubule-associated protein MAP65–1 is phosphorylated on MPK3/6 activation. Although, others have shown that MAP65–1 is phosphorylated by NRK1/NTF6 in tobacco (24) and also represents a MPK4 substrate in Arabidopsis (25), it was not excluded that MAP65–1 might be a substrate also of other MPKs.
These findings led us to additionally quantify phosphorylation at the MPK substrate phosphorylation site motifs of the 32 top phosphoprotein candidates and a few other known MPK3/6 substrates identified in this study, such as PHOS32 and MKP1 that were identified by manual integration of the phosphopeptide ion signal peaks. Almost all selected phosphopeptides were detected and precisely quantified in both DEX-induced and control samples in all three biological replicates. Significant regulation of most of the phosphosites at α = 0.05 was confirmed by this alternative, more accurate quantification procedure when peak area ratios between DEX-induced and control samples were tested with a paired Student's t test (Table I). Peak detection performed by ProtMAX is relatively simple, so part of the ion count will result from the mass spectrometric background next to the peptide ion signal. This additional component will increase mean values and decrease dispersion (standard deviation), leading to increased significance of statistical results testing these two cumulants. For instance, phosphorylation of MKP1 was found not to be induced on activation of MPK3/6 based on ion count; however it was increased twofold when peak areas were used for quantification (Table I). Phosphorylation of PHOS34 seemed to increase following DEX treatment in two of the three biological replicates (Fig. 3A), whereas it remained unchanged for MAP65–1 (Fig. 3B) which is a reported MPK4 substrate (25). The low noise level and highly similar retention times of the peptide ion signal peaks exemplify the quality and reliability of our data.
Table I. Partial list of identified and quantified MPK3/6 substrate candidate proteins. Capital letters in the peptide sequence column indicate amino acids and lower case ph indicates phosphorylation of the preceding Ser or Thr residue. MQ, Max Quant; PD, Proteome Discoverer; PEP, posterior error probability.
| ATG code | Protein description |
Peptide sequence |
Ratio DEX +/− m/z |
Charge p value | ||||
|---|---|---|---|---|---|---|---|---|
| PD PEP | PD Site probability | MQ PEP | MQ Site probability | EXP1 | EXP2 | EXP3 | ||
| AT3G55270 | MKP1, ATMKP1 | FSSLSLLPSQTS(ph)PKESR | 972.47 | 2 | ||||
| 42E-03a | 0.88a | 6.4E-04 | 0.468 | 1.9 | 2.0 | 1.8 | 1.98E-03 | |
| AT5G54430 | ATPHOS32, PHOS32 | IHHPPS(ph)PR | 510.74 | 2 | ||||
| 10E-02 | 1 | 1.9E-01 | 1 | 4.0 | 0.9 | 1.4 | 1.84E-01 | |
| AT4G27320 | ATPHOS34, PHOS34 | IHHPSS(ph)PR | 505.73 | 2 | ||||
| 65E-05 | 0.5 | 2.4E-01 | 0.883 | 2.7 | 0.9 | 1.3 | 1.78E-01 | |
| AT5G55230 | ATMAP65–1, MAP65–1 | ETLNRPAAPTNYVAISKEEAASSPVSGAADHQVPAS(ph)P | 1271.6 | 3 | ||||
| 75E-03 | 0.943 | 1.1E-01a | 0.998a | 1.1 | 0.9 | 1.3 | 2.06E-01 | |
| AT5G18230 | transcription regulator NOT2/NOT3/NOT5 | NIMGVESNVQPLTS(ph)PLSK | 997.48 | 2 | ||||
| 10E-08 | 0.998 | 5.5E-08 | 0.996 | 13.3 | 7.7 | 13.9 | 1.63E-02 | |
| AT1G60200 | splicing factor PWI domain-containing protein | MKPLVPIDYSTEEQEAVAHGGSGNT(ph)PPHLALAAEFAK | 989.72 | 4 | ||||
| 14E-07 | 0.546 | 9.1E-01 | 0.732 | 1.0 | 1.1 | 1.6 | 2.03E-01 | |
| AT5G09620 | Octicosapeptide/Phox/Bem1p family protein | VAPIPPS(ph)PVKVPQPVPEPVVLEPPQMFVDQR | 1156.27 | 3 | ||||
| 72E-03 | 1 | 1.9E-01 | 1 | 1.7 | 2.2 | 1.9 | 1.04E-02 | |
| AT4G12780 | Chaperone DnaJ-domain superfamily protein | SHLRPPGNISGSQSPPVES(ph)PGSYHSK | 928.1 | 3 | ||||
| 12E-08 | 0.766 | 1.1E-03 | 0.604 | 2.0 | 1.4 | 1.1 | 9.33E-02 | |
| AT2G41630 | transcription factor IIB | IAPSWYAKEEDLKNLSS(ph)P | 1064.5 | 2 | ||||
| 65E-04 | 0.5 | 3.3E-05 | 0.5 | 1.1 | 1.2 | 1.5 | 6.01E-02 | |
| AT3G12140 | Emsy N Terminus (ENT)/plant Tudor-like domains-containing protein | HATIQPFDVLPS(ph)PTFSAAR | 712.34 | 3 | ||||
| 21E-08 | 0.966 | 3.8E-01 | 0.924 | 5.2 | + | + | NaN | |
| AT5G23680 | Sterile alpha motif (SAM) domain-containing protein | LGDIGGDQYHQHVVAAYDS(ph)PQVR | 869.06 | 3 | ||||
| 22E-03 | 0.333 | 2.2E-02 | 1 | 1.8 | 3.5 | 1.5 | 8.62E-02 | |
| AT1G20670 | DNA-binding bromodomain-containing protein | ATDILQGS(ph)PVESGPTTPLPDKK | 777.71 | 3 | ||||
| 13E-06 | 0.912 | 1.9E-02 | 0.81 | 1.4 | 0.9 | 0.8 | 4.35E-01 | |
| AT3G26910 | hydroxyproline-rich glycoprotein family protein | AKS(ph)PGLVGHSAPLTAWNQER | 733.69 | 3 | ||||
| 34E-03 | 1 | 1.4E-01 | 0.998 | 3.8 | 3.0 | 5.4 | 2.39E-02 | |
| AT2G26530 | Protein of unknown function (DUF1645) | NFSDRLTVPFDWEETPGT(ph)PR | 815.36 | 3 | ||||
| 11E-07 | 1 | 2.7E-02 | 1 | + | + | + | NaN | |
| AT5G61960 | MEI2-like protein 1 | SSWTSESYQLKPQSSFSGSHPSGS(ph)PNAR | 1026.11 | 3 | ||||
| 27E-02 | 0.838 | 7.1E-01 | 0.474 | 1.1 | 1.5 | NaNb | 1.54E-01 | |
| AT1G28280 | VQ4, VQ motif-containing protein | LLPLFPVTS(ph)PR | 660.35 | 2 | ||||
| 21E-02 | 1 | 9.8E-02 | 0.98 | 7.7 | 13.4 | 11.7 | 1.40E-02 | |
| AT5G64330 | Phototropic-responsive NPH3 family protein | LLEHFLVQEQTEGSS(ph)PSR | 1069 | 2 | ||||
| 19E-03 | 0.963 | 7.6E-04 | 0.958 | 0.6 | NaNb | 0.8 | 1.33E-01 | |
| AT4G38470 | ACT-like protein tyrosine kinase family protein | LLHSAYDPQNRPAIEVHLVQVQPAGISADLDSTSNDAGHSS(ph)PTRK | 1218.84 | 4 | ||||
| 22E-04 | 0.141 | 1.7E-07 | 0.464 | 1.7 | 2.3 | 1.9 | 1.73E-02 | |
| AT4G12770 | Chaperone DnaJ-domain superfamily protein | SHLRPPGNISGSQS(ph)PVESSGLYHSK | 901.09 | 3 | ||||
| 21E-05 | 0.986 | 2.0E-02 | 0.646 | 1.9 | 1.9 | 1.4 | 2.01E-02 | |
| AT1G78150 | unknown protein | STPVRKPHTSTADLLTWSEVPPPDSP(ph)SSASR | 1128.54 | 3 | ||||
| 16E-05 | 0.626 | 1.0E-09a | 0.974a | 6.6 | 3.0 | 7.0 | 3.46E-02 | |
| AT3G26560 | ATP-dependent RNA helicase, putative | YSVDMS(ph)PVKIFK | 747.35 | 2 | ||||
| 76E-03 | 1 | 6.4E-12 | 1 | 1.8 | 1.1 | 1.2 | 1.03E-01 | |
| AT3G49590 | Autophagy-related protein 13 | IITDYVGS(ph)PATDPMR | 858.38 | 2 | ||||
| 20E-03 | 0.999 | 4.6E-03 | 0.976 | 1.9 | 2.1 | 2.1 | 3.63E-03 | |
| AT4G38710 | glycine-rich protein | TLPVAVVEVVKPES(ph)PVLVIVEKPK | 883.84 | 3 | ||||
| 14E-08 | 0.933 | 2.0E-01 | 1 | + | + | + | NaN | |
| AT1G50570 | Calcium-dependent lipid-binding (CaLB) domain family protein | MKLPLDIDSPTQSENSSSSQQT(ph)PKSASSR | 1062.82 | 3 | ||||
| 32E-03 | 0.304 | 2.1E-06a | 0.995a | 1.5 | 1.4 | 1.4 | 2.51E-03 | |
| AT3G13060 | evolutionarily conserved C-terminal region 5 | VAPLTGPYGLAGDFAGHLPSSILS(ph)PQAQGFYYR | 1177.57 | 3 | ||||
| 11E-06 | 0.966 | 7.8E-01 | 0.602 | 24.2 | 14.3 | 20.5 | 1.17E-02 | |
| AT2G26530 | Protein of unknown function (DUF1645) | SLS(ph)PFRVSAYPWEEQEQEQEQEQR | 1020.78 | 3 | ||||
| 72E-07 | 0.25 | 2.1E-06 | 0.499 | +b | 13.9 | 19.5 | 5.66E-02 | |
| AT5G21160 | LA RNA-binding protein | NVEDLSNDFSNTFLLDEELDLEHRS(ph)PR | 1095.49 | 3 | ||||
| 22E-02 | 0.975 | 8.2E-08 | 1 | 1.1 | 1.3 | 1.2 | 2.42E-02 | |
| AT3G11330 | plant intracellular ras group-related LRR 9 | TYVADVSEYLGSNS(ph)PRDPYLER | 871.06 | 3 | ||||
| 64E-04 | 0.822 | 9.7E-06 | 0.987 | 4.7 | 3.8 | 5.5 | 9.13E-03 | |
| AT1G64370 | unknown protein | EGYSQSQSRPVYGLS(ph)PTLNHR | 819.38 | 3 | ||||
| 61E-02 | 0.991 | 2.5E-12 | 0.67 | 1.6 | 1.2 | 1.4 | 4.19E-02 | |
| AT1G74690 | IQ-domain 31 | VHNPVVESSIQPQRS(ph)PR | 670.66 | 3 | ||||
| 37E-02 | 0.988 | 3.5E-01 | 0.994 | 3.2 | 1.7 | 6.4 | 9.24E-02 | |
| AT5G13590 | unknown protein | IINLTQVKS(ph)PVK | 710.4 | 2 | ||||
| 34E-01 | 1 | 5.5E-02 | 1 | 1.6 | 2.6 | 1.3 | 7.73E-02 | |
| AT1G28280 | VQ4, VQ motif-containing protein | YREATNLIPS(ph)PR | 748.86 | 2 | ||||
| 000172 | 1 | 0.11067 | 1 | 8.1 | 4.3 | 5.8 | 2.21E-02 | |
| AT4G38550 | PEARLI 4 family protein | NSSPPS(ph)PFHPAAYK | 790.34 | 2 | ||||
| 51E-04 | 1 | 6.5E-01 | 0.968 | 7.8 | 4.2 | 4.9 | 2.49E-02 | |
| AT1G43690 | ubiquitin interaction motif-containing protein | MVLFPKS(ph)PSPVNK | 762.38 | 2 | ||||
| 18E-03 | 0.98 | 1.5E-02 | 0.988 | 47.0 | 28.8 | 57.6 | 1.78E-02 | |
| AT1G21380 | Target of Myb protein 1 | S(ph)PEHALFTKPVYDQTEQLPPAPWETQEPR | 1157.87 | 3 | ||||
| 80E-08 | 0.892 | 8.8E-07 | 0.995 | 1.4 | 1.3 | 1.5 | 6.46E-03 | |
a Value was taken from a homologous phospho-peptide.
b Outlier.
Fig. 3.

Integration of peptide ion signal peaks for quantification of site-specific phosphorylation. Extracted ion signal chromatograms from DEX- and mock-treated samples of the peptide ions from PHOS34, MAP65–1, and VQ4 containing a phosphorylated MPK phosphorylation site motif are shown from all three experiments as examples of peak area based quantification of site-specific phosphorylation. The ion signals were extracted from the raw data with a tolerated mass error of ± 5ppm using Xcalibur software v. 2.0.7 SP1; Gaussian smoothing and baseline subtraction were applied. Ion signal peaks were integrated and the peak area was used to determine peptide abundance and calculate a quantitative ratio between DEX-treated and control samples as a quantitative measure of phosphorylation at the MPK phosphorylation site motif in the appropriate phosphopeptide.
Identification of MPK Substrates with Tandem MOAC
Although conventional TiO2-MOAC-based enrichment of phosphopeptides did not allow for the identification of known MPK substrates, tandem MOAC enabled us to identify site-specific phosphorylation of many known and yet unknown MPK substrate proteins (Table I). These include MPK3 and/or MPK6 substrates MKP1 (26), PHOS32 and its highly related homolog PHOS34 (11), and NIA2 (15). We identified phosphopeptides of all these substrates to be phosphorylated on specific serine residues. These were previously also identified as phosphorylated serines by others (11, 15, 26) and are located within MPK substrate phosphorylation motifs. Mutation of these target serine residues was previously shown to abolish MPK3/6-mediated phosphorylation of these proteins (11, 15, 26). For example, in the present study we found on DEX treatment of GVG::FLAG-NtMEK2DD plants the MPK-inactivating phosphatase MKP1 was specifically phosphorylated at serine residue 558 in the proline-directed phosphorylation motif pSP. Recently, Park et al. (26) reported that MKP1 is phosphorylated by its own substrate, MPK6, thus leading to increased MKP1 phosphatase activity. Site-directed mutagenesis of serine 558 to alanine partially blocked phosphorylation by MPK6 and reduced in vitro phosphatase activity of MKP1 (26). In sum, these findings suggest that in physiological conditions a negative feedback loop may prevent excessive activation of MPKs thus emphasizing the fine-tuning role of MPKs in cellular signal transduction.
Identification of Novel in vivo MPK3/6 Substrates
In addition to known MPK3/6 substrates we identified novel MPK3/6 target protein candidates. These include PEARLI4, a phospholipase-like protein, the plant-specific leucine-rich repeat protein PIRL9, TFIIB, NOT2/3/5, and other transcription coactivators, as well as VQ4, a VQ-motif-containing protein (Table I). Our data showed that VQ4 is highly phosphorylated at multiple MPK consensus phosphorylation sites on in planta activation of MPK3/6 (Table I). We exemplarily assessed quantitative phosphorylation at a target phosphorylation site of MPK3/6 on VQ4 by ion signal peak integration (Fig. 3C). Interestingly, MKS1, an identified MPK4 substrate in Arabidopsis (27), also belongs to the VQ protein family that comprises 34 members in Arabidopsis. The VQ-motif is highly conserved among all VQ proteins and was recently shown to specifically interact with the DNA-binding WRKY-domains of group I and group IIc WRKY proteins (28). Thus, it is possible that VQ protein phosphorylation/dephosphorylation regulates the interaction of VQs with WRKY proteins thereby influencing WRKY-mediated transcriptional control.
In Silico Analysis of MPK Substrate Interactions
To better understand the possible involvement of identified MPK substrate candidate proteins in cell signaling we explored their potential interactions in silico. We used the STRING database v.9.0 (29) to determine proximal and more distant binary interactions of the 141 MPK candidate substrates identified in this study. STRING integrates data of experimentally verified binary protein interactions and predicted protein interactions from a large number of organisms and transfers information among these organisms where applicable. We benchmarked the generated interactions using a positive reference set (PRS) containing only proteins with well-documented, experimentally verified interactions and a random reference set (RRS) comprising proteins with unknown interactions. The two sets contained a same number of proteins. Five characteristic network parameters, the number of edges, nodes, the average clustering coefficient <C>, the characteristic path length (l), and the network diameter (d) were evaluated for the PRS and the RRS using STRING confidence scores between 0.4 and 0.9. Although the number of edges and the <C> were similar for the PRS and RRS networks for all tested scores, the number of nodes, characteristic path length, and network diameter of the RRS network decreased markedly with a score of 0.8 or greater compared with the PRS network. This indicates artificial density in the RRS network caused by a few isolated nodes with high connectivity and breakdown into noncommunicating islands when less confident interactions are removed, a feature of random networks (Fig. 4A).
Fig. 4.

MPK substrate protein interaction network. A, Characteristic network parameters versus increasing input STRING scores (confidence). The number of edges and nodes, average clustering coefficient <C>, characteristic path length (l), and network diameter (d) are in the same range for a positive (PRS) and a random reference set (RRS) for scores <0.8. The number of nodes, <l> and <d> drop sharply for the RRS at higher scores indicating breakdown of the network and less confident interactions are generated with a score <0.8. B-F, Network of direct and further removed (not directly linked) binary interactions of the 141 MPK substrate candidates from the STRING database using an input score of 0.9. The nodes with pink colored outline are part of the input set of MPK substrates. GO analysis revealed significant enrichment of transcription coactivators (p value = 1.05 e-16), translation factors (p value = 1.05 e-16), and other proteins important for transcription (p value = 1.254 e-40) or translation (p value = 5.543 e-52). Also enriched were nuclear proteins (p value = 7.384 e-53) and proteins involved in the response to stress (p value = 2.348 e-8), abiotic (p value = 6.022 e-13) and biotic stimuli (p value = 3.017 e-5), and tropism (p value = 4.096 e-5). All p values are Benjamini-Hochberg corrected. The node colors correspond to significantly enriched GO categories (gray nodes do not belong to an enriched category). The network layout is organic.
To ensure highest confidence in the binary interactions generated by STRING we chose a score of 0.9 to produce a network of 552 nodes and 3820 edges for the 141 MPK substrate candidates (Supplemental Table S5, Fig. 4B). The network exhibits scale-free topology indicated by the degree distribution following a power law with a negative degree exponent (y = mx−k, R2 = 0.86). This is a feature of many cellular networks including those of protein-protein interactions. Incidentally, the power law fit is much better than for both the PRS and RRS networks produced with any score which further reflects the MPK substrate interaction network's nonrandom, actual biological character. GO annotation of the network revealed significant enrichment of proteins with a role in transcription (e.g. transcription coactivators), responses to biotic and abiotic stresses, translation, and phototropism. Many of these proteins are supposed to be localized to the nucleus (for BH corrected p values, see the figure legend).
Consistent with the literature, the various components of known MPK cascades, MEKKs, MEKs, and most notably MPK4 and MPK6 all have high network connectivity (Fig. 4C). Together with PP2C5, a phosphatase controlling their catalytic activity, and with their well-known targets of the WRKY transcription coactivator family, they represent a functional module responsive to biotic and abiotic stresses and being highly enriched in nuclear proteins. MPK6 seems to interact with nitrate reductase 2 (NIA2), one of its known substrates which we indeed identified as a MPK substrate in this study (15). NIA2 in turn interacts with nitrite reductase 1 (NII1). It connects the MPK signaling network to another module containing key enzymes of nitrogen metabolism (Fig. 4C). These are transiently regulated by phosphorylation in response to abiotic stresses such as drought, salt, or ultraviolet light (Fig. 4C).
Another novelty of plant MPK signaling disclosed in our study is the likely control of the circadian clock and phototropism by the MPK network via TIME FOR COFFEE (TIC) and NPH3 (Fig. 4D). In this work, TIC was identified as a MPK substrate candidate presumably targeted by MPK3/6 (twofold increase in phosphorylation at a low-stringency MPK phosphorylation site motif after DEX treatment as determined by peptide ion signal peak area ratios in all three experiments; p value 0.001). TIC is exclusively localized to the nucleus and loss-of-TIC function dramatically affects the expression of evening clock genes, particularly of ELF3 (30). The ELF3 protein functionally interacts with phytochromes A (HY8) and B (HY3), and it physically interacts with phytochrome B (31). ELF3 is a repressor of red (Rc) and far-red (FRc) light gating to the clock, thereby affecting entrainment, photoperiodic gene expression, and development (32).
NPH3 is indispensable for phototropism and interacts with two other light signaling components, RPT2 and PKS1 (33). These two proteins, together with NPH1, NPH2, TIC, ELF3, HY3, and HY8 seem to form an interaction network that is highly enriched for nuclear proteins and has a role in the response to abiotic stimuli and in phototropism (Fig. 4D). NPH3 is known to be reversibly phosphorylated. Phosphorylation of NPH3 occurs in the dark by an as yet unknown kinase keeping the protein in an inactive state. NPH3 activation is exerted by PHOT1-mediated dephosphorylation in the light (33). Following DEX treatment NPH3 phosphorylation is conspicuously down-regulated when compared with the control (Table I). The in planta activation of MPK3/6 and the associated NPH3 phosphorylation might trigger a counter-regulatory dephosphorylation response in plants grown in light to reduce phosphorylation of NPH3 below control levels. It is also speculated that TIC function is regulated by a still unknown kinase cascade (30). Consistent with these assumptions, NPH3 and TIC were identified as MPK substrate candidates in this work. Our results indicate that TIC activity, on ELF3 expression in the circadian clock, might be regulated by MPK3/6. Together, our findings link MPK signaling modules to the circadian clock, gating of red-light signaling to the clock, and phototropism.
Another remarkable finding in our study was the at least twofold increase in the phosphorylation, at a MPK phosphorylation site motif, of BLH2 which has been seen after MPK3/6 activation in all three experiments performed. BLH2 is a homeodomain-containing transcription coactivator. Together with other members of the BEL1-like TALE homeodomain protein family, such as BEL1 and BLH4, BLH2 physically interacts with KNOX family transcription coactivators such as STM and KNAT1/2/5 (34). These interactions are evident from Fig. 4E. The heterodimeric complexes are required for nuclear localization and transcription coactivator activity to regulate morphogenesis (34). These findings suggest the involvement of MPK signaling in organ development and growth in Arabidopsis.
MAP65–1 is another known MPK substrate that we identified. The protein is located in a cluster mediating cell cycle progression. MAP65–1 isoforms MAP65–2 and MAP70–1 as well as the proteins EB1A and EB1B, which both are involved in the regulation of mitotic spindle organization (35), localize to the same cluster as MAP65–1 (Fig. 4F).
CONCLUSION
Dynamics of protein abundance in a given cell or tissue and the transient nature of the phosphorylation event are major challenges in phosphoproteomics. These obstacles limit the identification and site-specific quantification of the phosphorylation of low-abundant proteins, such as many MPK substrates with a crucial role in cell signaling. We introduce the dual MOAC-based enrichment of phosphopeptides from complex protein samples. The approach effectively targets the phosphate moiety of phosphoproteins and phosphopeptides and, thus allows probing of the phosphoproteome to unprecedented depth. Application of tandem MOAC disclosed the identity of numerous novel phosphorylation sites and potential in vivo targets of Arabidopsis MPKs, particularly of MPK3 and MPK6, in just a single experiment. Our findings decipher involvement of MPK substrates in important biological processes such as plant response to stress, circadian clock, phototropism, and morphogenesis.
Supplementary Material
Acknowledgments
We thank Shuqun Zhang for providing seeds of GVG::FLAG-NtMEK2DD transgenic plants. We appreciate financial support of EN by the European Marie-Curie-international training network MERIT. We thank the European Project PATHONET for financial support of WH, and we acknowledge the German Science Foundation (DFG) for supporting this project.
Footnotes
*
 This article contains supplemental Fig. S1 and Tables S1 to S5.
1 The abbreviations used are:
- GO
- gene ontology
- MPK
- mitogen-activated protein kinase
- MEKK
- MEK-activating kinase
- MEK
- MPK-activating kinase
- MOAC
- metal oxide affinity chromatography
- Nt
- Nicotiana tabacum
- DEX
- dexamethasone
- MQ
- Max Quant
- PD
- Proteome Discoverer
- FDR
- false discovery rate
- PRS
- positive reference set
- RRS
- random reference set
- PCA
- principal component analysis
- ACN
- acetonitrile
- FA
- formic acid
- PEP
- posterior error probability.
REFERENCES
- 1. Herskowitz I. (1995) MAP kinase pathways in yeast: For mating and more. Cell 80, 187–197 [DOI] [PubMed] [Google Scholar]
- 2. Grimsrud P. A., Swaney D. L., Wenger C. D., Beauchene N. A., Coon J. J. (2010) Phosphoproteomics for the masses. ACS Chem. Biol. 5, 105–119 [DOI] [PMC free article] [PubMed] [Google Scholar]
- 3. Ren D., Yang H., Zhang S. (2002) Cell death mediated by MAPK is associated with hydrogen peroxide production in Arabidopsis. J. Biol. Chem. 277, 559–565 [DOI] [PubMed] [Google Scholar]
- 4. Liu Y., Zhang S. (2004) Phosphorylation of 1-aminocyclopropane-1-carboxylic acid synthase by MPK6, a stress-responsive mitogen-activated protein kinase, induces ethylene biosynthesis in Arabidopsis. Plant Cell 16, 3386–3399 [DOI] [PMC free article] [PubMed] [Google Scholar]
- 5. Colby T., Röhrig H., Harzen A., Schmidt J. (2011) Modified metal oxide affinity enrichment combined with 2D-PAGE and analysis of phosphoproteomes. Methods Mol. Biol. 779, 273–286 [DOI] [PubMed] [Google Scholar]
- 6. Beckers G. J., Jaskiewicz M., Liu Y., Underwood W. R., He S. Y., Zhang S., Conrath U. (2009) Mitogen-activated protein kinases 3 and 6 are required for full priming of stress responses in Arabidopsis thaliana. Plant Cell 21, 944–953 [DOI] [PMC free article] [PubMed] [Google Scholar]
- 7. Chen Y., Hoehenwarter W., Weckwerth W. (2010) Comparative analysis of phytohormone-responsive phosphoproteins in Arabidopsis thaliana using TiO2-phosphopeptide enrichment and mass accuracy precursor alignment. Plant J. 63, 1–17 [DOI] [PubMed] [Google Scholar]
- 8. Smoot M. E., Ono K., Ruscheinski J., Wang P. L., Ideker T. (2011) Cytoscape 2.8: new features for data integration and network visualization. Bioinformatics 27, 431–432 [DOI] [PMC free article] [PubMed] [Google Scholar]
- 9. Maere S., Heymans K., Kuiper M. (2005) BiNGO: a Cytoscape plugin to assess overrepresentation of gene ontology categories in biological networks. Bioinformatics 21, 3448–3449 [DOI] [PubMed] [Google Scholar]
- 10. Han L., Li G. J., Yang K. Y., Mao G., Wang R., Liu Y., Zhang S. (2010) Mitogen-activated protein kinase 3 and 6 regulate Botrytis cinerea-induced ethylene production in. Arabidopsis. Plant J. 64, 114–127 [DOI] [PubMed] [Google Scholar]
- 11. Merkouropoulus G., Andreasson E., Hess D., Boller T., Peck S. C. (2008) An Arabidopsis protein phosphorylated in response to microbial elicitation, AtPHOS32, is a substrate of MAP kinases 3 and 6. J. Biol. Chem. 283, 10493–10499 [DOI] [PubMed] [Google Scholar]
- 12. Yoo S. D., Cho Y. H., Tena G., Xiong Y., Sheen J. (2008) Dual control of nuclear EIN3 by bifurcate MAPK cascades in C2H4 signaling. Nature 451, 789–795 [DOI] [PMC free article] [PubMed] [Google Scholar]
- 13. Lampard G. R., Macalister C. A., Bergmann D. C. (2008) Arabidopsis stomatal initiation is controlled by MAPK-mediated regulation of the bHLH SPEECHLESS. Science 322, 1113–1116 [DOI] [PubMed] [Google Scholar]
- 14. Bethke G., Unthan T., Uhrig J. F., Pöschl Y., Gust A. A., Scheel D., Lee J. (2009) Flg22 regulates the release of an ethylene response factor substrate from MAP kinase 6 in Arabidopsis thaliana via ethylene signaling. Proc. Natl. Acad. Sci. 106, 8067–8072 [DOI] [PMC free article] [PubMed] [Google Scholar]
- 15. Wang P., Du Y., Li Y., Ren D., Song C. P. (2010) Hydrogen peroxide-mediated activation of MAP kinase 6 modulates nitric oxide biosynthesis and signal transduction in Arabidopsis. Plant Cell 22, 2981–2998 [DOI] [PMC free article] [PubMed] [Google Scholar]
- 16. Mao G., Meng X., Liu Y., Zheng Z., Chen Z., Zhang S. (2011) Phosphorylation of a WRKY transcription factor by two pathogen-responsive MAPKs drives phytoalexin biosynthesis in Arabidopsis. Plant Cell 23, 1639–1653 [DOI] [PMC free article] [PubMed] [Google Scholar]
- 17. Wolschin F., Wienkoop S., Weckwerth W. (2005) Enrichment of phosphorylated proteins and peptides from complex mixtures using metal oxide/hydroxide affinity chromatography (MOAC). Proteomics 5, 4389–4397 [DOI] [PubMed] [Google Scholar]
- 18. Röhrig H., Colby T., Schmidt J., Harzen A., Facchinelli F., Bartels D. (2008) Analysis of desiccation-induced candidate phosphoproteins from Craterostigma plantagineum isolated with a modified metal oxide affinity chromatography procedure. Proteomics 8, 3548–3560 [DOI] [PubMed] [Google Scholar]
- 19. Gao J., Agrawal G. K., Thelen J. J., Xu D. (2009) P3DB: a plant protein phosphorylation database. Nucleic Acids Res. 37, D960–D962 [DOI] [PMC free article] [PubMed] [Google Scholar]
- 20. Durek P., Schmidt R., Heazlewood J. L., Jones A., MacLean D., Nagel A., Kersten B., Schulze W. X. (2010) PhosPhAt: the Arabidopsis thaliana phosphorylation site database. An update. Nucleic Acids Res. 38, D828–D834 [DOI] [PMC free article] [PubMed] [Google Scholar]
- 21. Sun X., Weckwerth W. (2012) COVAIN: a toolbox for uni- and multivariate statistics, time-series and correlation network analysis and inverse estimation of the differential Jacobian from metabolomics covariance data. Metabolomics DOI 10.1007/s11306-012-0399-3 [Google Scholar]
- 22. Katari M. S., Nowicki S. D., Aceituno F. F., Nero D., Kelfer J., Thompson L. P., Cabello J. M., Davidson R. S., Goldberg A. P., Shasha D. E., Corruzzi G. M., Gutiérez R. A. (2010) VirtualPlant: A software platform to support Systems Biology research. Plant Physiol. 152, 500–515 [DOI] [PMC free article] [PubMed] [Google Scholar]
- 23. Schwartz D., Gygi S. P. (2005) An iterative statistical approach to the identification of protein phosphorylation motifs from large-scale data sets. Nat. Biotechnol. 23, 1391–1398 [DOI] [PubMed] [Google Scholar]
- 24. Sasabe M., Soyano T., Takahashi Y., Sonobe S., Igarashi H., Itoh T. J., Hidaka M., Machida Y. (2006) Phosphorylation of NtMAP65–1 by a MAP kinase down-regulates its activity of microtubule bundling and stimulates progression of cytokinesis of tobacco cells. Genes Dev. 20, 1004–1014 [DOI] [PMC free article] [PubMed] [Google Scholar]
- 25. Sasabe M., Kosetsu K., Hidaka M., Murase A., Machida Y. (2011) Arabidopsis thaliana MAP65–1 and MAP65–2 function redundantly with MAP65–3/PLEIADE in cytokinesis downstream of MPK4. Plant Signal. Behav. 6, 743–747 [DOI] [PMC free article] [PubMed] [Google Scholar]
- 26. Park H. C., Song E. H., Nguyen X. C., Lee K., Kim K. E., Kim H. S., Lee S. M., Kim S. H., Bae D. W., Yun D. J., Chung W. S. (2011) Arabidopsis MAP kinase phosphatase 1 is phosphorylated and activated by its substrate AtMPK6. Plant Cell Rep. 30, 1523–1531 [DOI] [PubMed] [Google Scholar]
- 27. Andreasson E., Jenkins T., Brodersen P., Thorgrimsen S., Petersen N. H., Zhu S., Qiu J. L., Micheelsen P., Rocher A., Petersen M., Newman M. A., Nielsen H., Hirt H., Somssich I., Mattsson O., Mundy J. (2005) The MAP kinase substrate MKS1 is a regulator of plant defense responses. EMBO J. 24, 2579–2589 [DOI] [PMC free article] [PubMed] [Google Scholar]
- 28. Cheng Y., Zhou Y., Yang Y., Chi Y. J., Zhou J., Chen J. Y., Wang F., Fan B., Shi K., Zhou Y. H., Yu J. Q., Chen Z. (2012) Structural and functional analysis of VQ motif-containing proteins in Arabidopsis as interacting proteins of WRKY transcription factors. Plant Physiol. 159, 810–825 [DOI] [PMC free article] [PubMed] [Google Scholar]
- 29. Szklarczyk D., Franceschini A., Kuhn M., Simonovic M., Roth A., Minguez P., Doerks T., Stark M., Muller J., Bork P., Jensen L. J., von Mering C. (2011) The STRING database in 2011: functional interaction networks of proteins, globally integrated and scored. Nucleic Acids Res. 39, 561–568 [DOI] [PMC free article] [PubMed] [Google Scholar]
- 30. Ding Z., Millar A. J., Davis A. M., Davis S. J. (2007) TIME FOR COFFEE encodes a nuclear regulator in the Arabidopsis thaliana circadian clock. Plant Cell 19, 1522–1536 [DOI] [PMC free article] [PubMed] [Google Scholar]
- 31. Liu X. L., Covington M. F., Fankhauser C., Chory J., Wagner D. R. (2001) ELF3 encodes a circadian clock-regulated nuclear protein that functions in an Arabidopsis PHYB signal transduction pathway. Plant Cell 13, 1293–1304 [DOI] [PMC free article] [PubMed] [Google Scholar]
- 32. Kolmos E., Herrero E., Bujdoso N., Millar A. J., Tóth R., Gyula P., Nagy F., Davis S. J. (2011) A reduced-function allele reveals that EARLY FLOWERING3 repressive action on the circadian clock is modulated by phytochrome signals in Arabidopsis. Plant Cell 23, 3230–3246 [DOI] [PMC free article] [PubMed] [Google Scholar]
- 33. Pedmale U. V., Liscum E. (2007) Regulation of phototropic signaling in Arabidopsis via phosphorylation state changes in the phototropin 1-interacting protein NPH3. J. Biol. Chem. 282, 19992–20001 [DOI] [PubMed] [Google Scholar]
- 34. Kumar R., Kushalappa K., Godt D., Pidkowich M. S., Pastorelli S., Hepworth S. R., Haughn G. W. (2007) The Arabidopsis BEL1-LIKE HOMEODOMAIN proteins SAW1 and SAW2 act redundantly to regulate KNOX expression spatially in leaf margins. Plant Cell 19, 2719–2735 [DOI] [PMC free article] [PubMed] [Google Scholar]
- 35. Komaki S., Abe T., Coutuer S., Inzé D., Russinova E., Hashimoto T. (2010) Nuclear-localized subtype of end-binding 1 protein regulates spindle organization in. Arabidopsis. J. Cell Sci. 123, 451–459 [DOI] [PubMed] [Google Scholar]
Associated Data
This section collects any data citations, data availability statements, or supplementary materials included in this article.