

Abstract
Thoracic aortic aneurysm is a pathological local dilatation of the aorta, potentially leading to aortic rupture or dissection. The disease is a common complication of patients with bicuspid aortic valve, a congenital disorder present in 1–2% of the population. Using two dimensional fluorescence difference gel electrophoresis proteomics followed by mRNA expression, and alternative splicing analysis of the identified proteins, differences in dilated and nondilated aorta tissues between 44 patients with bicuspid and tricuspid valves was examined. The pattern of protein expression was successfully validated with LC-MS/MS. A multivariate analysis of protein expression data revealed diverging protein expression fingerprints in patients with tricuspid compared with the patients with bicuspid aortic valves. From 302 protein spots included in the analysis, 69 and 38 spots were differentially expressed between dilated and nondilated aorta specifically in patients with tricuspid and bicuspid aortic valve, respectively. 92 protein spots were differentially expressed between dilated and nondilated aorta in both phenotypes. Similarly, mRNA expression together with alternative splicing analysis of the identified proteins also showed diverging fingerprints in the two patient groups. Differential splicing was abundant but the expression levels of differentially spliced mRNA transcripts were low compared with the wild type transcript and there was no correlation between splicing and the number of spots. Therefore, the different spots are likely to represent post-translational modifications. The identification of differentially expressed proteins suggests that dilatation in patients with a tricuspid aortic valve involves inflammatory processes whereas aortic aneurysm in patients with BAV may be the consequence of impaired repair capacity. The results imply that aortic aneurysm formation in patients with bicuspid and tricuspid aortic valves involve different biological pathways leading to the same phenotype.
Thoracic aortic aneurysm (TAA)1 is a pathological widening of the aorta, resulting from degeneration of extra cellular matrix (ECM) resulting in loss of smooth muscle cells in the tunica media. TAA is a prevalent complication in individuals with a bicuspid aortic valve (BAV), a common congenital disorder present in 1–2% of the population (1). The origin of BAV is believed to be a consequence of abnormal aortic cusp formation during valvulogenesis. The presence of BAV predisposes for progressive dilatation of the ascending aorta and thereby contributes to an increased risk of aortic aneurysm that can eventually lead to fatal rupture or dissection of the aorta. The pathophysiological basis for the commonly occurring aortopathy in patients with BAV is not known. However, previous studies on molecular mechanisms in TAA have shown that patients with tricuspid aortic valve (TAV) have diverging mRNA expression profiles compared with patients with BAV (2, 3) as well as diverging alternative splicing fingerprints in the transforming growth factor-beta signaling pathway (4). These results suggest that different molecular mechanisms are involved in TAA formation in patients with TAV and BAV.
In the present study we sought to analyze protein and gene expression profiles in dilatation of ascending aorta between TAV and BAV to identify novel candidate proteins associated with dilatation in the two phenotypes. Our approach to proteomic analysis involved two dimensional fluorescence difference gel electrophoresis (2D-DIGE), followed by gel-free isotope tag based LC-MS/MS that was used as independent validation for the 2D-DIGE analysis. Multivariate data analysis (MVA) was applied to spot (2D-DIGE) and protein (LC-MS/MS) expression levels in patients with dilated and nondilated aorta. In addition, we also analyzed the mRNA and exon expression of the identified proteins to study to what extent the changes in mRNA expression and/or splicing reflect the differences observed between TAV and BAV at protein level. The results imply that the two phenotypes, BAV and TAV, indeed have different molecular fingerprints leading to divergent molecular mechanisms of dilatation at both proteomic and transcriptomic levels.
EXPERIMENTAL PROCEDURES
Clinical Samples
Aortic biopsies were obtained through the Advanced Study of Aortic Pathology (ASAP) (5). Written informed consent from all participants had been obtained according to the declaration of Helsinki and with approval by the ethics committee of the Karolinska Institute (application number 2006/784–31/1). The study included BAV and TAV patients undergoing aortic valve surgery with a reconstitution of a dilated aorta and patients that only underwent aortic valve surgery (nondilated controls) at the Karolinska University Hospital, Stockholm, Sweden. Aortic biopsies were taken from the anterior (convex) part of the aorta i.e. the site of aortotomy a few centimeters above the aortic valve. All patients were accepted for surgical treatment of aortic valve disease (aortic stenosis, ICD code: I35.1, or aortic regurgitation, ICD code: I35.0) and/or dilatation of the ascending aorta (ICD code: I71.2) (5). All aortic biopsies were obtained with the patient on normal thermic cardiopulmonary bypass after aortic crossclamping and myocardial arrest with the patient in general anesthesia. Induction of anesthesia was obtained by fentanyl, propofol, tracrium, and midazolam whereupon sevorane was used until initiation of bypass during which propofol and fentanyl were used. None of the patients had significant coronary artery disease according to coronary angiography. Marfan syndrome patients were excluded from the study. Definition of dilatation was based on an aorta dilatation of >45 mm (dilated) or <40 mm (nondilated). Thoracic aorta dilatation measurements were taken at the point of the aorta showing maximal dilatation. The measurements were performed during anesthesia using transesophageal echocardiography. Tissue biopsies were frozen on dry ice directly after excision at the surgery. The samples were thereafter stored at −80 °C until the day of protein extraction. The samples were anonymized directly after the surgery before the experimental procedures and analysis.
Protein Extraction and Sample Labeling for Analytical and Preparative Gels
The intima-media tissue layers from 22 dilated (6 TAV and 16 BAV) and 22 nondilated (15 TAV and 7 BAV) aorta tissues were dissolved in a cell lysis buffer (2D protein extraction buffer V from GE Healthcare including 30 mm Tris buffer pH 8.0) including a protease inhibitor mixture, Complete Mini Roche EDTA free (to prevent protease degradation of proteins). There were in total 14 females and 30 males. Twenty-five patients had hypertension and seven patients were diagnosed with diabetes. The tissue samples were, thereafter, mechanically homogenized using TissueLyzer system (Qiagen, Dorking, Surrey, UK) according to manufacturer's instructions. The samples were subsequently sonicated in a water bath sonicator at 4 °C (30 s sonication at high intensity followed by 30 s resting in 8 min), pelleted in a microcentrifuge at 12000 × g in 10 min at 4 °C. The protein contents in the supernatant were measured with the Bradford protein assay (BioRad, Hemel Hempstead, UK). The samples were aliquoted and stored at −80 °C. The volume of protein lysate equivalent to 5 μg total protein was used for labeling with CyDye DIGE Fluor Labeling Kit for Scarce Samples (GE Healthcare) according to manufacturer's instructions. The internal standard was composed of all the samples pooled together and labeled with Cy3 whereas each sample individually was labeled with Cy5. Five hundred micrograms of the pooled internal standard samples were used for preparative gels and labeled with Cy3 and subsequently subjected to Silver staining (Serva) to be able to pick interesting spots. Two separate preparative gels were prepared, the same spots picked from both gels and identified individually thereby securing the spot-protein ID relationship.
Two-dimensional Differential Gel Electrophoresis
The internal standard Cy3 samples and the individual Cy5 labeled samples were pooled and dissolved in DeStreak rehydration solution (GE Healthcare) with 0.5% 3–10 nonlinear pH range (NL) IPG buffer (GE Healtcare) to a final volume of 450 μl. The mixture was thereafter deposited on the first dimension isoelectric focusing (IEF) Immobiline DryStrip pH 3–10 NL, 24 cm (GE Healthcare). The strips were covered with mineral oil and left for passive rehydration for 24 h on a protean IEF system (BioRad). After rehydration, IEF was performed at 20 °C at 300 V step and hold for 3 h, 1000 V gradient for 6 h, 8000 V gradient for 3 h; it was finally completed at 8000 V step and hold for 3 h. The experimental plan was designed to allow for each sample to be thawed only once before first dimension IEF. Twelve samples at time were subjected to IEF. The IEF strips were thereafter frozen at −80 °C before second dimension IEF. The samples were run on the second dimension within the recommended limit of time from CyDye manufacturer (GE Healthcare) of one month. The IPG strips were subjected to second dimension horizontal electrophoresis HPETM Flat Top Tower system (Serva) according to the manufacturer's instructions. Briefly, the procedure was as follows below. The equlibration buffer, anode and cathode buffers, cooling fluid, large second dimension gels with plastic backing and buffer wicks were provided by the manufacturer (Serva). The strips were equilibrated before the second dimension in dithiothreitol (DTT) in equilibration buffer. The second dimension flatbed nonfluorescent gels were put onto the ceramic cooling plate with cooling fluid between the gel and the plate (the system has room for running four gels in parallel). The equilibrated first dimension strip was put into the already existing slot in the second dimension gel (with gel side down for gel-gel contact). The second sodium dodecyl sulfate polyacrylamide gel electrophoresis (SDS-PAGE) dimension with four gels was run over night according to the program below. Step 1: 100 V, 28 mA, 4W, 30 min; Step 2: 200 V, 52 mA, 12 W, 30 min; Step 3: 300 V, 80 mA, 20 W, 10 min; first dimension strips were removed after Step 3, thereafter Step 4 was launched: 220 V, 20 mA, 8 W, overnight; Step 5: 1500 V, 160 mA, 120 W, 3 h. Care was taken as to include both dilated and nondilated samples in one run including 12 first dimension and 4 second dimension samples.
Gel Scanning and Analysis
Both the analytical and preparative gels were scanned on a Typhoon FLA 9000 laser scanner (GE Healthcare). The excitation wavelength for Cy3 is 532 nm and for Cy5 633 nm, the emission wavelengths are 580 and 670 nm, respectively. Care was taken that no spot on any of the analytical gels was saturated; therefore the photo multiplier tube (PMT) of the scanner was adjusted for each gel separately to be just below the level of saturation. Progenesis SameSpots (NonLinear Dynamics) gel image analysis software was used to align the images and export the normalized spot volumes for subsequent statistical data analysis.
Protein Identification
One hundred and nine protein spots were excised from the two preparative gels, destained and subjected to in-gel digestion with trypsin (modified, sequence grade porcine, Promega, Charbonnières, France) (6). The tryptic peptides were concentrated and desalted on a micro C18 ZipTip (MilliPore) and eluted with 65% acetonitrile, containing the α-cyano-4-hydroxycinnamic acid matrix, and applied directly onto the metal target followed by matrix assisted laser desorption/ionization time of flight mass spectrometry (MALDI-TOF MS) (Ultraflex III TOF/TOF, Bruker Daltonics, Billerica, MA). Peptide mass fingerprints (PTMs) were generated following the manufacturer's instructions and presented with the proprietary software FlexAnalysis v3.3. Peptide spectra were internally calibrated using autolytic peptides from trypsin (m/z 842.51, 1045.56, 2211.11, and 3337.76). Searches in the NCBInr sequence database (the current available at time of search) using the ProFound tool (http://prowl.rockefeller.edu/prowl-cgi/profound.exe) were made to identify the proteins. One missed cleavage, and partial oxidation of methionine were allowed during the search. All searches were performed with a tolerance of ±0.03 Da. Criteria for acceptance of identified proteins was based on score value derived by the search engine ProFound together with the number of missed cleavages and physical migration on the 2D gel compared with theoretical values.
RNA Extraction and Array Hybridization
mRNA expression analysis and mRNA extraction and preparation has been presented previously (2). Briefly, the intima-medial layer of the vascular specimens were isolated by adventicectomy, incubated with RNAlater (Ambion), and homogenized using FastPrep method (Qbiogene, Irvine) with Lysing Matrix D tubes (MP Biomedicals, Germany). The RNA samples were hybridized and scanned at the Karolinska Institute microarray core facility. Affymetrix GeneChip® Human Exon 1.0 ST arrays and protocols were used.
Statistical Data Analysis
A series of different multivariate statistical tools have been used to analyze protein expression, meta probe set (gene) as well as core probe set (exon) expression. These tools include principal component analysis (PCA) (7), and orthogonal projections to latent structures discriminant analysis (OPLS-DA) (8, 9). The multivariate models presented were all mean centered and unit variance scaled before the analysis. The model complexity was estimated according to cross-validation (10). The software used for multivariate models was Simca p + 12.0.1 × 64 (Umetrics), unless otherwise stated. Import of Affymetrix GeneChip Exon ST 1.0 CEL files, subsequent robust multichip average (RMA) (11) normalization followed by SI calculations were made using OneChannelGUI package for R (12).
Multidimensional data obtained by screening several patient samples with regard to protein/gene/exon level expression can be considered as a set of patient vectors, where the expression of all proteins/genes/exons in a particular row defines the position of the vector in the multivariable space, thereby describing the particular patient sample with regard to its protein/gene/exon expression. Each patient sample will thereby have a unique expression profile that displays a summary of all the proteins/genes/exons present in the data set, i.e. an expression fingerprint for that particular patient (4). PCA explains the variance-covariance structure of a set of variables by using linear combinations of those (7). The linear combination represent a new coordinate system that is obtained by rotating the original variable space. The new axes acquired will represent the directions with maximum variability where PC1 indicates the direction of the highest variability followed by consecutive PCs with diminishing variability orthogonal to the previous PC or PC plane.
OPLS-DA is a multivariate analysis method of choice when a quantitative relationship between a data matrix X, in our case expression levels of different proteins/genes/exons, and a vector, Y, containing qualitative values (class belonging) need to be analyzed together (8). OPLS-DA separates the systematic variation in X into two parts, one that is linearly related to Y and one that is unrelated (orthogonal) to Y. The systematic variation observed in X that is not correlated to the response set Y is through this mathematical operation removed. The opportunity arises thereby to study only the variation that is correlated to the classification of interest. Two new units obtained from PCA and OPLS-DA, scores and loadings can be further examined. The scores give information about the patients projected onto a lower dimensional plane. The loadings, on the other hand, reveal how the PC model plane is inserted into the variable space and thereby can be used to interpret the meaning of the scores. Quality parameters for all multivariate analysis models (derived from cross-validation) performed in this study are shown in Supplemental Table S1.
Protein Level Statistical Data Analysis
Protein expression data (302 normalized spot volumes from 2D-gel) were subjected to both PCA and OPLS-DA analyses with regard to TAV (15 nondilated and six dilated) and BAV (seven nondilated and 16 dilated) patients separately with dilated and nondilated qualitative Y variable. Patients were color coded in both TAV (eight females) and BAV (six females) PCA according to sex to find out whether there are sex specific groupings in the data set. The results showed that no such groupings could be observed (data not shown). The significance of differentially expressed proteins was analyzed by means of loadings in OPLS-DA models for TAV and BAV including jack-knife confidence levels (9, 10) of the loadings. The significance was calculated as ABS (loading) - ABS (jack-knife confidence interval); if positive indicates significant protein. The TAV model loadings were plotted against BAV model loadings in a combined model scatter plot to identify TAV and BAV specific differential protein expression events. The combined model scatter plot is informative because it reveals several important characteristics about the data. To start with, the level of contribution of each protein spot to the model can be interpreted, the further away a protein spot is situated from the origin, the higher is the impact on the model. Furthermore, shared and discriminative proteins spots between the two models can be identified. A novel protein, not shown to be involved in thoracic aortic aneurysm previously, LDH, found to be statistically significant according to jack-knife confidence levels, was chosen for validation with Western blot. In an additional analysis PCA and OPLS-DA were applied to 22 nondilated patient samples with TAV and BAV in contrast to the other analyses that are based on nondilated versus dilated aorta tissue samples in TAV and BAV respectively.
mRNA Expression Level Statistical Data Analysis
In the present study, PCA (7) was applied to meta probe set (gene) expression data for 43 unique genes that were identified by protein expression analysis and 81 patients including 51 dilated (15 TAV, 36 BAV) and 30 nondilated (14 TAV, 16 BAV) previously published thoracic aorta intima/media samples (4). Both PCA and OPLS-DA were applied to this data set. GAPDH, HBA1, and MYL12B were extracted from Full evidence level. All other genes were extracted from Core evidence level and Unique hybridization target. Before the multivariate analyses, the mRNA expression data (meta probe set) was RMA normalized, scaled to unit variance (UV) and mean centered as described above. Dilated and nondilated samples were color coded in the scores plot and the first three PCs (contributing the most to the variation in the multidimensional data space). The analyses were performed on TAV and BAV aorta tissue subsets separately, with dilated and nondilated samples as two discriminant Y variable groups. The significance of differentially expressed genes was analyzed using loadings in OPLS-DA models for TAV and BAV including jack-knife confidence levels (9, 10) of the loadings as described above.
Exon Level Statistical Data Analysis
The exon and mRNA level data were preprocessed with Robust Multichip Average (RMA) (11), followed by splice index (splice index = log2 (probe set intensity/transcript expression level)) calculation on core level, UV scaling and mean centering on 393 probe sets that belong to the 43 genes analyzed above. Thus, the exon level data was normalized with respect to whole transcript (gene) expression. Both PCA and OPLS-DA were applied to this data set. Genes with only one probe set (HSP90AB1, TAGLN2, and TUBB) together with the three genes (GAPDH, HBA1, and MYL12B) that were extracted from Full evidence level at gene level were excluded from exon analysis. The significance of differentially expressed exons was analyzed by means of loadings in OPLS-DA models for TAV and BAV including jack-knife confidence levels (9, 10) of the loadings, as described above.
LC-MS/MS Validation
Four volumes of ice cold acetone was added to protein extracts (in the lysis buffer used above for protein extraction) from 21 selected patients (five TAV nondilated, five TAV dilated, five BAV nondilated, and six BAV dilated, all of which also were included in the 2D-DIGE analysis), and each mixture was inverted three times and incubated at −20 °C for 1 h. A 10 min centrifugation at 12,000 × g (4 °C) followed, after which the supernatant was discarded and the pellet was washed with 0.5 ml of acetone. After redissolving the pellet in 1% SDS, each sample was further diluted in two steps to 0.2% SDS, and protein concentration determined with the Dc protein assay (Bio-Rad). According to the concentrations estimated, equal total protein amounts from each sample were taken and TEAB (triethylammonium bicarbonate buffer, pH 8.5) was added to 50 mm (and SDS diluted to 0.1%). Reduction of cysteines was performed by addition of 2 μl of 50 mm dithiothreitol and heating to 55 °C for 30 min. Carbamidomethylation followed by addition of 4 μl of 100 mm iodoacetamide. Trypsin was added 1:50 (ratio trypsin/substrate), and digestion proceeded overnight at 37 °C. From the resulting peptide mixtures, equal amounts were taken from each of the 21 samples to produce an internal standard. Three sets of eight samples (each set contained seven patient samples, with both nondilated and dilated tissue types represented, together with one internal standard) were labeled with iTRAQ8plex following the manufacturer's instructions. After pooling, all iTRAQ8-labeled peptide sets were cleaned by strong cation exchange solid phase extraction (SCX-SPE, strata-X-C, Phenomenex). Each of the three pools was then redissolved in LCMS solvent A (97% water, 3% acetonitrile (ACN), 0.1% formic acid (FA)) to obtain 1 μg/μl solutions.
The LC auto sampler (HPLC 1200 system, Agilent Technologies) injected 1 μl into a C18 guard desalting column (ZORBAX 300SB-C18, 5 μm bead size, 5 × 0.3 mm, from Agilent). We then used a 15 cm long C18 picofrit column (100 μm internal diameter, 5 μm bead size, Nikkyo Technos Co., Tokyo, Japan) installed on to the nano electrospray ionization (NSI) source. Solvent B was composed of 5% water, 95% ACN, and 0.1% FA. At a constant flow of 0.4 μl/min, the curved gradient went from 2% solvent B up to 40% solvent B in 4h. Online LC-MS was performed using a hybrid LTQ-Orbitrap Velos mass spectrometer (Thermo Scientific). Precursors were isolated with a 2 m/z window. We enabled “preview mode” for FTMS master scans, which proceeded at 30,000 resolution (profile mode). Data-dependent MS/MS (centroid mode) followed in two stages: first, the top five ions from the master scan were selected for collision induced dissociation (CID, at 35% energy) with detection in the ion trap (ITMS); and after, the same 5 ions underwent higher energy collision dissociation (HCD, at 37.5% energy) with detection in the orbitrap (FTMS). The entire duty cycle lasted ∼3.5 s. Dynamic exclusion was used with 90 s duration. Each iTRAQ8plex pool was run in analytical duplicates.
All MS/MS spectra were searched by Sequest under the software platform Proteome Discoverer 1.3.0.339 (Thermo) against the human SwissProt protein sequence database (downloaded from uniprot.org on February 2, 2012) using a target-decoy strategy. Precursor mass tolerance of 10 ppm and product mass tolerances of 0.02 Da for HCD-FTMS and 0.8 Da for CID-ITMS were used. Additional settings were: trypsin with 1 missed cleavage; carbamidomethylation on cysteine and iTRAQ-8plex on lysine and N-terminal as fixed modifications; and oxidation of methionine and phosphorylation on serine, threonine, or tyrosine as variable modifications. Quantitation of iTRAQ-8plex reporter ions was performed using an integration window tolerance of 20 ppm. Reported results have 1% false discovery rate at peptide level. The number of entries searched in the database was according to the following: Swissprot human subset downloaded from uniprot.org on February 2, 2012 was searched with 35818 protein entries containing 20909407 amino acid residues.
286 proteins were identified as common in the three pools from LC-MS/MS. All the identified proteins were subjected to OPLS-DA analysis where dilated samples were analyzed versus nondilated samples in TAV and BAV separately (according to the statistical data analysis for 2D-DIGE data). Furthermore, 35 2D-DIGE identified proteins that were also found to be present in LC-MS/MS data were analyzed separately with dilated versus nondilated samples in TAV and BAV separately and the results were compared in a combined model scatter plot where TAV model loadings were plotted against BAV model loadings.
Western Blot
Fluorescent Western blot technique, ECL Plex (GE Healthcare) with Cy5 coupled secondary (goat anti-rabbit) antibody was used for validation of differentially expressed LDH and Transferrin proteins. Transferrin was used as internal standard. Both of the primary antibodies were of rabbit origin, diluted 1:200 from Santa Cruz Biotechnology (Santa Cruz, CA). The secondary antibody was diluted 1:2500. Proteins were separated using SDS-PAGE electrophoresis on 1 mm thick pre-made gradient (4–12%) gel (Invitrogen). The same amount of protein (17.5 μg) was loaded for all the samples (4 TAV nondilated and 4 TAV dilated). The membranes were scanned with a Typhoon scanner (GE Healthcare), using the red (633) laser and 670 BP 30 filter setting for Cy5 detection.
Immunohistochemistry
Immunohistochemistry was performed on paraffin embedded sections taken from aorta of dilated and nondilated patients, stained with anti-human TTR (SC-13098), VIM (SC-66002), LDH (SC-33781), TGM2 (SC-20621), all purchased from Santa Cruz Biotechnology.
RESULTS
Protein Separation and Detection by 2D DIGE Analysis
Our approach to proteomic analysis of patients with TAA involved 2D-DIGE experiments of 44 patients with either TAV (15 with nondilated aorta and six with dilated ascending aorta) or BAV (seven with nondilated and 16 with dilated ascending aorta). Protein spots were detected using the SameSpots software in protein extracts from the intima/media region of the aorta (Fig. 1). Intergel matching was performed through the inclusion of the internal standard on each gel. Apparent protein spots (302 spots) were subsequently included in further analysis based on visual inspection of each individual spot (Fig. 1). The subsequent analysis was performed on sample/standard normalized spot volumes, thereby improving the accuracy of protein quantitation between samples from different gels.
Fig. 1.

Representative gel figure showing internal standard. Spots chosen for identification are marked in circles and numbers. The isoelectric point range is 3–10 nonlinear, as indicated on top of the figure. Statistically significant protein spots are color coded red, blue, and green according to Figure 3.
Multivariate Data Analysis of Protein Expression Data Showed Differential Protein Expression Patterns in TAV and BAV
The normalized spot volumes were subjected to multivariate data analyses, PCA, and OPLS-DA. Both PCA and OPLS-DA were performed on TAV and BAV patients separately (Fig. 2, Supplemental Table S1). The nonsupervised PCA score plot in PC1-PC3 plane showed that nondilated (black) and dilated (red) samples separate well in both TAV and BAV patients. This clustering was further highlighted when a supervised OPLS-DA model with class-belonging (dilated or nondilated) was performed (Fig. 2, Supplemental Table S1). It is clear that the dilated and nondilated tissue samples form two different clusters along the predictive component, tp1, describing correlation with the Y vector, in OPLS-DA scatter plot in both TAV and BAV models. This indicates that both patients with TAV and BAV show different protein expression profiles in nondilated and dilated tissue samples.
Fig. 2.

PCA (A, B) and OPLS-DA (C, D) of protein spot expression data. The analyses were performed on 44 patients and 302 protein spots. The Hotelling's T2 (based on 95% confidence level) tolerance ellipsoid and ellipse are shown in the scores plots of PCA and OPLS-DA, respectively. Three-dimensional scores plot showing the PC1-PC3 plane of nondilated (black) and dilated (red) thoracic aorta tissue samples with TAV (A) and BAV (B) patients separately. Two-dimensional scores plot of an OPLS-DA showing the first predictive component (tp1) and orthogal component (to1) plane of nondilated (black) and dilated (red) thoracic aorta tissue samples with TAV (C) and BAV (D) separately.
To find out what protein spots that are responsible for the clustering seen in the score plots, the loadings were analyzed (Fig. 3). The contribution of each protein spot to the separation seen among the patients (Fig. 2) can be visualized as loadings of the two separate OPLS-DA models, patients with TAV and patients with BAV (Fig. 3). Jack-Knife confidence levels derived from cross-validation of the two models were calculated and visualized together with the loadings (Figs. 3A–3C). The significance was calculated as ABS (loading)—ABS (jack-knife confidence interval); if positive indicates significant protein spot (Supplemental Table S2, Fig. 3). This calculation resulted in 69 differentially expressed protein spots between dilated and nondilated aorta specific for TAV (Fig. 3B) and 38 differentially expressed protein spots specific for BAV (Fig. 3C). As shown in Fig. 3D, 92 protein spots were commonly differentially expressed in both TAV and BAV patients (Fig. 3A). The contribution of loadings to the TAV and BAV models is also visualized in a combined model scatter plot where loadings for the TAV and BAV models are plotted against each other (Fig. 3E). In this respect, proteins that are situated in the beginning and in the end of the diagonal (red dots in Fig. 3E) show shared protein expression patterns between TAV and BAV, proteins that had higher expression in dilated samples are situated in the upper right hand corner whereas proteins that display higher expression in nondilated samples can be found in the lower right hand corner on the opposite side of the diagonal in the combined model scatter plot (Fig. 3E). In similar matter, TAV specific proteins can be found along the x-axis; if higher in dilated tissue samples on the right of origin and if higher in nondilated samples on the left side of the origin (blue dots in Fig. 3E). The corresponding BAV specific proteins can be seen on the y-axis; if higher in dilated tissue samples in the upper part of the plot (positive values) and if higher in nondilated tissue samples in the lower part of the plot (negative values along the y-axis) (green dots in Fig. 3E).
Fig. 3.

Venn diagram and OPLS-DA of protein spot expression data. The significantly differentially expressed protein spots have been calculated with OPLS-DA where ABS (loadings)—ABS (jack-knife confidence interval) if positive indicates significance. The model has been applied on 302 protein spots of dilated versus nondilated samples (44 patients with and without TAA) in TAV and BAV separately. The bar plot of loadings and jack-knife confidence intervals contributing to the first PC for significant spots common for TAV and BAV models, red bars (A), statistically significant only in TAV, blue bars, and BAV, green bars (B) and (C) respectively. D, Venn diagram based on ABS (loading)—ABS (jack-knife confidence interval) significant protein spots of dilated versus nondilated samples in TAV and BAV patients separately (derived from Supplemental Table 2), color coded according to (A)–(C). E, Combined model scatter plot where loadings from TAV model of dilated versus nondilated aorta samples is plotted against loadings from BAV model of dilated versus nondilated aorta samples, color coded according to (A)–(C). Proteins that are significantly differentially expressed only in TAV and BAV are marked in blue and green respectively, whereas proteins that show statistically significant differential expression in both TAV and BAV are marked in red. 109 protein spots chosen for identification by MALDI-TOF are marked with numbers in the combined model scatter plot. The black diagonal is aimed for the interpretation purposes.
The multivariate statistics indicate that a larger proportion of protein spots are differentially expressed in patients with TAV compared with patients with BAV. In addition, an analysis based on only nondilated patients was performed (Supplemental Table S1, Supplemental Fig. S1). The analysis was based on TAV versus BAV OPLS-DA as well as a nonsupervised PCA where TAV and BAV patients have been color-coded after the analysis was performed. It is clear from the model quality parameters (Supplemental Table S1) that the model is not satisfactory, neither for PCA nor for OPLS-DA. This showed that the two clusters of TAV and BAV cannot be separated in nondilated patients, based on the protein expression of the 302 protein spots included in the analysis. There were thereby very few protein spots that showed significance in the model (Supplemental Fig. S1C).
Protein Identification
Protein spots chosen for identification by MALDI-TOF are marked with numbers in Fig. 1 and the combined model scatter plot in Fig. 3. In total, 109 protein spots were chosen for identification (Supplemental Table S3) including spots differentially expressed between dilated and nondilated aorta only in TAV, BAV or both TAV and BAV. Furthermore, protein spots that did not show any differential expression were also included (situated close to origin in Fig. 3E). The protein identification of the vast majority of identified spots showed satisfactory sequence coverage and expectation values (Supplemental Table S3). The identification of all 109 spots is shown in Supplemental Table S3. The 109 spots identified correspond to 43 individual proteins (keratin excluded). Protein ID of all identified proteins are included in Table I. One representative of each cluster of spots with same identification is shown. The selection criteria of the representative protein spot included significance in the majority of the spots, e.g. if all the spots or the majority of spots in a certain cluster of proteins with same identification (Supplemental Table S3) were significantly differentially expressed between dilated and nondilated aorta samples in TAV and/or BAV, one of the spots from that particular cluster was included in the new table (Table I) and color coded according to the fold change and significance. In the case where all spots or the majority of spots in a certain cluster did not display any significance, that cluster is represented by an empty field (e.g. transferrin, TF in Table I, Supplemental Table S3).
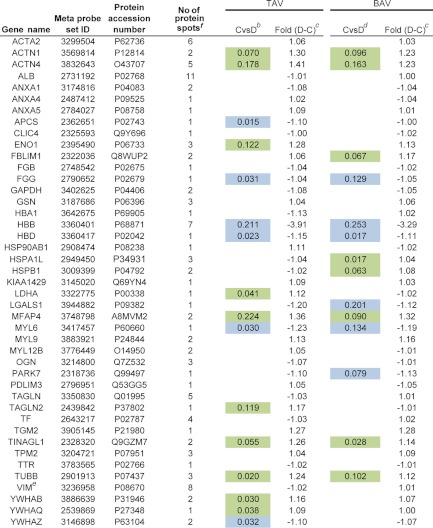
Table I. Proteins identified by MALDI TOF MS from 2D-DIGE experiments. Significant proteins according to multivariate statistics indicated. aDark green and blue indicate statistical behavior of the majority of protein spots in a particular protein cluster, whereas light blue and green on the other hand indicate the behavior of at least one of the spots for a particular protein. In the cases where all protein spots are not significant, the color is white. Dilated (D) and nondilated (C) thoracic aortic samples were examined. See Supplemental Table II for complete statistical analysis for each protein spot.
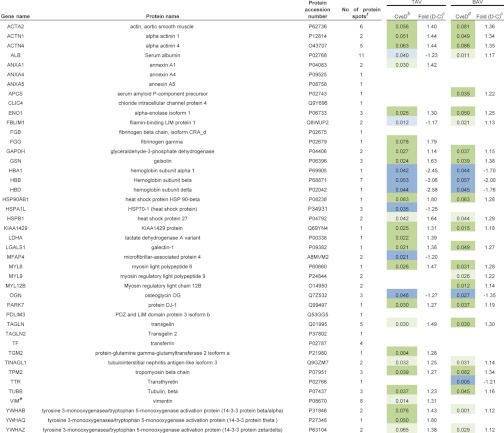
a The statistical analyses are based on nondilated versus dilated thoracic aorta samples in TAV and BAV.
b ABS (loading)-ABS(jack-knife conf interval) protein expression data, dilated higher (green), non-dilated higher (blue), TAV.
c Difference in average mean protein spot expression between the groups indicated.
d ABS (loading)-ABS(jack-knife conf interval) protein expression data, dilated higher (green), nondilated higher (blue), BAV.
e Previously published.
f Number of protein spots identified on the gel.
LC-MS/MS was chosen as a separate method of protein quantification on a subset of patients included in the 2D-DIGE analysis in order to validate the results from 2D-DIGE analysis. In the LC-MS/MS experiments, 21 patients (five TAV nondilated, five TAV dilated, five BAV nondilated, and six BAV dilated) were included, all of which also can be found in the 2D-DIGE analysis. Same multivariate analysis techniques as for 2D-DIGE experiments were also applied on LC-MS/MS data, PCA, and OPLS-DA (Supplemental Figs. S2 and S3, Supplemental Table S1). Out of 43 individual proteins identified in the 2D-DIGE analysis, 35 were also found and extracted from the LC-MS/MS analysis (Table II, Supplemental Table S4). The significance was derived from loadings in OPLS-DA as ABS (loading)—ABS (jack-knife confidence interval); if positive indicates significant protein (Supplemental Table S5, Supplemental Fig. S2). The significance was calculated as nondilated versus dilated tissue samples in TAV and BAV models separately (Supplemental Fig. S2). This calculation resulted in 12 differentially expressed proteins between dilated and nondilated aorta in TAV and 16 differentially expressed proteins in BAV (Table II). In comparison with 2D-DIGE experiments, 57 and 71% of significant differentially expressed proteins were validated with LC-MS/MS analysis in TAV and BAV respectively (Table II). Furthermore, 286 proteins identified as common in all three LC-MS/MS pools, were subjected to OPLS-DA analysis according to above and summarized together with the 35 proteins identified by 2D-DIGE in a combined model scatter plot for TAV and BAV models. It can be seen in Supplemental Fig. S3A that 2D-DIGE identified proteins (colored as red, green and blue) are found as highly contributing proteins in TAV and BAV models even in a model where all LC-MS/MS proteins were included. When comparing to the corresponding combined model scatter plot of LC-MS/MS data where only 2D-DIGE identified proteins were included (Supplemental Fig. S3B), it is clear that the two analyses are, by and large, following the same pattern, e.g. MYL6 (P60660), and PARK7 (Q99497) are both situated in the upper right hand corner in both Supplemental Figs. S3A and S3B, indicating that both have significantly higher expression level in dilated samples in both TAV and BAV patients. Similarly, HBB (P68871), and HBA1 (P69905) are both situated in the lower left hand side corner in both Supplemental Fig. S3A and S3B, indicating that both have siginificantly higher expression levels in nondilated samples in both TAV and BAV patients. On the other hand, LDHA (P00338) and MYL9 (P24844) have significantly higher expression levels in dilated samples only in TAV and BAV respectively in both Supplemental Figs. S3A and S3B. In summary, these results suggest that proteins identified as significant in 2D-DIGE analysis also are found in an overall analysis of all identified proteins with LC-MS/MS as highly contributing proteins in both TAV and BAV models.
Table II. Comparison between proteins identified by MALDI TOF MS from 2D-DIGE experiments including 44 patients and from LC-MS/MS validation experiments including 21 patients (a subgroup of patients included in the 2D-DIGE experiments). Significant proteins according to multivariate statistics indicated. aDark green and blue indicate statistical behavior of the majority of protein spots in a particular protein cluster, while light blue and green on the other hand indicate the behavior of at least one of the spots for a particular protein. In the cases where all protein spots are not-significant, the color is white. Dilated (D) and nondilated (C) thoracic aortic samples were examined. See Supplemental Table S4 for identification details on the LC-MS/MS analysis.
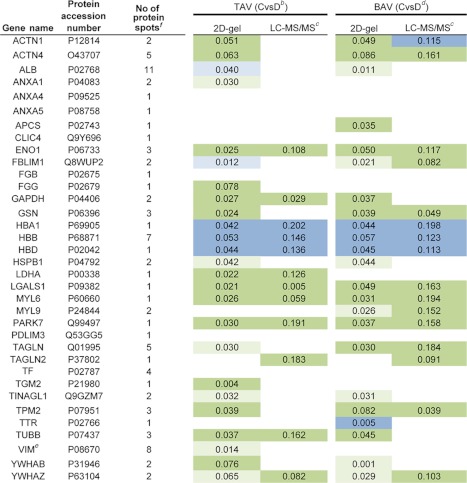
a The statistical analyses are based on non dilated versus dilated thoracic aorta samples in TAV and BAV (2D gel results are derived from Table I, with eight proteins not found in LC-MS/MS validation excluded).
b ABS (loading)-ABS(jack-knife conf interval) protein expression data, dilated higher (green), nondilated higher (blue), TAV.
c LC-MS/MS validation of 21 patients (a subgroup of patients included in the original 2D-DIGE analysis).
d ABS (loading)-ABS(jack-knife conf intervall) protein expression data, dilated higher (green), nondilated higher (blue), BAV.
e Previously published.
f Number of protein spots identified on the gel in the 2D-DIGE experiments.
Lactate dehydrogenase (LDHA) is one of the proteins that showed significant protein differential expression between dilated and nondilated aorta samples in both 2D-DIGE and LC-MS/MS experiments (Tables I, and II) and was, therefore, chosen for differential protein expression validation with Western blot. TF was chosen as internal standard for Western blot validation because of the fact that it did not show any significant differential expression between dilated and nondilated aorta. Four TAV patients with nondilated aorta and four TAV patients with dilated aorta tissues were used for Western blot experiments (Fig. 4). The results showed that LDH, when normalized to TF expression, was significantly up-regulated in dilatation compared with nondilated aorta (p = 0.015) (Fig. 4B). The differential expression of LDH in Western blot experiment is thus in concordance with the corresponding differential expression seen in the 2D gel and LC-MS/MS analyses.
Fig. 4.
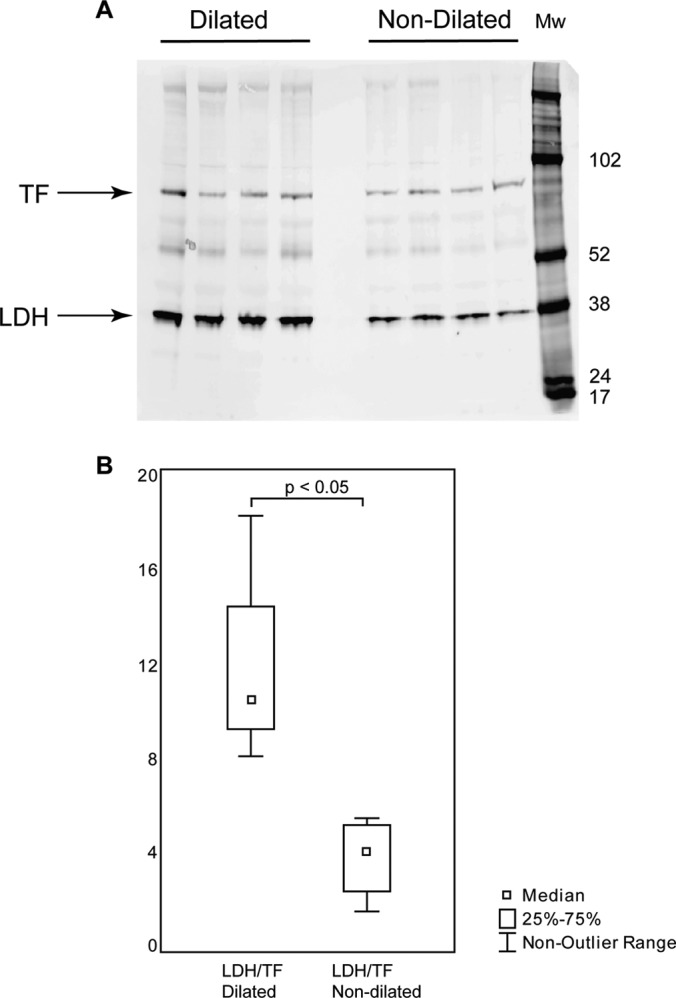
Western blot validation of differentially expressed protein LDH. Eight patients with TAV, four with dilated and four with nondilated aorta tissues, were chosen for Western blot validation. A, Western blot gel showing LDH and the internal standard TF. B, Box-plot of TF normalized LDH expression (y axis) in four dilated and four nondilated aorta tissue samples from (A).
Immunohistochemical staining of sections from the four patient groups was performed using antibodies directed against differentially expressed proteins selected from Table I. We chose antihuman antibodies against LDH,TGM2, and VIM (all up-regulated in dilated TAV), anti-TTR (down-regulated in dilated BAV). Overall, the four differentially expressed proteins chosen for IHC staining were localized in endothelial and smooth muscle cells in the vessel walls, giving further support to the 2D gel results (Supplemental Fig. S4).
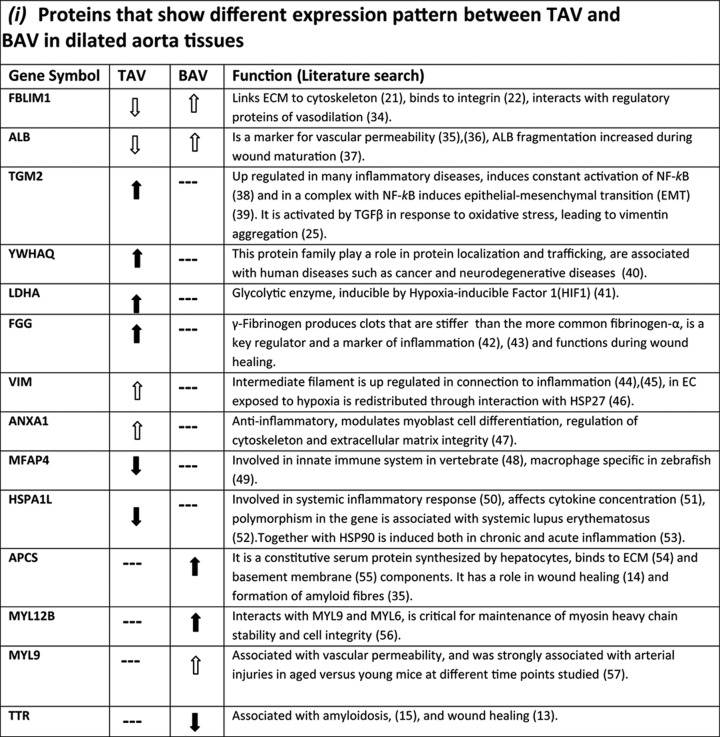
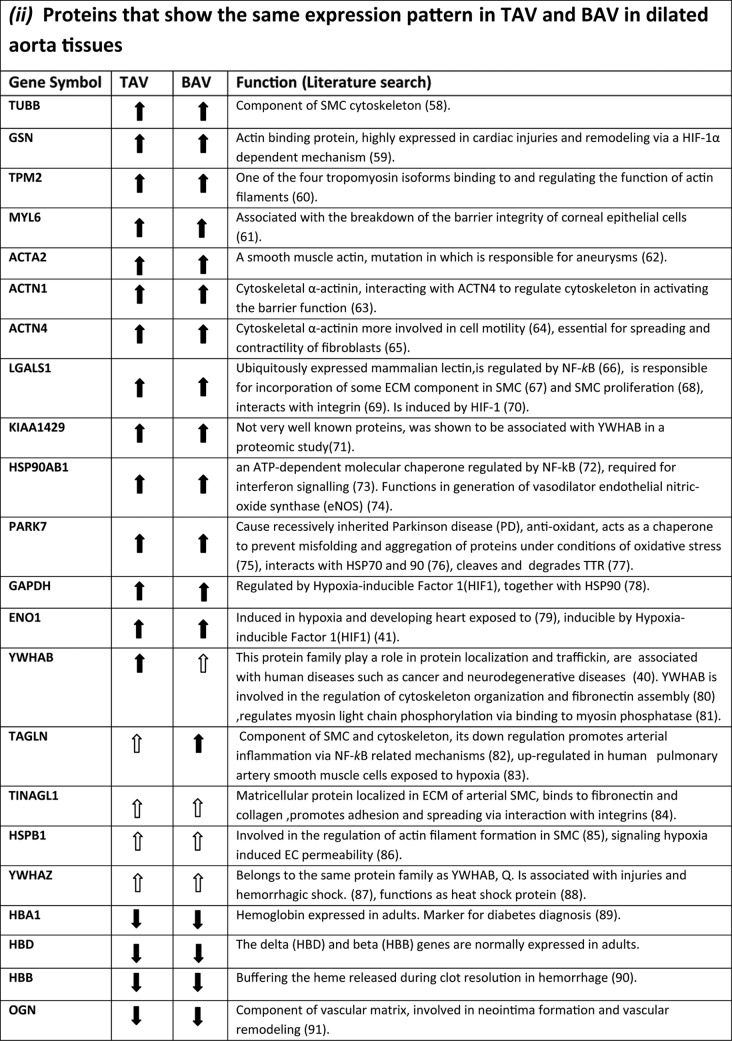
A literature search for the function of proteins differentially expressed between dilated and nondilated aorta in TAV and BAV is presented in Table III. Scrutinizing the function of proteins that are specifically regulated in each group suggests that dilatation in BAV and TAV develops via different mechanisms. In particular, proteins related to inflammation were associated with dilatation in patients with TAV whereas in BAV, proteins involved in repair processes were detected. Protein function in TAV and BAV is further covered in the Discussion section.
Table III. Functional characteristics of differentially expressed proteins between dilated TAV and BAV. ( ) statistically significant up- or down-regulated proteins in dilated aorta samples in all or the majority of spots (dark green and blue color in Table 1). (
 ) statistically significant up- or down-regulated proteins in dilated aorta samples in at least one of the spots in the same group (light green and blue color in Table 1). (—) No statistically significant change in any of the spots identified (white color in Table 1).
Aortic mRNA Expression of the Identified Proteins Differs Between Patients With TAV and BAV in Dilated and Nondilated Aorta
mRNA expression corresponding to the 43 individual proteins was subjected to multivariate data analysis, to discover which genes that are differentially expressed between dilated and nondilated aorta in patients with TAV and BAV (Supplemental Fig. S5, Supplemental Table S6, Table IV). The analysis, based on data from 29 TAV and 52 BAV patients (4), resulted in 16 and 14 differentially expressed genes according to multivariate statistics (significant according to jack-knife confidence levels and loadings) in TAV and BAV, respectively. Dilated and nondilated patients formed separate clusters in PCA in both TAV and BAV analyses as seen in three-dimensional score plot in Supplemental Figs. S5A and S5D. This was further highlighted by a good model (Supplemental Table S1) and a good separation in OPLS-DA (Supplemental Figs. S5B and S5E). Diverging expression fingerprints leading to dilatation in TAV and BAV were evident at the transcript level, with 7 and 5 genes differentially expressed only in TAV and BAV respectively (Table IV). However, although mRNA expression was able to separate patients with dilated and nondilated aorta, mRNA expression correlated poorly to the protein expression (Table I and V).
Table IV. Gene expression analysis of proteins identified by MALDI TOF MS from 2D-DIGE experiments. Significant genes according to multivariate statistics indicateda.
a The statistical analyses are based on non-dilated versus dilated thoracic aorta samples in TAV and BAV.
b ABS (loading)-ABS(jack-knife conf interval) meta probe set array expression data, dilated higher (green), non-dilated higher (blue), TAV.
c Difference in average mean meta probe set expression between the groups indicated.
d ABS (loading)-ABS(jack-knife conf interval) meta probe set array expression data, dilated higher (green), non-dilated higher (blue), BAV.
e Previously published.
f Number of protein spots identified on the gel.
Multivariate Data Analysis of Exon Expression Data
Gene level normalized exon expression (splice index) corresponding to the 43 individual proteins (393 probe sets), were subjected to multivariate data analysis to analyze differential splicing of the identified proteins (Supplemental Fig. S6, Table V, Supplemental Table S7). PCA showed a separation of dilated and nondilated clusters in both TAV and BAV (Supplemental Figs. S6A and S6B). The separation between dilated and nondilated patients in both TAV and BAV, however, was evident foremost by the good OPLS-DA model (Supplemental Table S1) and subsequent separation seen in the OPLS-DA score plot (Supplemental Figs. S6B and S6E). The number of significantly differentially expressed exons between dilated and nondilated aorta samples (normalized with respect to the whole transcript level, i.e. splice index) according to jack-knife confidence levels and loading values from OPLS-DA were 112 and 97 in TAV and BAV respectively (Supplemental Table S7, Supplemental Figs. S6C and S6F). The contribution of loadings to the TAV and BAV models was visualized in a combined model scatter plot (Supplemental Fig. S6G) where loadings for the TAV and BAV models are plotted against each other accompanied by a Venn diagram (Supplemental Fig. S6H). The combined model scatter plot clearly illustrated that 43 significant gene level normalized exons were common between TAV and BAV, 69 were TAV specific whereas 54 were BAV specific. From the multivariate analysis it was thereby evident that TAV and BAV patients show diverging exon expression fingerprints in the identified proteins between dilated and nondilated aorta tissues, implying that different protein isoforms may be present in TAV compared with BAV.
Table V. Exon expression analysis of proteins identfied by MALDI TOF MS from 2D-DIGE experiments. Significant exons according to multivariate statistics.a na - Not analyzed due to not present at core level or only one exon.
| Gene name | Meta probe set ID | Protein accession number | No of protein spotsd | TAVb | BAVc | Total number of probe sets/gene |
|---|---|---|---|---|---|---|
| ACTA2 | 3299504 | P62736 | 6 | 2 | 2 | 9 |
| ACTN1 | 3569814 | P12814 | 2 | 12 | 5 | 22 |
| ACTN4 | 3832643 | O43707 | 5 | 6 | 5 | 20 |
| ALB | 2731192 | P02768 | 11 | 1 | 2 | 16 |
| ANXA1 | 3174816 | P04083 | 2 | 1 | 1 | 11 |
| ANXA4 | 2487412 | P09525 | 1 | 3 | 6 | 15 |
| ANXA5 | 2784027 | P08758 | 1 | 4 | 0 | 13 |
| APCS | 2362651 | P02743 | 1 | 0 | 1 | 6 |
| CLIC4 | 2325593 | Q9Y696 | 1 | 0 | 0 | 2 |
| ENO1 | 2395490 | P06733 | 3 | 1 | 1 | 6 |
| FBLIM1 | 2322036 | Q8WUP2 | 2 | 4 | 4 | 8 |
| FGB | 2748542 | P02675 | 1 | 0 | 0 | 11 |
| FGG | 2790652 | P02679 | 1 | 2 | 2 | 17 |
| GAPDH | 3402625 | P04406 | 2 | na | na | |
| GSN | 3187686 | P06396 | 3 | 13 | 5 | 20 |
| HBA1 | 3642675 | P69905 | 1 | na | na | |
| HBB | 3360401 | P68871 | 7 | 4 | 3 | 5 |
| HBD | 3360417 | P02042 | 1 | 2 | 3 | 4 |
| HSP90AB1 | 2908474 | P08238 | 1 | na | na | |
| HSPA1L | 2949450 | P34931 | 3 | 1 | 1 | 6 |
| HSPB1 | 3009399 | P04792 | 2 | 2 | 0 | 4 |
| KIAA1429 | 3145020 | Q69YN4 | 1 | 7 | 8 | 31 |
| LDHA | 3322775 | P00338 | 1 | 2 | 1 | 2 |
| LGALS1 | 3944882 | P09382 | 1 | 0 | 1 | 3 |
| MFAP4 | 3748798 | A8MVM2 | 2 | 5 | 4 | 9 |
| MYL6 | 3417457 | P60660 | 1 | 0 | 2 | 2 |
| MYL9 | 3883921 | P24844 | 2 | 2 | 1 | 5 |
| MYL12B | 3776449 | O14950 | 2 | na | na | |
| OGN | 3214800 | Q7Z532 | 3 | 6 | 3 | 12 |
| PARK7 | 2318736 | Q99497 | 1 | 0 | 2 | 5 |
| PDLIM3 | 2796951 | Q53GG5 | 1 | 4 | 4 | 13 |
| TAGLN | 3350830 | Q01995 | 5 | 3 | 0 | 11 |
| TAGLN2 | 2439842 | P37802 | 1 | na | na | |
| TF | 2643217 | P02787 | 4 | 3 | 6 | 21 |
| TGM2 | 3905145 | P21980 | 1 | 7 | 1 | 17 |
| TINAGL1 | 2328320 | Q9GZM7 | 2 | 4 | 7 | 15 |
| TPM2 | 3204721 | P07951 | 3 | 2 | 4 | 13 |
| TTR | 3783565 | P02766 | 1 | 0 | 0 | 5 |
| TUBB | 2901913 | P07437 | 3 | na | na | |
| VIM | 3236958 | P08670 | 8 | 3 | 7 | 17 |
| YWHAB | 3886639 | P31946 | 2 | 5 | 3 | 10 |
| YWHAQ | 2539869 | P27348 | 1 | 1 | 1 | 4 |
| YWHAZ | 3146898 | P63104 | 2 | 0 | 1 | 3 |
a The statistical analyses are based on non-dilated versus dilated thoracic aorta samples in TAV and BAV.
b Number of exons based on ABS (loading)-ABS(jack-knife conf interval) probe set array expression data, TAV.
c Number of exons based on ABS (loading)-ABS(jack-knife conf interval) probe set array expression data, BAV.
d Number of protein spots identified on the gel.
DISCUSSION
In the present study, TAA associated protein expression in patients with BAV and TAV was identified using 2D-DIGE together with multivariate statistics. Moreover, the analysis of protein spots was combined with microarray mRNA and exon expression analysis. Our results collectively demonstrated that TAA formation in patients with BAV has clearly diverging expression fingerprints compared with the patients with TAV, at all three levels of gene, exon and protein analysis. This study provides further support to our previously performed mRNA expression analyses including all expressed genes in the human genome (2).
2D-DIGE proteomic results were validated using an independent, peptide based proteomic method, LC-MS/MS and 57 and 71% of the identified proteins were validated in TAV and BAV respectively. It is important to notice that 2D-DIGE analysis results in a number of protein spots that have been identified as the same protein, but modified potentially with post translational modifications. LC-MS/MS analysis on the other hand, identifies a number of protein isoforms that have at least one unique peptide included in their sequence. The 2D-DIGE statistical analysis was performed on 302 protein spots for which the statistics were summarized in 43 proteins in Table I, whereas LC-MS/MS statistical analysis was performed on 35 proteins (a subset of the 43 proteins from 2D-DIGE experiments because eight proteins were not identified with LC-MS/MS) (Table II). This discrepancy between the two methods nevertheless, the percentage of validated proteins turned out to be very high which clearly strengthens the results of the 2D-DIGE analysis (Table II).
Literature search of the identified proteins indicated that the function of differentially expressed proteins in medial degeneration of aorta in patients with TAV was dominated by inflammatory processes. On the other hand, the corresponding function in patients with BAV was most probably because of the impaired repair capacity in these patients. The functional repertoire of all the identified proteins is summarized in Table III. Two proteins found to be associated with BAV were the plasma protein transthyretin (TTR) and the highly conserved plasma glycoprotein, Serum Amyloid P component (SAP/APCS). The function of these two proteins in the aortopathy of BAV patients is not clear. However, TTR protein expression was reduced in dilated aorta of BAV patients as compared with BAV patients with nondilated aorta whereas APCS protein expression was increased. Hence, both proteins may function in the repair processes of the damaged vessels in BAV because the association of increased TTR with facilitated wound healing (13) and inhibition of fibroblasts differentiation by elevated level of APCS in wound healing has been reported (14). TTR is also associated with senile systemic amyloidosis (SSA), in which wild-type TTR forms amyloid deposits in various tissues, and is an age-related nonhereditary systemic amyloidosis affecting mainly cardiac functions in elderly (Reviewed in (15)). The role of TTR in amyloidosis is complex and although TTR itself has been associated with fibril formation in amyloidosis, it is also capable of acting as a protease cleaving amyloid beta peptide thereby exerting a protective role in the pathology of Alzheimer′s disease AD (16). Reductions of TTR concentration in cerebrospinal fluid of AD patients (17) and hippocampus of AD mouse model (18) was shown to be negatively correlated with disease severity. Similar to TTR, APCS is also universally found associated with amyloid depositions independently of the protein origin (19). The possibility of BAV dilatation being related to proteinopathies and the function of these two amyloidosis-related proteins in dilatation of BAV patients deserves further clarification. Furthermore, the expression of three myosin light chains, MYL6, MYL9, and MYL12B have significantly increased in dilatation of BAV whereas only MYL6 expression is also increased in TAV dilated patients. Myosin light chains are phosphorylated and thereby promote actomyosin contraction which generates pulling force between the adjacent cells and widening of the intercellular gap (20). This may imply that the process of vascular barrier breakdown is activated more significantly in BAV dilatation. This is further supported by an increased albumin expression in dilated BAV.
The only protein where one of the protein spots (isoforms) was up-regulated in dilated BAV aorta and the other protein spot (isoform) down regulated in dilated TAV is filamin binding LIM protein (FBLIM1/migfilin). FBLIM1 has several important interactions that makes it a very important molecular switch for cell-ECM and cell-cell interactions. It localizes to both cell-extracellular matrix and in endothelial cells adherens junctions via its C-terminal end LIM binding domain. However, its recruitment to ECM is via interaction with another protein, fermitin family member 2 (FERMT2/MIG2) that is not required for the FBLIM1 localization to adherens junctions. The N-terminal part of the protein binds filamin through which it regulates the cytoskeleton (Reviewed in (21)). Furthermore, it acts as a molecular switch, disconnecting filamin from integrin for regulating integrin activation and dynamics of extracellular matrix-actin linkage (22). It has been proposed that because the C-terminal domain is required for both localization of FBLIM1 to cell-ECM adhesions as well as cell-cell junctions there will be a competition between the two activities of FBLIM1 and this will dictate the relative distribution of FBLIM1 between the two pathways (Reviewed in (21)). Interestingly, we have observed a higher expression of FREMT2/MIG2 mRNA in BAV relative to TAV irrespective of the dilatation state (Maleki et al., (23)), implying that the balance between the two cellular pathways may have changed in BAV dilatation relative to TAV. This observation may be very important with respect to the differences between the dilatation in BAV and TAV and may separate the two events mechanistically. Another relevant observation in this regard is that the distribution of FBLIM1 is barely detectable in normal smooth muscle cells (SMC), but abundant in neoplastic transformed SMC, implying that its expression in SMC is related to the pathological changes (24).
Up-regulation of transglutaminase 2 (TGM2) was only detected in TAV patients. This is interesting because transforming growth factor β (TGFβ) is known to up-regulate TGM2 (25). Previous data have indicated differences in TGFβ signaling pathway between BAV and TAV patients (4, 26). Furthermore, vimentin (VIM), one of the components of intermediate filament, is a major substrate for transglutaminases (27). Hence, medial degeneration in TAV patients may be the result of vimentin crosslinking by TGM2, as has been proposed for arterial remodeling (27). Moreover, most of the proteins specifically associated with dilatation in TAV i.e. FGG, VIM, MFAP4, and HSPA1L have also been cited in association with either inflammatory diseases or inflammatory processes (Table I, Table III) which is in line with our previous observation of an increased medial inflammation in TAV but not in BAV patients (2). We propose that medial degeneration in TAV may be the result of a direct attack on the medial layer by pro-inflammatory molecules, whereas in BAV it may be secondary to the higher permeability and diminished capacity of vascular endothelium for regeneration. One of the factors which may contribute to higher permeability of endothelial layer can be the constant exposure of BAV aorta to abnormal hemodynamics as has been demonstrated (28, 29). In support of this argument, we have recently shown that in BAV aorta, there is an angiostatic profile of gene expression, containing several EC-specific-genes, even in nondilated aortas (23).
Although both mRNA expression and protein expression could separate patients with dilated aorta from patients with nondilated aorta, it was clear that there were very few differentially expressed genes showing the same pattern of differential expression at protein level (Supplemental Table S8, Table I and IV). This is not unexpected and, in accordance with our data, other studies have shown that correlation between mRNA expression and protein expression is overall low (30). An explanation to this may be that individual half-lives of proteins are influenced by several post-translational factors which will influence the mRNA-protein expression correlation. The life time of a protein is dependent on a number of different processes, e.g. protein stability, post-translational processing (phosphorylation, and ubiqutination), as well as localization of the protein (31) (30), processes that can lead to discrepancy observed in the expression at transcript and protein levels. Furthermore, as shown from our analyses, there were several spots that could be detected representing the same protein. The different spots probably represent different post-translational modifications that will influence the comparison between mRNA level, representing the total gene expression, with the expression of a subset of the protein. Another possibility could be that the different spots represent different splice forms of the protein. We have previously analyzed differential splicing in the TGFβ signaling pathway in the same cohort (4). From this analysis it was clear that differential splicing is a common phenomena but the study also showed that the expression of the differentially spliced mRNAs were low compared with the wild-type transcript. Therefore, it is unlikely that the protein spots that could be detected by the 2D gel analyses represent different protein isoforms as a result of differential splicing. This is further supported by the lack of clear association between the presence of splicing and the number of detected protein spots.
Several previous studies have performed proteomic studies to identify protein expression associated with TAA. In only one of the studies, TAV and BAV patients were analyzed separately (32). However, in that study, only patients with dilated aorta tissues were included. By analyzing 16 patients in total, the authors showed that heat chock protein 27 was significantly lower in dilated aorta of BAV patients compared with dilated aorta of TAV patients. In the present study, heat chock protein 27 was significantly higher in dilatation in both TAV and BAV samples (Table I), whereas there is no significant difference observed between TAV and BAV in neither dilated nor nondilated samples (data not shown). Furthermore, a study of aneurysm in human ascending aorta showed that ENO1 variant (fragment) had significantly higher expression whereas VIM shows lower expression in aneurysm tissues compared with controls (33). In the present study, ENO1 protein expression was higher in dilated aorta in both TAV and BAV patients (Table I) thus showing similar pattern as the study performed by Schachner et al. VIM, however, was higher in dilated samples only in TAV, but not in BAV in the present study (Table I).
Because nondilated samples were obtained from patients with TAV and BAV undergoing valve repair it is important to evaluate their status as control samples. We have previously analyzed the global mRNA expression profiles of these samples together with control samples taken from heart transplantation donors. Based on total mRNA expression, the transplant control samples clustered close to nondilated aorta media tissue samples in a PCA thereby showing that the nondilated tissue samples have similar mRNA expression profile as the transplant control samples (2). The divergent mRNA expression and protein fingerprints further strengthen the notion that dilated samples from patients with BAV need to be compared with nondilated aorta from patients with BAV.
In summary, the present study suggests that the dilatation and medial degeneration evolves by two different mechanisms in patients with BAV and TAV. In particular, the importance of components of the wound healing machinery and inflammation for the observed differences in aortopathy between patients with BAV and TAV is highlighted.
Supplementary Material
Footnotes
* This work was supported by the Swedish Research Council, the Swedish Heart-Lung Foundation, the European Commission [FAD, Health F2 2008 200647], a donation by Fredrik Lundberg, VINNOVA [Shohreh Maleki], and Swedish Research Council post-doctoral fellowship [21629 to S.K.].
 This article contains supplemental Figs. S1 to S6 and Tables S1 to S8.
1 The abbreviations used are:
- TAA
- thoracic aortic aneurysm
- TAV
- tricuspid aortic valve
- BAV
- bicuspid aortic valve
- PCA
- principal component analysis
- PC
- principal component
- OPLS-DA
- orthogonal projections to latent structures discriminant analysis
- MVA
- multivariate data analysis
- RMA
- robust multichip average normalization
- ECM
- extra cellular matrix
- SMC
- smooth muscle cells
- DTT
- dithiothreitol
- FA
- formic acid
- ACN
- acetonitrile
- 2D-DIGE
- 2 dimensional fluorescence difference gel electrophoresis
- LC-MS/MS
- Liquid chromatography - tandem mass spectrometry
- IEF
- isoelectric focusing
- PMT
- photo multiplier tube
- MALDI-TOF MS
- matrix assisted laser desorption/ionization time of flight mass spectrometry
- PTMs
- peptide mass fingerprints
- SAP/APC
- serum amyloid P component
- AD
- Alzheimer's disease
- SSA
- senile systemic amyloidosis
- ACTA2
- actin, aortic smooth muscle
- ACTN1
- alpha actinin 1
- ACTN4
- actinin, alpha 4
- ALB
- albumin
- ANXA 1
- annexin A1
- ANXA4
- annexin A4
- ANXA5
- annexin A5
- APCS
- amyloid P component, serum
- CLIC4
- chloride intracellular channel 4
- ENO1
- enolase 1, (alpha)
- FBLIM1
- filamin binding LIM protein 1
- FGB
- fibrinogen beta chain, isoform CRA_d
- FGG
- fibrinogen gamma chain
- GAPDH
- glyceraldehyde-3-phosphate dehydrogenase
- GSN
- gelsolin
- HBA1
- hemoglobin subunit alpha 1
- HBB
- hemoglobin, beta
- HBD
- hemoglobin subunit delta
- HSP90AB1
- heat shock protein 90kDa alpha (cytosolic)
- HSPA1L
- heat shock 70kDa protein 1-like
- HSPB1
- heat shock protein 27
- KIAA1429
- KIAA1429 protein
- LDHA
- lactate dehydrogenase A
- LGALS1
- lectin, galactoside-binding, soluble, 1
- MFAP4
- microfibrillar-associated protein 4
- MYL6
- myosin, light chain 6
- MYL9
- myosin regulatory light polypeptide 9
- MYL12B
- myosin regulatory light chain 12B
- OGN
- osteoglycin
- PARK7
- Parkinson disease (autosomal recessive, early onset) 7
- PDLIM3
- PDZ and LIM domain 3
- TAGLN
- transgelin
- TAGLN2
- transgelin 2
- TF
- transferrin
- TGM2
- transglutaminase 2 (C polypeptide, protein-glutamine-gamma- glutamyltransferase)
- TINAGL1
- tubulointerstitial nephritis antigen-like 1
- TPM2
- tropomyosin 2 (beta)
- TTR
- transthyretin
- TUBB
- tubulin, beta
- VIM
- vimentin
- YWHAB
- tyrosine 3-monooxygenase/tryptophan 5-monooxygenase activation protein (14–3-3 protein beta/alpha)
- YWHA
- tyrosine 3-monooxygenase/tryptophan 5-monooxygenase activation protein (14–3-3 protein theta)
- YWHAZ
- tyrosine 3-monooxygenase/tryptophan 5-monooxygenase activation protein (14–3-3 protein zeta/delta)
- TGFβ
- transforming growth factor β
- FERMT2
- fermitin family member 2, also known as kindlin2 and Mig2
- LIM
- Lin-11, Isl-1 and Mec-3.
REFERENCES
- 1. Friedman T., Mani A., Elefteriades J. A. (2008) Bicuspid aortic valve: clinical approach and scientific review of a common clinical entity. Expert Rev. Cardiovasc. Ther. 6, 235–248 [DOI] [PubMed] [Google Scholar]
- 2. Folkersen L., Wagsater D., Paloschi V., Jackson V., Petrini J., Kurtovic S., Maleki S., Eriksson M. J., Caidahl K., Hamsten A., Michel J. B., Liska J., Gabrielsen A., Franco-Cereceda A., Eriksson P. (2011) Unraveling the divergent gene expression profiles in bicuspid and tricuspid aortic valve patients with thoracic aortic dilatation - the ASAP study. Mol. Med. 17, 1365–1373 [DOI] [PMC free article] [PubMed] [Google Scholar]
- 3. Fedak P. W., de Sa M. P., Verma S., Nili N., Kazemian P., Butany J., Strauss B. H., Weisel R. D., David T. E. (2003) Vascular matrix remodeling in patients with bicuspid aortic valve malformations: implications for aortic dilatation. J. Thorac. Cardiovasc. Surg. 126, 797–806 [DOI] [PubMed] [Google Scholar]
- 4. Kurtovic S., Paloschi V., Folkersen L., Gottfries J., Franco-Cereceda A., Eriksson P. (2011) Diverging alternative splicing fingerprints in the transforming growth factor-beta signaling pathway identified in thoracic aortic aneurysms. Mol. Med. 17, 665–675 [DOI] [PMC free article] [PubMed] [Google Scholar]
- 5. Jackson V., Petrini J., Caidahl K., Eriksson M. J., Liska J., Eriksson P., Franco-Cereceda A. (2011) Bicuspid aortic valve leaflet morphology in relation to aortic root morphology: a study of 300 patients undergoing open-heart surgery. Eur. J. Cardiothorac. Surg. 40, e118–e124 [DOI] [PubMed] [Google Scholar]
- 6. Hellman U. (2002) Peptide maping using MALDI-TOFMS. In: Silberring JE, R. (ed.) Mass Spectrometry and Hyphenated Techniques in Neuropeptide Research. Wiley, Hoboken, NJ, USA, pp. 259–275 [Google Scholar]
- 7. Jackson J. E. (1991) A User's Guide to Principal Components. Wiley, New York [Google Scholar]
- 8. Trygg J., Wold S. (2002) Orthogonal projections to latent structures (O-PLS). J. Chemometrics. 16, 119–128 [Google Scholar]
- 9. Martens H., Hoy M., Westad F., Folkenberg D., Martens M. (2001) Analysis of designed experiments by stabilised PLS Regression and jack-knifing. Chemometr. Intell. Lab. Syst. 58, 151–170 [Google Scholar]
- 10. Wold S. (1978) Cross-Validatory Estimation of Number of Components in Factor and Principal Components Models. Technometrics 20, 397–405 [Google Scholar]
- 11. Irizarry R. A., Hobbs B., Collin F., Beazer-Barclay Y. D., Antonellis K. J., Scherf U., Speed T. P. (2003) Exploration, normalization, and summaries of high density oligonucleotide array probe level data. Biostatistics 4, 249–264 [DOI] [PubMed] [Google Scholar]
- 12. Wettenhall J. M., Simpson K. M., Satterley K., Smyth G. K. (2006) affylmGUI: a graphical user interface for linear modeling of single channel microarray data. Bioinformatics 22, 897–899 [DOI] [PubMed] [Google Scholar]
- 13. Moghazy A. M., Adly O. A., Abbas A. H., Moati T. A., Ali O. S., Mohamed B. A. (2010) Assessment of the relation between prealbumin serum level and healing of skin-grafted burn wounds. Burns 36, 495–500 [DOI] [PubMed] [Google Scholar]
- 14. Pilling D., Buckley C. D., Salmon M., Gomer R. H. (2003) Inhibition of fibrocyte differentiation by serum amyloid P. J. Immunol. 171, 5537–5546 [DOI] [PMC free article] [PubMed] [Google Scholar]
- 15. Dubrey S. W., Comenzo R. L. (2012) Amyloid diseases of the heart: current and future therapies. Q.J. Med. 105, 617–631 [DOI] [PubMed] [Google Scholar]
- 16. Costa R., Ferreira-da-Silva F., Saraiva M. J., Cardoso I. (2008) Transthyretin protects against A-beta peptide toxicity by proteolytic cleavage of the peptide: a mechanism sensitive to the Kunitz protease inhibitor. PLoS One 3, e2899. [DOI] [PMC free article] [PubMed] [Google Scholar]
- 17. Gloeckner S. F., Meyne F., Wagner F., Heinemann U., Krasnianski A., Meissner B., Zerr I. (2008) Quantitative analysis of transthyretin, tau and amyloid-beta in patients with dementia. J. Alzheimers Dis. 14, 17–25 [DOI] [PubMed] [Google Scholar]
- 18. Stein T. D., Anders N. J., DeCarli C., Chan S. L., Mattson M. P., Johnson J. A. (2004) Neutralization of transthyretin reverses the neuroprotective effects of secreted amyloid precursor protein (APP) in APPSW mice resulting in tau phosphorylation and loss of hippocampal neurons: support for the amyloid hypothesis. J. Neurosci. 24, 7707–7717 [DOI] [PMC free article] [PubMed] [Google Scholar]
- 19. Kisilevsky R. (2000) The relation of proteoglycans, serum amyloid P and apo E to amyloidosis current status, 2000. Amyloid 7, 23–25 [DOI] [PubMed] [Google Scholar]
- 20. Kumar P., Shen Q., Pivetti C. D., Lee E. S., Wu M. H., Yuan S. Y. (2009) Molecular mechanisms of endothelial hyperpermeability: implications in inflammation. Expert Rev. Mol. Med. 11, e19. [DOI] [PMC free article] [PubMed] [Google Scholar]
- 21. Wu C. (2005) Migfilin and its binding partners: from cell biology to human diseases. J. Cell. Sci. 118, 659–664 [DOI] [PubMed] [Google Scholar]
- 22. Ithychanda S. S., Das M., Ma Y. Q., Ding K., Wang X., Gupta S., Wu C., Plow E. F., Qin J. (2009) Migfilin, a molecular switch in regulation of integrin activation. J. Biol. Chem. 284, 4713–4722 [DOI] [PMC free article] [PubMed] [Google Scholar]
- 23. Maleki S., Björck H. M., Folkersen L., Nilsson R., Renner J., Caidahl K., Franco-Cereceda A., Lanne T., Eriksson P. (2012) Identification of a novel flow-mediated gene expression signature in patients with bicuspid aortic valve. J. Mol. Med. DOI 10.1007/s00109-012-0942-8 [DOI] [PMC free article] [PubMed] [Google Scholar]
- 24. Papachristou D. J., Gkretsi V., Tu Y., Shi X., Chen K., Larjava H., Rao U. N., Wu C. (2007) Increased cytoplasmic level of migfilin is associated with higher grades of human leiomyosarcoma. Histopathology 51, 499–508 [DOI] [PMC free article] [PubMed] [Google Scholar]
- 25. Shin D. M., Jeon J. H., Kim C. W., Cho S. Y., Lee H. J., Jang G. Y., Jeong E. M., Lee D. S., Kang J. H., Melino G., Park S. C., Kim I. G. (2008) TGFbeta mediates activation of transglutaminase 2 in response to oxidative stress that leads to protein aggregation. FASEB J. 22, 2498–2507 [DOI] [PubMed] [Google Scholar]
- 26. Paloschi V., Kurtovic S., Folkersen L., Gomez D., Wågsater D., Roy J., Petrini J., Eriksson M. J., Caidahl K., Hamsten A., Liska J., Michel J. B., Franco-Cereceda A., Eriksson P. (2011) Impaired splicing of fibronectin is associated with thoracic aortic aneurysm formation in patients with bicuspid aortic valve. Arterioscler. Thromb. Vasc. Biol. 31, 691–697 [DOI] [PubMed] [Google Scholar]
- 27. Gupta M., Greenberg C. S., Eckman D. M., Sane D. C. (2007) Arterial vimentin is a transglutaminase substrate: a link between vasomotor activity and remodeling? J. Vasc. Res. 44, 339–344 [DOI] [PMC free article] [PubMed] [Google Scholar]
- 28. Hope M. D., Hope T. A., Crook S. E., Ordovas K. G., Urbania T. H., Alley M. T., Higgins C. B. (2011) 4D flow CMR in assessment of valve-related ascending aortic disease. JACC Cardiovasc. Imaging. 4, 781–787 [DOI] [PubMed] [Google Scholar]
- 29. Robicsek F., Thubrikar M. J., Cook J. W., Fowler B. (2004) The congenitally bicuspid aortic valve: how does it function? Why does it fail? Ann. Thorac. Surg. 77, 177–185 [DOI] [PubMed] [Google Scholar]
- 30. de Sousa Abreu R., Penalva L. O., Marcotte E. M., Vogel C. (2009) Global signatures of protein and mRNA expression levels. Mol. Biosyst. 5, 1512–1526 [DOI] [PMC free article] [PubMed] [Google Scholar]
- 31. Maier T., Guell M., Serrano L. (2009) Correlation of mRNA and protein in complex biological samples. FEBS Lett. 583, 3966–3973 [DOI] [PubMed] [Google Scholar]
- 32. Matt P., Fu Z., Carrel T., Huso D. L., Dirnhofer S., Lefkovits I., Zerkowski H. R., Van Eyk J. E. (2007) Proteomic alterations in heat shock protein 27 and identification of phosphoproteins in ascending aortic aneurysm associated with bicuspid and tricuspid aortic valve. J. Mol. Cell. Cardiol. 43, 792–801 [DOI] [PMC free article] [PubMed] [Google Scholar]
- 33. Schachner T., Golderer G., Sarg B., Lindner H. H., Bonaros N., Mikuz G., Laufer G., Werner E. R. (2010) The amounts of alpha 1 antitrypsin protein are reduced in the vascular wall of the acutely dissected human ascending aorta. Eur. J. Cardiothorac. Surg. 37, 684–690 [DOI] [PubMed] [Google Scholar]
- 34. Zhang Y., Tu Y., Gkretsi V., Wu C. (2006) Migfilin interacts with vasodilator-stimulated phosphoprotein (VASP) and regulates VASP localization to cell-matrix adhesions and migration. J. Biol. Chem. 281, 12397–12407 [DOI] [PubMed] [Google Scholar]
- 35. Maeda S. (2003) Use of genetically altered mice to study the role of serum amyloid P component in amyloid deposition. Amyloid 10 Suppl 1, 17–20 [PubMed] [Google Scholar]
- 36. Saeed M., van Dijke C. F., Mann J. S., Wendland M. F., Rosenau W., Higgins C. B., Brasch R. C. (1998) Histologic confirmation of microvascular hyperpermeability to macromolecular MR contrast medium in reperfused myocardial infarction. J. Magn. Reson. Imaging 8, 561–567 [DOI] [PubMed] [Google Scholar]
- 37. Bolitho C., Xaymardan M., Lynch G. W., Zoellner H. (2010) Vascularity during wound maturation correlates with fragmentation of serum albumin but not ceruloplasmin, transferrin, or haptoglobin. Wound Repair Regen. 18, 211–222 [DOI] [PubMed] [Google Scholar]
- 38. Kim D. S., Kim B., Tahk H., Kim D. H., Ahn E. R., Choi C., Jeon Y., Park S. Y., Lee H., Oh S. H., Kim S. Y. (2010) Transglutaminase 2 gene ablation protects against renal ischemic injury by blocking constant NF-kappaB activation. Biochem. Biophys. Res. Commun. 403, 479–484 [DOI] [PubMed] [Google Scholar]
- 39. Lin C. Y., Tsai P. H., Kandaswami C. C., Chang G. D., Cheng C. H., Huang C. J., Lee P. P., Hwang J. J., Lee M. T. (2011) Role of tissue transglutaminase 2 in the acquisition of a mesenchymal-like phenotype in highly invasive A431 tumor cells. Mol. Cancer 10, 87. [DOI] [PMC free article] [PubMed] [Google Scholar]
- 40. Dougherty M. K., Morrison D. K. (2004) Unlocking the code of 14–3-3. J. Cell Sci. 117, 1875–1884 [DOI] [PubMed] [Google Scholar]
- 41. Semenza G. L., Jiang B. H., Leung S. W., Passantino R., Concordet J. P., Maire P., Giallongo A. (1996) Hypoxia response elements in the aldolase A, enolase 1, and lactate dehydrogenase A gene promoters contain essential binding sites for hypoxia-inducible factor 1. J. Biol. Chem. 271, 32529–32537 [DOI] [PubMed] [Google Scholar]
- 42. Davalos D., Akassoglou K. (2012) Fibrinogen as a key regulator of inflammation in disease. Semin. Immunopathol. 34, 43–62 [DOI] [PubMed] [Google Scholar]
- 43. Alexander K. S., Madden T. E., Farrell D. H. (2011) Association between gamma' fibrinogen levels and inflammation. Thromb. Haemost. 105, 605–609 [DOI] [PMC free article] [PubMed] [Google Scholar]
- 44. Okumura T., Ericksen R. E., Takaishi S., Wang S. S., Dubeykovskiy Z., Shibata W., Betz K. S., Muthupalani S., Rogers A. B., Fox J. G., Rustgi A. K., Wang T. C. (2010) K-ras mutation targeted to gastric tissue progenitor cells results in chronic inflammation, an altered microenvironment, and progression to intraepithelial neoplasia. Cancer Res. 70, 8435–8445 [DOI] [PMC free article] [PubMed] [Google Scholar]
- 45. Winter A., Bornemann A. (1999) NCAM, vimentin and neonatal myosin heavy chain expression in human muscle diseases. Neuropathol. Appl. Neurobiol. 25, 417–424 [DOI] [PubMed] [Google Scholar]
- 46. Liu T., Guevara O. E., Warburton R. R., Hill N. S., Gaestel M., Kayyali U. S. (2010) Regulation of vimentin intermediate filaments in endothelial cells by hypoxia. Am. J. Physiol. Cell. Physiol. 299, C363–C373 [DOI] [PMC free article] [PubMed] [Google Scholar]
- 47. Bizzarro V., Petrella A., Parente L. (2012) Annexin A1: Novel roles in skeletal muscle biology. J. Cell. Physiol. 227, 3007–3015 [DOI] [PubMed] [Google Scholar]
- 48. Niu D., Peatman E., Liu H., Lu J., Kucuktas H., Liu S., Sun F., Zhang H., Feng T., Zhou Z., Terhune J., Waldbieser G., Li J., Liu Z. (2011) Microfibrillar-associated protein 4 (MFAP4) genes in catfish play a novel role in innate immune responses. Dev. Comp. Immunol. 35, 568–579 [DOI] [PubMed] [Google Scholar]
- 49. Zakrzewska A., Cui C., Stockhammer O. W., Benard E. L., Spaink H. P., Meijer A. H. (2010) Macrophage-specific gene functions in Spi1-directed innate immunity. Blood. 116, e1–e11 [DOI] [PubMed] [Google Scholar]
- 50. Sonna L. A., Hawkins L., Lissauer M. E., Maldeis P., Towns M., Johnson S. B., Moore R., Singh I. S., Cowan M. J., Hasday J. D. (2010) Core temperature correlates with expression of selected stress and immunomodulatory genes in febrile patients with sepsis and noninfectious SIRS. Cell Stress Chaperones 15, 55–66 [DOI] [PMC free article] [PubMed] [Google Scholar]
- 51. Schroder O., Schulte K. M., Ostermann P., Roher H. D., Ekkernkamp A., Laun R. A. (2003) Heat shock protein 70 genotypes HSPA1B and HSPA1L influence cytokine concentrations and interfere with outcome after major injury. Crit. Care Med. 31, 73–79 [DOI] [PubMed] [Google Scholar]
- 52. Furnrohr B. G., Wach S., Kelly J. A., Haslbeck M., Weber C. K., Stach C. M., Hueber A. J., Graef D., Spriewald B. M., Manger K., Herrmann M., Kaufman K. M., Frank S. G., Goodmon E., James J. A., Schett G., Winkler T. H., Harley J. B., Voll R. E. (2010) Polymorphisms in the Hsp70 gene locus are genetically associated with systemic lupus erythematosus. Ann. Rheum. Dis. 69, 1983–1989 [DOI] [PMC free article] [PubMed] [Google Scholar]
- 53. Novoselova E. G., Glushkova O. V., Cherenkov D. A., Parfenyuk S. B., Novoselova T. V., Lunin S. M., Khrenov M. O., Guzhova I. V., Margulis B. A., Fesenko E. E. (2006) Production of heat shock proteins, cytokines, and nitric oxide in toxic stress. Biochemistry 71, 376–383 [DOI] [PubMed] [Google Scholar]
- 54. de Beer F. C., Baltz M. L., Holford S., Feinstein A., Pepys M. B. (1981) Fibronectin and C4-binding protein are selectively bound by aggregated amyloid P component. J. Exp. Med. 154, 1134–1139 [DOI] [PMC free article] [PubMed] [Google Scholar]
- 55. Zahedi K. (1997) Characterization of the binding of serum amyloid P to laminin. J. Biol. Chem. 272, 2143–2148 [PubMed] [Google Scholar]
- 56. Park I., Han C., Jin S., Lee B., Choi H., Kwon J. T., Kim D., Kim J., Lifirsu E., Park W. J., Park Z. Y., Kim do H., Cho C. (2011) Myosin regulatory light chains are required to maintain the stability of myosin II and cellular integrity. Biochem. J. 434, 171–180 [DOI] [PubMed] [Google Scholar]
- 57. Shehadeh L. A., Webster K. A., Hare J. M., Vazquez-Padron R. I. (2011) Dynamic regulation of vascular myosin light chain (MYL9) with injury and aging. PLoS One 6, e25855. [DOI] [PMC free article] [PubMed] [Google Scholar]
- 58. Hilgers R. H. P., Webb R. C. (2005) Molecular aspects of arterial smooth muscle contraction: Focus on Rho. Exp. Biol. Med. 230, 829–835 [DOI] [PubMed] [Google Scholar]
- 59. Li G. H., Shi Y., Chen Y., Sun M., Sader S., Maekawa Y., Arab S., Dawood F., Chen M., De Couto G., Liu Y., Fukuoka M., Yang S., Da Shi M., Kirshenbaum L. A., McCulloch C. A., Liu P. (2009) Gelsolin regulates cardiac remodeling after myocardial infarction through DNase I-mediated apoptosis. Circ. Res. 104, 896–904 [DOI] [PubMed] [Google Scholar]
- 60. Gunning P., O'Neill G., Hardeman E. (2008) Tropomyosin-based regulation of the actin cytoskeleton in time and space. Physiol. Rev. 88, 1–35 [DOI] [PubMed] [Google Scholar]
- 61. Guo Y., Ramachandran C., Satpathy M., Srinivas S. P. (2007) Histamine-induced myosin light chain phosphorylation breaks down the barrier integrity of cultured corneal epithelial cells. Pharm. Res. 24, 1824–1833 [DOI] [PubMed] [Google Scholar]
- 62. Regalado E., Medrek S., Tran-Fadulu V., Guo D. C., Pannu H., Golabbakhsh H., Smart S., Chen J. H., Shete S., Kim D. H., Stern R., Braverman A. C., Milewicz D. M. (2011) Autosomal dominant inheritance of a predisposition to thoracic aortic aneurysms and dissections and intracranial saccular aneurysms. Am. J. Med. Genet. A. 155A, 2125–2130 [DOI] [PMC free article] [PubMed] [Google Scholar]
- 63. Singleton P. A., Dudek S. M., Chiang E. T., Garcia J. G. (2005) Regulation of sphingosine 1-phosphate-induced endothelial cytoskeletal rearrangement and barrier enhancement by S1P1 receptor, PI3 kinase, Tiam1/Rac1, and alpha-actinin. FASEB J. 19, 1646–1656 [DOI] [PubMed] [Google Scholar]
- 64. Quick Q., Skalli O. (2010) Alpha-actinin 1 and alpha-actinin 4: contrasting roles in the survival, motility, and RhoA signaling of astrocytoma cells. Exp. Cell. Res. 316, 1137–1147 [DOI] [PubMed] [Google Scholar]
- 65. Shao H., Wang J. H., Pollak M. R., Wells A. (2010) alpha-actinin-4 is essential for maintaining the spreading, motility and contractility of fibroblasts. PLoS One 5, e13921. [DOI] [PMC free article] [PubMed] [Google Scholar]
- 66. Toscano M. A., Campagna L., Molinero L. L., Cerliani J. P., Croci D. O., Ilarregui J. M., Fuertes M. B., Nojek I. M., Fededa J. P., Zwirner N. W., Costas M. A., Rabinovich G. A. (2011) Nuclear factor (NF)-kappaB controls expression of the immunoregulatory glycan-binding protein galectin-1. Mol. Immunol. 48, 1940–1949 [DOI] [PubMed] [Google Scholar]
- 67. Moiseeva E. P., Williams B., Samani N. J. (2003) Galectin 1 inhibits incorporation of vitronectin and chondroitin sulfate B into the extracellular matrix of human vascular smooth muscle cells. Biochim. Biophys. Acta. 1619, 125–132 [DOI] [PubMed] [Google Scholar]
- 68. Moiseeva E. P., Javed Q., Spring E. L., de Bono D. P. (2000) Galectin 1 is involved in vascular smooth muscle cell proliferation. Cardiovasc. Res. 45, 493–502 [DOI] [PubMed] [Google Scholar]
- 69. Moiseeva E. P., Williams B., Goodall A. H., Samani N. J. (2003) Galectin-1 interacts with beta-1 subunit of integrin. Biochem. Biophys. Res. Commun. 310, 1010–1016 [DOI] [PubMed] [Google Scholar]
- 70. Zhao X. Y., Chen T. T., Xia L., Guo M., Xu Y., Yue F., Jiang Y., Chen G. Q., Zhao K. W. (2010) Hypoxia inducible factor-1 mediates expression of galectin-1: the potential role in migration/invasion of colorectal cancer cells. Carcinogenesis 31, 1367–1375 [DOI] [PubMed] [Google Scholar]
- 71. Meek S. E., Lane W. S., Piwnica-Worms H. (2004) Comprehensive proteomic analysis of interphase and mitotic 14–3-3-binding proteins. J. Biol. Chem. 279, 32046–32054 [DOI] [PubMed] [Google Scholar]
- 72. Ammirante M., Rosati A., Gentilella A., Festa M., Petrella A., Marzullo L., Pascale M., Belisario M. A., Leone A., Turco M. C. (2008) The activity of hsp90 alpha promoter is regulated by NF-kappa B transcription factors. Oncogene 27, 1175–1178 [DOI] [PubMed] [Google Scholar]
- 73. Shang L., Tomasi T. B. (2006) The heat shock protein 90-CDC37 chaperone complex is required for signaling by types I and II interferons. J. Biol. Chem. 281, 1876–1884 [DOI] [PubMed] [Google Scholar]
- 74. Averna M., Stifanese R., De Tullio R., Passalacqua M., Salamino F., Pontremoli S., Melloni E. (2008) Functional role of HSP90 complexes with endothelial nitric-oxide synthase (eNOS) and calpain on nitric oxide generation in endothelial cells. J. Biol. Chem. 283, 29069–29076 [DOI] [PMC free article] [PubMed] [Google Scholar]
- 75. Bueler H. (2009) Impaired mitochondrial dynamics and function in the pathogenesis of Parkinson's disease. Exp. Neurol. 218, 235–246 [DOI] [PubMed] [Google Scholar]
- 76. Knobbe C. B., Revett T. J., Bai Y., Chow V., Jeon A. H., Bohm C., Ehsani S., Kislinger T., Mount H. T., Mak T. W., St George-Hyslop P., Schmitt-Ulms G. (2011) Choice of biological source material supersedes oxidative stress in its influence on DJ-1 in vivo interactions with Hsp90. J. Proteome Res. 10, 4388–4404 [DOI] [PMC free article] [PubMed] [Google Scholar]
- 77. Koide-Yoshida S., Niki T., Ueda M., Himeno S., Taira T., Iguchi-Ariga S. M., Ando Y., Ariga H. (2007) DJ-1 degrades transthyretin and an inactive form of DJ-1 is secreted in familial amyloidotic polyneuropathy. Int. J. Mol. Med. 19, 885–893 [PubMed] [Google Scholar]
- 78. Kubis H. P., Hanke N., Scheibe R. J., Gros G. (2005) Accumulation and nuclear import of HIF1 alpha during high and low oxygen concentration in skeletal muscle cells in primary culture. Biochim. Biophys. Acta. 1745, 187–195 [DOI] [PubMed] [Google Scholar]
- 79. Del Duca D., Wong G., Trieu P., Rodaros D., Kouremenos A., Tadevosyan A., Vaniotis G., Villeneuve L. R., Tchervenkov C. I., Nattel S., Allen B. G., Hebert T. E., Rohlicek C. V. (2009) Association of neonatal hypoxia with lasting changes in left ventricular gene expression: an animal model. J. Thorac. Cardiovasc. Surg. 138, 538–546, 546, e531 [DOI] [PubMed] [Google Scholar]
- 80. Somanath P. R., Byzova T. V. (2009) 14–3-3beta-Rac1-p21 activated kinase signaling regulates Akt1-mediated cytoskeletal organization, lamellipodia formation and fibronectin matrix assembly. J. Cell. Physiol. 218, 394–404 [DOI] [PMC free article] [PubMed] [Google Scholar]
- 81. Koga Y., Ikebe M. (2008) A novel regulatory mechanism of myosin light chain phosphorylation via binding of 14–3-3 to myosin phosphatase. Mol. Biol. Cell. 19, 1062–1071 [DOI] [PMC free article] [PubMed] [Google Scholar]
- 82. Shen J., Yang M., Ju D., Jiang H., Zheng J. P., Xu Z., Li L. (2010) Disruption of SM22 promotes inflammation after artery injury via nuclear factor kappaB activation. Circ. Res. 106, 1351–1362 [DOI] [PMC free article] [PubMed] [Google Scholar]
- 83. Zhang R., Zhou L., Li Q., Liu J., Yao W., Wan H. (2009) Up-regulation of two actin-associated proteins prompts pulmonary artery smooth muscle cell migration under hypoxia. Am. J. Respir. Cell. Mol. Biol. 41, 467–475 [DOI] [PubMed] [Google Scholar]
- 84. Li D., Mukai K., Suzuki T., Suzuki R., Yamashita S., Mitani F., Suematsu M. (2007) Adrenocortical zonation factor 1 is a novel matricellular protein promoting integrin-mediated adhesion of adrenocortical and vascular smooth muscle cells. FEBS J. 274, 2506–2522 [DOI] [PubMed] [Google Scholar]
- 85. Pichon S., Bryckaert M., Berrou E. (2004) Control of actin dynamics by p38 MAP kinase - Hsp27 distribution in the lamellipodium of smooth muscle cells. J. Cell. Sci. 117, 2569–2577 [DOI] [PubMed] [Google Scholar]
- 86. Liu T., Guevara O. E., Warburton R. R., Hill N. S., Gaestel M., Kayyali U. S. (2009) Modulation of HSP27 alters hypoxia-induced endothelial permeability and related signaling pathways. J. Cell. Physiol. 220, 600–610 [DOI] [PMC free article] [PubMed] [Google Scholar]
- 87. Mittal A., Middleditch M., Ruggiero K., Loveday B., Delahunt B., Jullig M., Cooper G. J., Windsor J. A., Phillips A. R. (2010) Changes in the mesenteric lymph proteome induced by hemorrhagic shock. Shock 34, 140–149 [DOI] [PubMed] [Google Scholar]
- 88. Yano M., Nakamuta S., Wu X., Okumura Y., Kido H. (2006) A novel function of 14–3-3 protein: 14–3-3zeta is a heat-shock-related molecular chaperone that dissolves thermal-aggregated proteins. Mol. Biol. Cell. 17, 4769–4779 [DOI] [PMC free article] [PubMed] [Google Scholar]
- 89. Sattar N. (2012) Biomarkers for diabetes prediction, pathogenesis or pharmacotherapy guidance? Past, present and future possibilities. Diabet. Med. 29, 5–13 [DOI] [PubMed] [Google Scholar]
- 90. He Y., Hua Y., Lee J. Y., Liu W., Keep R. F., Wang M. M., Xi G. (2010) Brain alpha- and beta-globin expression after intracerebral hemorrhage. Transl. Stroke Res. 1, 48–56 [DOI] [PMC free article] [PubMed] [Google Scholar]
- 91. Shanahan C. M., Cary N. R., Osbourn J. K., Weissberg P. L. (1997) Identification of osteoglycin as a component of the vascular matrix. Differential expression by vascular smooth muscle cells during neointima formation and in atherosclerotic plaques. Arterioscler. Thromb. Vasc. Biol. 17, 2437–2447 [DOI] [PubMed] [Google Scholar]
Associated Data
This section collects any data citations, data availability statements, or supplementary materials included in this article.