

Abstract
The proteomics field has shifted over recent years from two-dimensional gel electrophoresis (2-DE)-based approaches to SDS-PAGE or gel-free workflows because of the tremendous developments in isotopic labeling techniques, nano-liquid chromatography, and high-resolution mass spectrometry. However, 2-DE still offers the highest resolution in protein separation. Therefore, we combined stable isotope labeling with amino acids in cell culture of controls and apoptotic HeLa cells with 2-DE and the subsequent analysis of tryptic peptides via nano-liquid chromatography coupled to an LTQ-Orbitrap mass spectrometer to obtain quantitative data using the methods with the highest resolving power on all levels of the proteomics workflow. More than 1,200 proteins with more than 2,700 protein species were identified and quantified from 816 Coomassie Brilliant Blue G-250 stained 2-DE spots. About half of the proteins were identified and quantified only in single 2-DE spots. The majority of spots revealed one to five proteins; however, in one 2-DE spot, up to 23 proteins were identified. Only half of the 2-DE spots represented a dominant protein with more than 90% of the whole protein amount. Consequently, quantification based on staining intensities in 2-DE gels would in approximately half of the spots be imprecise, and minor components could not be quantified. These problems are circumvented by quantification using stable isotope labeling with amino acids in cell culture. Despite challenges, as shown in detail for lamin A/C and vimentin, the quantitative changes of protein species can be detected. The combination of 2-DE with high-resolution nano-liquid chromatography-mass spectrometry allowed us to identify proteomic changes in apoptotic cells that would be unobservable using any of the other previously employed proteomic workflows.
The large-scale analysis of proteins was made possible by high-resolution protein and peptide separation technologies such as two-dimensional gel electrophoresis (2-DE)1 (1) and capillary chromatography (2) combined with the development of matrix-assisted laser desorption ionization (MALDI) (3) and electrospray ionization (ESI) (4) mass spectrometry (MS), two soft ionization techniques that enable the analysis of large biomolecules. 2-DE allows the highest resolution of protein separation, with up to 10,000 spots (5). Typically, 2-DE was combined with protein identification via peptide mass fingerprinting using MALDI-MS, often supported by tandem MS (MS/MS) produced with post-source decay (6). In 1996, the term “proteome” was defined as the protein composition of a cell, organism, organelle, tissue, or body fluid at a given time (7). However, the proteome is not the direct complement of the genome because of alternative splice variants, post-translational modifications, isoforms, and other events. Additionally, the proteome has a spatial (8), a temporal (9), and a chemical dimension (10, 11). In order to address the different chemical structures of a protein, the term “protein species” was established (10, 11), and a nomenclature for protein species was proposed (12). The use of MS has now revolutionized the efficient and sensitive detection and quantification of proteins; however, in liquid chromatography (LC)/MS approaches, proteins are typically digested into peptides before MS analysis, which complicates interpretation of the results of protein identification and quantification (13).
Because of considerable improvements in different analytical techniques, such as the development of stable isotopic labeling (14–17) and nanoflow LC and the significant increases in the speed, sensitivity, and accuracy of ESI-MS (18), the proteomics field has shifted away from the top-down separation of proteins via the technically challenging 2-DE. Increasingly, protein separation has been performed using SDS-PAGE via the gel-based LC/MS approach (19) or has been totally obviated using, for example, multidimensional protein identification technology (20). In HeLa cells, more than 8,000 proteins were identified with such an LC/MS approach (8, 21, 22). However, information about the pre-proteolysis isoelectric point (pI) or molecular mass of the identified intact proteins is lost with these bottom-up approaches, and consequently the differentiation of protein species is impossible if SDS-PAGE is used before LC/MS, except for protein species with large Mr differences (>500 Da). An alternative to these bottom-up approaches is top-down analysis, in which the complete protein species are separated by means of LC and undergo MS (23). Recently, an LC-based, top-down, four-dimensional separation system consisting of isoelectric focusing, gel-eluted liquid fraction entrapment electrophoresis, and nano-LC/MS was used to identify 1,043 gene products from human cells that were dispersed into more than 3,000 protein species (24).
In this study, we combined the techniques with the highest resolving power (2-DE and nano-LC/LTQ-Orbitrap MS) with stable isotope labeling with amino acids in cell culture (SILAC) in HeLa cells to find protein changes resulting from apoptosis induced by the inhibition of kinesin Eg5 using S-trityl-l-cysteine (STLC). The results confirm the separation of protein species; however, they also illustrate that more than 50% of the spots investigated contained more than one protein, a fact that needs to be considered when interpreting optical density quantification data from 2-DE gels. This result underlines the necessity of improving the separation power of top-down analysis. The 2-DE-LC-LTQ-Orbitrap-MS approach enabled the detection of protein-species-specific regulation and modification during apoptosis; this is analyzed in more detail for lamin A/C and vimentin. The combination with SILAC has a great advantage in that even if a 2-DE spot contains several protein species, their peptides are separated by the subsequent LC step and can be identified and quantified individually.
MATERIALS AND METHODS
Cell Culture, Induction of Apoptosis, Sample Preparation, and 2-DE
HeLa cells were grown in a monolayer in RPMI 1640 medium (Invitrogen, Oslo, Norway) without arginine and lysine (Invitrogen, Oslo, Norway) and supplemented with 5% fetal calf serum (Invitrogen, Oslo, Norway), 0.2 m dialyzed glutamine, 100 U/ml penicillin, 50 mg/l arginine-12C6, 100 mg/l lysine-12C6 (light) or 50 mg/l arginine-13C6 monohydrochloride, and 100 mg/l lysine-13C6 (heavy) (Sigma-Aldrich, Oslo, Norway) at 37 °C in a 5% CO2 environment. The cells were split four times, and the incorporation of the amino acids was checked via the acidic extraction of peptides from the cells and MALDI-MS analysis (25). Apoptosis was induced by the addition of 5 μm STLC (Sigma-Aldrich) to 2 × 10⁶/ml HeLa cells grown in light-arginine- and light-lysine-containing medium for 16 h at 37°C in 5.0% CO2 (26).
Cell pellets were resuspended in lysis buffer (25 mm Tris-HCl, 50 mm KCl, 3 mm EDTA, 1% Triton X-100, 5 mm β-mercaptoethanol, pH 7.1) supplemented with protease (3 mm benzamidine, 10 μm leupeptin, and 1 mm PMSF) and phosphatase inhibitors (30 mm sodium fluoride, 1 mm sodium orthovanadate, 20 mm sodium pyrophosphate) and homogenized using a pestle pellet. Lysates were centrifuged for 10 min at 16,000 × g and 4 °C before protein concentrations were determined (27). To check the reproducibility of the identification and quantification, the analysis was repeated with 48 spots from another biological replicate.
Proteins were separated by means of a large gel 2-DE technique (gel size: 23 cm × 30 cm) (5, 28). Briefly, isoelectric focusing rod gels were used for the first dimension, with a diameter of 0.9 mm for analytical gels and 1.5 mm for preparative gels. SDS-PAGE gels with 15% w/v acrylamide and 0.2% bisacrylamide were used for the second dimension. The gels were loaded (400 μg of protein for preparative gels and 65 μg of protein for analytical gels) and stained with Coomassie Brilliant Blue G-250 (29).
MS Analysis
Each spot of the Coomassie G-250-stained 2-DE gel was in-gel digested using 0.1 μg of trypsin in 25 μl of 50 mm ammonium bicarbonate, pH 7.8. To analyze the tryptic peptides, we used an LC/MS system consisting of a Dionex Ultimate 3000 nano-LC system (Sunnyvale, CA) connected to a linear quadrupole ion trap Orbitrap (LTQ Orbitrap XL) mass spectrometer (ThermoElectron, Bremen, Germany) equipped with a nanoelectrospray ion source. For LC separation, an Acclaim PepMap 100 column (C18, 3 μm, 100 Å) (Dionex, Sunnyvale, CA) capillary with a 12-cm bed length was used with a flow rate of 300 nl/min. Two solvents, A (0.1% formic acid) and B (aqueous 90% acetonitrile in 0.1% formic acid), were used to elute the tryptic peptides from the nanocolumn. The gradient went from 7% to 40% B in 17 min and from 40% to 50% B in 3 min, with a total run time of 33 min. The mass spectrometer was operated in the data-dependent mode so as to automatically switch between Orbitrap-MS and LTQ-MS/MS acquisition. Survey full scan MS spectra (from m/z 300 to 2,000) were acquired in the Orbitrap with a resolution r = 60,000 at m/z 400 and allowed the sequential isolation of the top six ions, depending on signal intensity, for fragmentation on the linear ion trap using collision-induced dissociation at a target value of 10,000 charges. For accurate mass measurements, the lock mass option was enabled in MS mode, and the polydimethylcyclosiloxane ions generated in the electrospray process from ambient air were used for internal recalibration during the analysis (30). Other instrument parameters were set as described elsewhere (31).
Protein Identification, Quantification, Database Construction, and Bioinformatic Data Analysis
The raw spectrum files were processed and quantitative ratios were determined using MaxQuant version 1.0.13.13 (32). The false discovery rate was fixed at 1%, and peptides were quantified based on precursor ion intensities. Proteins were identified using an in-house version of the protein identification software Mascot, version 2.2 (33). Peak lists were searched against the Swiss-Prot database (20081212, human, 20,411 sequences). The mass accuracy was set at 10 ppm for MS mode and at 0.6 Da for MS/MS mode, and one missed tryptic cleavage site was allowed in the search. In addition to 13C6 isotopes of lysine and arginine, methionine oxidation, acetylation at the protein N terminus, pyroglutamate formation of N-terminal glutamine, and propionamide formation of cysteines were allowed as variable modifications. For automatic error-tolerant searches of uninterpreted MS/MS data (34), the same parameters were used, with the exception that only one missed cleavage site for trypsin, oxidation (met), and N-acetyl (protein) were allowed. The program TopSpot was used to annotate the protein spots. Spots were cut from low pI to high pI starting at high molecular mass. Every 10th spot was successively measured to avoid potential carryover from neighboring spots. Furthermore, proteins were excluded because of potential carryover if the same protein was identified with less than four peptides in the same direction of heavy/light (H/L) ratio as the preceeding analyzed spot identified with more than nine peptides. The raw data, Mascot generic format files, 2-DE images, and experimental information are available in the Proteome Database System for Microbial Research (Max Planck Institute for Infection Biology). Gene Ontology term and pathway analysis was performed using DAVID (35).
The MS data associated with this manuscript may be downloaded from the Proteome Commons Tranche network using the following hashes: BQunGlJDdu35+Z7fh+wKwgltdj7ZQJRw7usU3u3bKbYv1yyo14k3ReldGy+1w+AhKF0pnTBhsflW4369z34/XgaZGHcAAAAAAALe4Q== rBhlLfr7ih/OoV1FGBBFiTFzH+cEXVPuah4KCkfLN4GTsZwuq06ABqYUR2aVemyjpWxEh/k6zzXeUVy7rhNVBMB4oB0AAAAAAAACqQ== (currently encrypted with “HRPHRP”).
Immunoblotting
Protein samples were separated via either SDS-PAGE or 2-DE. For SDS-PAGE, the proteins were transferred onto PVDF membranes (Immobilon P, Millipore, Oslo, Norway) or nitrocellulose transfer membranes (Whatman Protran BA83) using a Mini Trans-Blot cell (Bio-Rad, Munich, Germany). After blocking in TBST (10 mm Tris, 150 mm NaCl, 0.05% Tween 20, pH 7.4) containing 5% nonfat dried milk, membranes were incubated with affinity-purified antibodies, poly (ADP-ribose) polymerase-1, and GAPDH (Cell Signaling, Beverly, MA) overnight at 4 °C. HRP-conjugated anti-mouse or anti-rabbit IgG was used as a secondary antibody. Membranes were developed by SuperSignal West Pico Chemiluminescent (VWR, Oslo, Norway). Using 2-DE, 200 μg HeLa cell extracts with and without apoptosis induction by high-resolution 2-DE (28) were transferred via semidry blotting onto PVDF membranes (Millipore) (36). The 20 cm × 13 cm upper part of the gel was blotted with a cathodal buffer containing 50 mm borate, 10% methanol, and 0.5% SDS and an anodal buffer containing 50 mm borate and 20% methanol. Three antibodies were used to stain the protein species pattern on the blots: lamin A/C antibody, lamin A/C (phospho-Ser22) antibody (both from Cell Signaling Technology, Danvers, MA), and lamin A/B (phospho-Ser392) antibody (Assay Biotechnology Company, Sunnyvale, CA). Anti-rabbit antibody (Na934–1ML, Amersham Biosciences, Buckinghamshire, UK) was used as the second antibody. Blocking, antibody incubation, washing, and secondary antibody incubation were performed as described in the manufacturer's manual, except that for the first antibodies 1:5,000 dilutions were used, and for the second antibodies 1:10,000 dilutions were used. After the first antibody incubation, the membranes underwent 10 10-min washings for lamin A/C (phospho-Ser22) antibody and six 10-min washings for the other two antibodies. The Western Lightning Plus kit (Perkin Elmer, Waltham, MA) was used for chemiluminescence detection.
RESULTS
High-resolution Proteome Analysis
To obtain the optimal performance for quantitative proteome analysis, we combined 2-DE with LC-ESI-MS using an LTQ-Orbitrap for peptide mass determination (Fig. 1). First, proteins from HeLa cells were metabolically labeled at arginines and lysines using SILAC, and the cell lysates, both nontreated (heavy labeled) and incubated for 48 h with the kinesin Eg5 inhibitor STLC (light labeled), were combined before separation via large gel 2-DE (23 cm × 30 cm). Cleavage of the caspase substrate poly (ADP-ribose) polymerase-1, a hallmark of apoptosis, was detected at 48 h via immunoblotting (26). The 2-DE gel was stained with Coomassie Blue G-250, and 816 visible spots were excised and digested with trypsin. The tryptic peptides of each 2-DE spot were separated using 20-min reversed-phase nano-LC gradients and analyzed online using an LTQ-Orbitrap XL mass spectrometer. Finally, protein identification and relative quantification were performed using Mascot and MaxQuant.
Fig. 1.

The SILAC/2-DE/nano-LC-MS workflow.
In total, 1,245 unique proteins were identified in UniProt and quantified using MaxQuant/Mascot (supplemental Table S1). After the exclusion of proteins identified with fewer than three peptides and a minimum Mascot ion score of 20, the analysis of the 816 spots revealed 2,711 quantified protein species (supplemental Table S2) of 860 unique proteins (supplemental Table S3). The analysis of 48 spots of a biological replicate showed high reproducibility of the data (supplemental Fig. S1). All the results of this analysis were made available in the proteome 2D-PAGE database system of the Max Planck Institute for Infection Biology.
The distribution of the number of identified proteins per spot is shown in Fig. 2A. The majority of spots (665) revealed one to five proteins, but in one 2-DE spot up to 23 proteins were identified in (Fig. 2A). In addition, we determined in how many 2-DE spots a single protein was identified (Fig. 2B). Actually, only about half of the proteins (431) were identified in one 2-DE spot each, and 174 proteins were identified in only two 2-DE spots each. However, we found 16 proteins in 20 or more 2-DE spots that were identified a total of 495 times. To estimate whether a protein could be quantified using spot intensities, we calculated the percentage of exponentially modified protein abundance index (emPAI) values of the identified proteins within a 2-DE spot. The emPAI gives an estimation of the absolute protein amount based on the number of peptides identified for a particular protein (37). In more than 30% of all the 2-DE spots (Fig. 2C), the dominant protein accounted for less than 70% of the total protein intensity. The dominant identified protein accounted for more than 90% of the emPAI value in about 50% of the spots. Consequently, if staining intensities had been used for quantification, only the major protein within a 2-DE spot could have been quantified, and close-to-correct fold changes would be available only for approximately half. This result emphasizes the distinct advantages of using isotopic labeling for relative protein quantification using 2-DE gels. Furthermore, the combination of the samples to be compared before protein separation by 2-DE avoids the reproducibility issues that are experienced with other 2-DE-based methods, with the exception of differential gel electrophoresis (38).
Fig. 2.
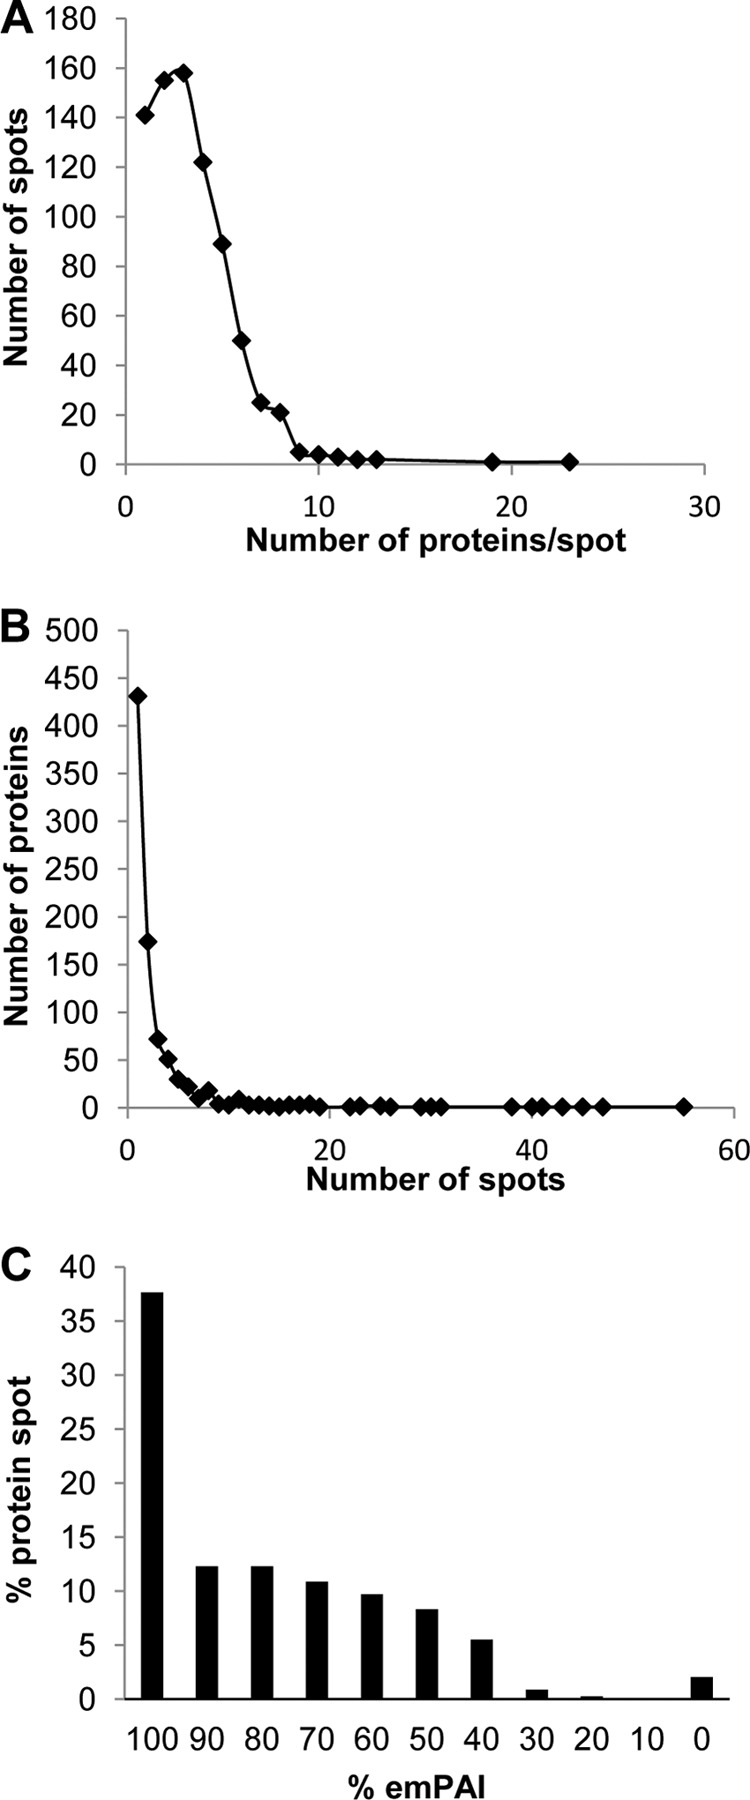
Overview of relation of unique proteins, protein spots, and protein abundance. Diagrams of the distribution of the number of identified proteins per spot (A), the number of spots where a unique protein was identified (B), and the exponentially modified protein abundance index (emPAI) values (%) of the identified proteins within a 2-DE spot are displayed.
The list of unique proteins was compared to the human proteome in UniProt using DAVID (39). Functional annotation clustering measures annotation terms on the basis of the degree of their co-association; highly similar annotations are clustered into functional annotation groups (39). The most significant functional clusters included the Gene Ontology terms “lumen” (enrichment score: 42.35; maximum count: 326; maximum p value: 2.9× 10−53), “mitochondrion” (enrichment score: 41.47; maximum count: 238; maximum p value: 1.9× 10−54), and “RNA-binding/splicing/processing, chaperone” (enrichment score: 31.95; maximum count: 149; maximum p value: 5.9× 10−55). RNA recognition motif (count: 76; p value: 2.1× 10⁻³³), nucleotide-binding alpha-beta plait (count: 75; p value: 3.2× 10⁻³²), NAD(P)-binding domain (count: 45; p value: 1.6× 10⁻¹⁶), proteasome (count: 14; p value: 2.1× 10⁻¹¹), and heat shock protein Hsp70 (count: 11; p value: 1.9× 10⁻¹⁰) were found to be the most significantly enriched protein domains in this dataset. The spliceosome (count: 60; p value: 2.0× 10⁻²⁴), valine/leucine/isoleucine degradation (count: 26; p value: 2.0× 10⁻¹³), the citrate cycle (count: 20; p value: 2.6× 10⁻¹¹), the proteasome (count: 24; p value: 1.1× 10⁻¹⁰), and the ribosome (count: 33; p value: 2.9× 10⁻¹⁰) occurred in KEGG as major pathways.
High-resolution Quantitative Proteome Analysis of STLC-induced Apoptosis
Quantitation was carried out by growing HeLa cells in media containing light (12C6) or heavy isotopes (13C6) of the amino acids arginine and lysine. Total incorporation of the heavy arginine and lysine and the exclusion of an arginine-to-proline conversion were confirmed via the rapid determination of amino acid incorporation as previously described (25). HeLa cells incorporated with the light arginine and lysine isotopes were incubated with STLC for 48 h (Fig. 1). Cells incubated with STLC were harvested at the same time as untreated cells labeled with heavy amino acids and were mixed at a protein ratio of 1:1. Significantly regulated (p < 0.05) proteins with fold changes of >3.796 and <0.188 were found for 434 protein species derived from 27 unique proteins (Table I). Upper and lower standard deviations were calculated separately using the 15.87 and 84.13 percentiles because of a lack of normality in the overall ratio distribution. These deviations were further used for calculating Z-scores and p values for all protein species yielding p < 0.05 for proteins with ratios of >3.796 and <0.188.
Table I. Significantly changed unique proteins due to STLC-induced apoptosis with fold changes in both directions. The largest (high) and the smallest (low) ratios are shown, representing each one protein species. In the ApoptoProteomics database (APdb), more than 50 publications of proteome analyses of apoptosis are summarized. Here, the frequency of each protein reported in APdb is displayed. H/L, heavy/light = control/apoptosis.
| Protein name | UniProt accession | No. protein spots | Ratio H/L high | Ratio H/L low | APdb |
|---|---|---|---|---|---|
| Proteins with fold change > 3.796 and < 0.188 | |||||
| 60S acidic ribosomal protein P0 | P05388 | 4 | 6.84 | 0.01 | 10 |
| 60S acidic ribosomal protein P2 | P05387 | 2 | 5.26 | 0.02 | 1 |
| 78 kDa glucose-regulated protein | P11021 | 16 | 4.19 | 0.05 | 5 |
| DNA replication licensing factor MCM4 | P33991 | 5 | 4.90 | 0.01 | 2 |
| Elongation factor 1-alpha 1 | P68104 | 45 | 3.83 | 0.01 | 3 |
| Elongation factor 1-beta | P24534 | 3 | 4.39 | 0.13 | 6 |
| Elongation factor 1-delta | P29692 | 12 | 5.37 | 0.14 | 3 |
| Eukaryotic translation initiation factor 2 subunit 2 | P20042 | 4 | 17.38 | 0.12 | 0 |
| Eukaryotic translation initiation factor 4B | P23588 | 9 | 9.95 | 0.01 | 2 |
| Heat shock 70 kDa protein 1 | P08107 | 13 | 4.78 | 0.08 | 5 |
| Heat shock 70 kDa protein 4 | P34932 | 8 | 4.39 | 0.05 | 2 |
| Heat shock cognate 71 kDa protein | P11142 | 32 | 8.41 | 0.01 | 5 |
| Heat shock protein beta-1 | P04792 | 14 | 11.91 | 0.01 | 7 |
| Heat shock protein HSP 90-beta | P08238 | 17 | 4.40 | 0.13 | 4 |
| Heterogeneous nuclear ribonucleoprotein D0 | Q14103 | 11 | 4.12 | 0.03 | 6 |
| Heterogeneous nuclear ribonucleoprotein K | P61978 | 15 | 6.23 | 0.01 | 17 |
| Heterogeneous nuclear ribonucleoproteins A2/B1 | P22626 | 42 | 16.34 | 0.02 | 12 |
| Heterogeneous nuclear ribonucleoproteins C1/C2 | P07910 | 18 | 13.73 | 0.03 | 12 |
| Hsc70-interacting protein | P50502 | 9 | 7.86 | 0.03 | 2 |
| KH domain-containing, RNA-binding, signal transduction-associated protein 1 | Q07666 | 4 | 7.16 | 0.06 | 4 |
| Lamin-A/C | P02545 | 28 | 10.43 | 0.05 | 8 |
| Lupus La protein | P05455 | 5 | 5.59 | 0.16 | 0 |
| Myosin-9 | P35579 | 4 | 6.20 | 0.06 | 14 |
| Nucleolin | P19338 | 26 | 19.74 | 0.01 | 8 |
| Pyruvate kinase isozymes M1/M2 | P14618 | 46 | 7.20 | 0.13 | 5 |
| Transketolase | P29401 | 9 | 4.41 | 0.05 | 1 |
| Vimentin | P08670 | 30 | 4.06 | 0.10 | 17 |
In addition, 78 proteins occurring in only one spot as one protein species were found with a fold change of either >3.796 or <0.188. Sixty-seven of these 105 proteins had already been identified through proteomics approaches according to the ApoptoProteomics database (40) (supplemental Table S4). Gene Ontology term analysis (using DAVID) of the 105 proteins that changed in abundance in response to STLC-induced apoptosis with human as background revealed RNA splicing (mainly splicing factors and heterogeneous nuclear ribonucleoprotein), translation (mainly eukaryotic translation elongation factors and ribosomal proteins), and protein folding (mainly heat shock proteins and protein disulfide isomerases) with significant p values; however, when the 860 highly significant identified and quantified proteins were used as background, no significantly enriched biological process was found.
Identification and Quantification of Lamin A/C Species
As described above, 16 proteins were found in more than 20 spots. As an example of such a complex distribution of a single protein, the 2-DE spots in which lamin A/C was identified and quantified are shown in Fig. 3. In total, lamin A/C was detected in 28 spots, which could be classified according to their H/L ratios into five classes—<0.188, 0.189–0.5, 0.5–2, 2–3.795, and >3.796—because of STLC-induced apoptosis (Fig. 3A). Alternative splice variants, proteolysis by caspases, and post-translational modifications are putative reasons for the observed distribution of a unique protein in several spots. These events were specifically analyzed using the MS/MS data of the 28 spots containing lamin A/C.
Fig. 3.

2-DE spot pattern of lamin A/C. A, protein spots in which lamin A/C was identified and quantified are indicated by spot numbers. B, the identified peptides within each spot covering the sequence of lamin A are presented in yellow, and if both the 12C6 (light, apoptosis) and the 13C6 (heavy, control) forms of arginine and lysine were identified, they are shown in green. Spot numbers in which lamin A/C was quantified are shown with a fold change H/L of <0.188 in bold red, 0.188–0.5 in red, 0.5–2 in black, 2–3.795 in blue, and >3.796 in bold blue. Putative caspase cleavage sites are shown at the bottom. C, immunoblots of control and STLC-treated HeLa cells using antibodies against lamin A/C, lamin A/C (pSer392), and lamin A/C (pSer22).
Two spot series were visible at high molecular weight. The molecular weight of the two series corresponded to isoform A (72 kDa) and isoform C (64 kDa) of lamin A/C. Strikingly, decreasing fold changes were observed with increasing pI from acidic to basic independent of the isoform (Fig. 3A), indicating that apoptosis induces a basic modification of the lamins.
The protein sequences of lamins A and C deviate in the sequence stretch 567–572 (lamin A, GSHCSS; lamin C, VSGSRR), and the C-terminal sequence 573–646 is missing in lamin C. To differentiate these two isoforms, an MS/MS spectrum of tryptic peptides 546–582, 598–624, and 628–644 of lamin A and 546–572 of lamin C must be identified. Indeed, all 10 spots of the 2-DE spot series around 72 kDa contained the peptide 628SVGGSGGGSFGDNLVTR644 with Mascot ion scores of 49 to 131, and in three of them the peptide 598ASASGSGAQVGGPISSGSSASSVTVTR624, with Mascot ion scores of 35 to 67, was identified. These peptides were lacking in the other spot series at 65 kDa.
Lamin A/C was identified several times at a lower molecular mass than the two full-length protein splice forms. Cleavage of lamin A/C by caspases would have been highlighted by low H/L values because the apoptotic cells were labeled with light arginine and lysine. Caspase cleavage sites can be predicted using the GraBCas program (41). Regarding effector caspase-3, -6, and -7, high scores were achieved with caspase-6 (VEID230, 64.8; EEVD446, 23.5; EELD205, 12.4). In addition, one of these caspase cleavage sites of lamin A/C was reported within the sequence VEID230 according to the caspase substrate database CASBAH (42). Caspase cleavage at the predicted sites would produce two fragments with the same N-terminal fragment for lamin A and lamin C, but with different molecular weights for the C-terminal fragments of both alternative splice variants (Fig. 3B).
In the following, we consider the spots (nos. 35, 101, 275, 564, and 568; Fig. 3) with H/L ratios > 2 that do not belong to either of the two spot series described above.
Spot 35 (Fig. 3) was identified with two peptides, 281–296 and 528–541, pointing to a C-terminal fragment after cleavage at either EELD205 or VEID230. Spot 101 (Fig. 3) was identified with four peptides starting with amino acid 241, thus also pointing to the C-terminal fragment after cleavage at EELD205 or VEID230. Notably, the peptide 628SVGGSGGGSFGDNLVTR644 was identified here, which confirmed the lamin A splice variant. Spot 275 covered the sequence stretch from amino acid 29 through 216, close to VEID230.The covered sequence stretch of spot 564, of amino acids 29 through 450, excludes cleavage at the three predicted caspase cleavage sites. Spot 568 contained two peptides of lamin A/C close to the N terminus, but the molecular mass of the spot (around 40 kDa) excluded any of the three predicted caspase cleavage sites.
In addition, we tried to find specific MS/MS spectra identifying the caspase cleavage sites. To that end, we performed a follow-up search of the MS/MS spectra with a Mascot ion score of more than 20 using semi-tryptic specificity. However, no MS/MS spectrum was found localizing the cleavage sites.
The biochemical reasons for the horizontal spot trains are of obvious interest, particularly as SILAC labeling has confirmed their biological relevance. Phosphorylation at serines and threonines, acetylation of lysines, C-terminal protein S-farnesylation, and C-terminal protein methylation are reported in the UniProt entry P02545 for lamin A/C. Therefore, we searched the MS data in which lamin A/C was identified using Mascot, considering these post-translational modifications. However, none of them could be confirmed. Next, the MS datasets were searched in Swiss-Prot against human sequences using the automatic error-tolerant search function in Mascot. For this purpose, proteins identified with scores above the homology threshold were selected for an error-tolerant second pass search to order unmatched MS/MS spectra to these proteins. However, no MS/MS spectrum was found that identified a non-artificial post-translational modification. Because the MS data could not explain the spot series, we performed Western blots of small 2-DE gels using antibodies against unmodified lamin A/C, phosphorylated lamin at serine-22, and phosphorylated serine-392. For both unmodified lamin A/C and lamin A/C pSer392, similar, slight shifts to basic pI were observed, comparing controls to samples exposed to STLC (Fig. 3C). However, the spots of the control for lamin A/C pSer22 were found to be more acidic, the number of spots was significantly reduced by about half, and only the basic spots were observed for the STLC condition (Fig. 3C). Consequently, dephosphorylation of lamin A/C at serine-22 is one of the reasons for the changes within the lamin A and lamin C spot series during STLC-induced apoptosis.
Identification and Quantification of Vimentin Species
Another example of one protein identified in many spots is vimentin (Fig. 4). This protein was identified 18 times with an H/L ratio of 0.5 to 2, three times with H/L = 2 to 3.795, twice with H/L > 3.786, five times with H/L = 0.189 to 0.5, and once with H/L < 0.188 (Fig. 4). Eleven of the spots were located in the acidic region at around 60 kDa, and three of these spots with a slightly lower molecular mass were down-regulated (Fig. 4A; spots 338, 339, and 340) in response to STLC-induced apoptosis. In addition, the amount of vimentin was increased in five spots (Fig. 4A; spots 24, 112, 164, 715, and 721) following apoptosis induction. Considering the molecular masses, vimentin migrating within these 2-DE spots was probably cleaved by caspases. Alternative splice variants of vimentin are not described in UniProt.
Fig. 4.

2-DE spot pattern of vimentin. A, protein spots in which vimentin could be identified and quantified are indicated by spot numbers. B, the identified peptides within each spot covering the sequence of vimentin are presented in yellow, and if both the 12C6 (light, apoptosis) and the 13C6 (heavy, control) forms of arginine and lysine were identified, they are shown in green. Spot numbers in which vimentin was quantified are shown with a fold change H/L of <0.188 in bold red, 0.188–0.5 in red, 0.5–2 in black, 2–3.795 in blue, and >3.796 in bold blue. Putative caspase cleavage sites are shown at the bottom.
In CASBAH, three caspase cleavage sites at DSVD85, IDVD259, and TNLD429 are reported. GraBCas predicts DSVD85 with high scores of 30.6 and 22.1 for cleavage by caspase-3 and -7, respectively, and IDVD259 with a score of 10.6 for caspase-6, whereas TNLD does not have a significant GraBCas score value. Caspase cleavage would produce two fragments for vimentin with different molecular weights and pIs at the different predicted cleavage sites (DSVD85: 8.9 kDa/pI 11.7 for the N-terminal fragment and 44.7 kDa/pI 4.7 for the C-terminal fragment; IDVD259: 29.6 kDa/pI 5.3 for the N-terminal fragment and 24.0 kDa/pI 4.9 for the C-terminal fragment; TNLD429: 49.3/5.0 for the N-terminal fragment and 4.2 kDa/pI 5.3 for the C-terminal fragment).
For spot 24, the covered sequence stretch of amino acids 105–466 and the molecular weight of the protein spots pointed to a C-terminal fragment, possibly produced by cleavage at DSVD85. For spot 112, the covered sequence stretch of amino acids 51–341 and the molecular weight of the protein spot pointed to an N-terminal fragment because of cleavage at TNLD429. For spot 164, the covered sequence stretch of amino acids 95–264 indicated possible caspase cleavage at DSVD85 and TNLD429. For spot 715, because of cleavage at IDVD259, the C-terminal fragment is most likely, considering the sequence coverage, molecular weight, and pI. The molecular mass of spot 721 cannot be explained with any of the predicted caspase cleavage sites.
In addition, we wanted to find specific MS/MS spectra identifying the caspase cleavage sites. Therefore, we performed a follow-up search of the MS/MS spectra with an ion score of less than 20 using semitryptic specificity. However, no MS/MS spectrum was found localizing the cleavage sites.
Phosphorylation at serines, threonines, and tyrosines and the acetylation of lysines are reported in UniProt entry P08670 for vimentin. Therefore, we included these post-translational modifications as optional modifications in another Mascot search of the 28 vimentin datasets. The phosphorylated peptide 51SLYASSPGGVYATR64 was identified in spots 75 and 77 with respective Mascot ion scores of 65 and 50 at serine-56, 64 and 48 at serine-55, 48 at tyrosine-53 (spot 77 only), 46 at tyrosine-61 (spot 77 only), and 43 and 41 at serine-51 (supplemental Fig. S2 and supplemental Table S5). Actually, all of these phosphorylation sites were reported in the UniProt entry for vimentin. However, the SILAC-based quantitative analysis indicated that phosphorylation of this peptide was not regulated during apoptosis.
Subsequently, the MS datasets were searched in Swiss-Prot against human sequences using the automatic error-tolerant search function for the hit vimentin in Mascot. The peptide 283NLQEAEEWYK292 was found with tryptophan oxidation to kynurenin within spots 77, 78, 116, 339, and with tryptophan dioxidation or formylation in spots 78 and 355. Furthermore, cysteine dioxidation in spot 78 and cysteine trioxidation in spot 77 were found in the peptide 322QVQSLTCEVDALK334 (supplemental Fig. S2 and supplemental Table S5). However, when we looked at the spots where post-translational modifications had been identified, only spot 339 showed a change in relative vimentin concentration in response to STLC-induced apoptosis (Fig. 4).
DISCUSSION
Dye-stained gel quantitative comparisons are often used for proteome analysis. The presented results show that minor components cannot be quantified using this approach. Furthermore, the emPAI calculations revealed that only approximately half of the spots contained one dominant protein, underlining that conclusions based on changes in the spot intensity of the other 50% of spots are likely to be wrong. This provides a strong rationale for the use of stable isotope labeling for quantification, even if 2-DE is used as the upstream protein separation technology.
The combination of SILAC with 2-DE has been used with MALDI-MS for protein identification (43–45). However, usually only the dominant protein can be identified and quantified. Here, we have shown that several proteins can be identified within a single 2-DE spot, despite the already high protein resolution power of the 2-DE gels used. The separation of tryptic peptides via LC and MS analysis with higher resolution and more sensitive detection increased the number of identified and quantified proteins and protein species.
For the combination of 2-DE with LC/MS analysis, a significant investment in MS time has to be considered: analyzing 800 spots with a turnaround time of 33 min per LC/MS run requires a total of 440 h. An improvement that might reduce this time by about 3-fold would be to use monolithic columns for the LC step (46). This time limitation is a problem that could be solved through further research and optimization, in contrast to the principal limitation of bottom-up approaches, which is that the protein species are destroyed before they can be analyzed. The bottom-up approaches result in large numbers of identified peptides (8, 21, 22), peptides with post-translational modifications (47, 48), and proteins (8, 21, 22), but they cannot elucidate the composition of the protein species, because each protein species represents a certain combination of post-translational modifications. This combination provides information about the function of the protein species. For functional investigations, it is necessary to know which protein species is present at what time, in what amount, in which compartment or complex of an organism. Actually, the 2-DE-LC-LTQ-Orbitrap approach offers the opportunity to investigate protein species on a functional level. To achieve this aim, it will be necessary to increase the sequence coverage of proteins in MS analysis, improve post-translational modification recognition, and correlate a certain protein species to a function within the biological system under investigation. In order to separate protein species of complex proteomes, either the separation power of the protein species separation technique has to be improved or the complexity of the sample has to be reduced. Although it is difficult to achieve 100% sequence coverage for protein species after digestion with trypsin, additional endoproteinases or chemical cleavage and other MS/MS fragmentation techniques (e.g. electron transfer dissociation) can increase the sequence coverage (49). An investigation of ESAT-6 protein species (50) remains one of the rare examples of researchers' being able to separate different protein species via the use of prefractionation and a narrow pH gradient in isoelectric focusing. In that study, the authors obtained 100% sequence coverage, found discriminating post-translational modifications, and could connect an N-terminal acetylation to a function, the inhibition of binding to CFP-10, which is necessary for the transfer of both proteins out of the bacterial cell.
This study showed that individual proteins can be detected as many different protein species with varying migrations in the isoelectric focusing or SDS-PAGE dimension of 2-DE. This detailed information about changes in pI is lost when using gel-based LC-MS/MS, and information about the pI and molecular mass is completely lost with multidimensional protein identification technology approaches. For example, the changing ratios of the pI of lamin A and lamin C cannot be detected without 2-DE. Consequently, the number of changes identified and the fold changes of apoptotic cells observed when using SILAC in combination with 2-DE and nano-LC/MS exceed those obtained in all other quantitative proteome studies performed on apoptotic cells (40). Nevertheless, it is challenging to resolve the chemical differences of protein species deriving from 2-DE gels. Proteins can be identified unequivocally with one or two MS/MS fragmentation spectra. Actually, 100% sequence coverage is required for an unambiguous identification of protein species. Although the sequence coverage was often not sufficient to support the observed changes in MS/MS data, we have determined alternative splice variants, putative caspase cleavage sites, and a few post-translational modifications of lamin A/C and vimentin.
Supplementary Material
Footnotes
* This work was supported by MLS@UiO and funding from the National Program for Research in Functional Genomics in Norway (FUGE, Project No. 183418/S10) of the Norwegian Research Council FUGE-Øst to B.T.
 This article contains supplemental material.
1 The abbreviations used are:
- 2-DE
- two-dimensional gel electrophoresis
- emPAI
- exponentially modified protein abundance index
- ESI
- electrospray ionization
- H/L
- heavy-to-light
- LC
- liquid chromatography
- MALDI
- matrix-assisted laser desorption ionization
- MS
- mass spectrometry
- pI
- isoelectric poin
- SILAC
- stable isotope labeling with amino acids in cell culture
- STLC
- S-trityl-l-cysteine.
REFERENCES
- 1. O'Farrell P. H. (1975) High resolution two-dimensional electrophoresis of proteins. J. Biol. Chem. 250, 4007–4021 [PMC free article] [PubMed] [Google Scholar]
- 2. Ishii D., Asai K., Hibi T., Jonokuchi M., Nagaya M. (1977) A study of micro-high-performance liquid chromatography: I. Development of technique for miniaturization of high-performance liquid chromatography. J. Chromatogr. 144, 157–168 [Google Scholar]
- 3. Karas M., Hillenkamp F. (1988) Laser desorption ionization of proteins with molecular masses exceeding 10,000 daltons. Anal. Chem. 60, 2299–2301 [DOI] [PubMed] [Google Scholar]
- 4. Fenn J. B., Mann M., Meng C. K., Wong S. F., Whitehouse C. M. (1989) Electrospray ionization for mass spectrometry of large biomolecules. Science 246, 64–71 [DOI] [PubMed] [Google Scholar]
- 5. Klose J., Kobalz U. (1995) Two-dimensional electrophoresis of proteins: an updated protocol and implications for a functional analysis of the genome. Electrophoresis 16, 1034–1059 [DOI] [PubMed] [Google Scholar]
- 6. Thiede B., Höhenwarter W., Krah A., Mattow J., Schmid M., Schmidt F., Jungblut P. R. (2005) Peptide mass fingerprinting. Methods 35, 237–247 [DOI] [PubMed] [Google Scholar]
- 7. Wilkins M. R., Pasquali C., Appel R. D., Ou K., Golaz O., Sanchez J. C., Yan J. X., Gooley A. A., Hughes G., Humphery-Smith I., Williams K. L., Hochstrasser D. F. (1996) From proteins to proteomes: large scale protein identification by two-dimensional electrophoresis and amino acid analysis. Biotechnology 14, 61–65 [DOI] [PubMed] [Google Scholar]
- 8. Boisvert F. M., Ahmad Y., Gierliński M., Charrière F., Lamont D., Scott M., Barton G., Lamond A. I. (2012) A quantitative spatial proteomics analysis of proteome turnover in human cells. Mol. Cell. Proteomics 11, M111.011429. [DOI] [PMC free article] [PubMed] [Google Scholar]
- 9. Otto A., Bernhardt J., Meyer H., Schaffer M., Herbst F. A., Siebourg J., Mäder U., Lalk M., Hecker M., Becher D. (2010) Systems-wide temporal proteomic profiling in glucose-starved Bacillus subtilis. Nat. Commun. 1, 137. [DOI] [PMC free article] [PubMed] [Google Scholar]
- 10. Jungblut P., Thiede B., Zimny-Arndt U., Müller E. C., Scheler C., Wittmann-Liebold B., Otto A. (1996) Resolution power of two-dimensional electrophoresis and identification of proteins from gels. Electrophoresis 17, 839–847 [DOI] [PubMed] [Google Scholar]
- 11. Jungblut P. R., Holzhütter H. G., Apweiler R., Schluter H. (2008) The speciation of the proteome. Chem. Cent. J. 2, 16. [DOI] [PMC free article] [PubMed] [Google Scholar]
- 12. Schlüter H., Apweiler R., Holzhütter H. G., Jungblut P. R. (2009) Finding one's way in proteomics: a protein species nomenclature. Chem. Cent. J. 3, 11. [DOI] [PMC free article] [PubMed] [Google Scholar]
- 13. Ahmad Y., Boisvert F. M., Lundberg E., Uhlen M., Lamond A. I. (2012) Systematic analysis of protein pools, isoforms, and modifications affecting turnover and subcellular localization. Mol. Cell. Proteomics 11, M111.013680. [DOI] [PMC free article] [PubMed] [Google Scholar]
- 14. Gygi S. P., Rist B., Gerber S. A., Turecek F., Gelb M. H., Aebersold R. (1999) Quantitative analysis of complex protein mixtures using isotope-coded affinity tags. Nat. Biotechnol. 17, 994–999 [DOI] [PubMed] [Google Scholar]
- 15. Oda Y., Huang K., Cross F. R., Cowburn D., Chait B. T. (1999) Accurate quantitation of protein expression and site-specific phosphorylation. Proc. Natl. Acad. Sci. U.S.A. 96, 6591–6596 [DOI] [PMC free article] [PubMed] [Google Scholar]
- 16. Bantscheff M., Schirle M., Sweetman G., Rick J., Kuster B. (2007) Quantitative mass spectrometry in proteomics: a critical review. Anal. Bioanal. Chem. 389, 1017–1031 [DOI] [PubMed] [Google Scholar]
- 17. Treumann A., Thiede B. (2010) Isobaric protein and peptide quantification: perspectives and issues. Expert Rev. Proteomics 7, 647–653 [DOI] [PubMed] [Google Scholar]
- 18. Mann M., Kelleher N. L. (2008) Precision proteomics: the case for high resolution and high mass accuracy. Proc. Natl. Acad. Sci. U.S.A. 105, 18132–18138 [DOI] [PMC free article] [PubMed] [Google Scholar]
- 19. Fang Y., Robinson D. P., Foster L. J. (2010) Quantitative analysis of proteome coverage and recovery rates for upstream fractionation methods in proteomics. J. Proteome Res. 9, 1902–1912 [DOI] [PubMed] [Google Scholar]
- 20. Washburn M. P., Wolters D., Yates J. R., 3rd (2001) Large-scale analysis of the yeast proteome by multidimensional protein identification technology. Nat. Biotechnol. 19, 242–247 [DOI] [PubMed] [Google Scholar]
- 21. Geiger T., Wehner A., Schaab C., Cox J., Mann M. (2012) Comparative proteomic analysis of eleven common cell lines reveals ubiquitous but varying expression of most proteins. Mol. Cell. Proteomics 11, M111.014050. [DOI] [PMC free article] [PubMed] [Google Scholar]
- 22. Nagaraj N., Wisniewski J. R., Geiger T., Cox J., Kircher M., Kelso J., Pääbo S., Mann M. (2011) Deep proteome and transcriptome mapping of a human cancer cell line. Mol. Syst. Biol. 7, 548. [DOI] [PMC free article] [PubMed] [Google Scholar]
- 23. Roth M. J., Forbes A. J., Boyne M. T., 2nd, Kim Y. B., Robinson D. E., Kelleher N. L. (2005) Precise and parallel characterization of coding polymorphisms, alternative splicing, and modifications in human proteins by mass spectrometry. Mol. Cell. Proteomics 4, 1002–1008 [DOI] [PMC free article] [PubMed] [Google Scholar]
- 24. Tran J. C., Zamdborg L., Ahlf D. R., Lee J. E., Catherman A. D., Durbin K. R., Tipton J. D., Vellaichamy A., Kellie J. F., Li M., Wu C., Sweet S. M., Early B. P., Siuti N., LeDuc R. D., Compton P. D., Thomas P. M., Kelleher N. L. (2011) Mapping intact protein isoforms in discovery mode using top-down proteomics. Nature 480, 254–258 [DOI] [PMC free article] [PubMed] [Google Scholar]
- 25. Schmidt F., Strozynski M., Salus S. S., Nilsen H., Thiede B. (2007) Rapid determination of amino acid incorporation by stable isotope labeling with amino acids in cell culture (SILAC). Rapid Commun. Mass Spectrom. 21, 3919–3926 [DOI] [PubMed] [Google Scholar]
- 26. Kozielski F., Skoufias D. A., Indorato R. L., Saoudi Y., Jungblut P. R., Hustoft H. K., Strozynski M., Thiede B. (2008) Proteome analysis of apoptosis signaling by S-trityl-L-cysteine, a potent reversible inhibitor of human mitotic kinesin Eg5. Proteomics 8, 289–300 [DOI] [PubMed] [Google Scholar]
- 27. Peterson G. L. (1977) A simplification of the protein assay method of Lowry et al. which is more generally applicable. Anal. Biochem. 83, 346–356 [DOI] [PubMed] [Google Scholar]
- 28. Zimny-Arndt U., Schmid M., Ackermann R., Jungblut P. R. (2009) Classical proteomics: two-dimensional electrophoresis/MALDI mass spectrometry. Methods Mol. Biol. 492, 65–91 [DOI] [PubMed] [Google Scholar]
- 29. Doherty N. S., Littman B. H., Reilly K., Swindell A. C., Buss J. M., Anderson N. L. (1998) Analysis of changes in acute-phase plasma proteins in an acute inflammatory response and in rheumatoid arthritis using two-dimensional gel electrophoresis. Electrophoresis 19, 355–363 [DOI] [PubMed] [Google Scholar]
- 30. Olsen J. V., de Godoy L. M., Li G., Macek B., Mortensen P., Pesch R., Makarov A., Lange O., Horning S., Mann M. (2005) Parts per million mass accuracy on an Orbitrap mass spectrometer via lock mass injection into a C-trap. Mol. Cell. Proteomics 4, 2010–2021 [DOI] [PubMed] [Google Scholar]
- 31. Koehler C. J., Strozynski M., Kozielski F., Treumann A., Thiede B. (2009) Isobaric peptide termini labeling for MS/MS-based quantitative proteomics. J. Proteome Res. 8, 4333–4341 [DOI] [PubMed] [Google Scholar]
- 32. Cox J., Mann M. (2008) MaxQuant enables high peptide identification rates, individualized p.p.b.-range mass accuracies and proteome-wide protein quantification. Nat. Biotechnol. 26, 1367–1372 [DOI] [PubMed] [Google Scholar]
- 33. Perkins D. N., Pappin D. J., Creasy D. M., Cottrell J. S. (1999) Probability-based protein identification by searching sequence databases using mass spectrometry data. Electrophoresis 20, 3551–3567 [DOI] [PubMed] [Google Scholar]
- 34. Creasy D. M., Cottrell J. S. (2002) Error tolerant searching of uninterpreted tandem mass spectrometry data. Proteomics 2, 1426–1434 [DOI] [PubMed] [Google Scholar]
- 35. Huang da W., Sherman B. T., Tan Q., Collins J. R., Alvord W. G., Roayaei J., Stephens R., Baseler M. W., Lane H. C., Lempicki R. A. (2007) The DAVID Gene Functional Classification Tool: a novel biological module-centric algorithm to functionally analyze large gene lists. Genome Biol. 8, R183. [DOI] [PMC free article] [PubMed] [Google Scholar]
- 36. Jungblut P., Eckerskorn C., Lottspeich F., Klose J. (1990) Blotting efficiency investigated by using two-dimensional electrophoresis, hydrophobic membranes and proteins from different sources. Electrophoresis 11, 581–588 [DOI] [PubMed] [Google Scholar]
- 37. Ishihama Y., Oda Y., Tabata T., Sato T., Nagasu T., Rappsilber J., Mann M. (2005) Exponentially modified protein abundance index (emPAI) for estimation of absolute protein amount in proteomics by the number of sequenced peptides per protein. Mol. Cell. Proteomics 4, 1265–1272 [DOI] [PubMed] [Google Scholar]
- 38. Unlü M., Morgan M. E., Minden J. S. (1997) Difference gel electrophoresis: a single gel method for detecting changes in protein extracts. Electrophoresis 18, 2071–2077 [DOI] [PubMed] [Google Scholar]
- 39. Huang da W., Sherman B. T., Lempicki R. A. (2009) Systematic and integrative analysis of large gene lists using DAVID bioinformatics resources. Nat. Protoc. 4, 44–57 [DOI] [PubMed] [Google Scholar]
- 40. Arntzen M. Ø., Thiede B. (2012) ApoptoProteomics, an integrated database for analysis of proteomics data obtained from apoptotic cells. Mol. Cell. Proteomics 11, M111.010447. [DOI] [PMC free article] [PubMed] [Google Scholar]
- 41. Backes C., Kuentzer J., Lenhof H. P., Comtesse N., Meese E. (2005) GraBCas: a bioinformatics tool for score-based prediction of caspase- and granzyme B-cleavage sites in protein sequences. Nucleic Acids Res. 33, W208–W213 [DOI] [PMC free article] [PubMed] [Google Scholar]
- 42. Lüthi A. U., Martin S. J. (2007) The CASBAH: a searchable database of caspase substrates. Cell Death Differ. 14, 641–650 [DOI] [PubMed] [Google Scholar]
- 43. Holland C., Schmid M., Zimny-Arndt U., Rohloff J., Stein R., Jungblut P. R., Meyer T. F. (2011) Quantitative phosphoproteomics reveals link between Helicobacter pylori infection and RNA splicing modulation in host cells. Proteomics 11, 2798–2811 [DOI] [PubMed] [Google Scholar]
- 44. Schmidt F., Dahlmann B., Hustoft H. K., Koehler C. J., Strozynski M., Kloss A., Zimny-Arndt U., Jungblut P. R., Thiede B. (2011) Quantitative proteome analysis of the 20S proteasome of apoptotic Jurkat T cells. Amino Acids 41, 351–361 [DOI] [PubMed] [Google Scholar]
- 45. Thiede B., Kretschmer A., Rudel T. (2006) Quantitative proteome analysis of CD95 (Fas/Apo-1)-induced apoptosis by stable isotope labeling with amino acids in cell culture, 2-DE and MALDI-MS. Proteomics 6, 614–622 [DOI] [PubMed] [Google Scholar]
- 46. Josic D., Clifton J. G. (2007) Use of monolithic supports in proteomics technology. J. Chromatogr. A 1144, 2–13 [DOI] [PubMed] [Google Scholar]
- 47. Hilger M., Bonaldi T., Gnad F., Mann M. (2009) Systems-wide analysis of a phosphatase knock-down by quantitative proteomics and phosphoproteomics. Mol. Cell. Proteomics 8, 1908–1920 [DOI] [PMC free article] [PubMed] [Google Scholar]
- 48. Wagner S. A., Beli P., Weinert B. T., Nielsen M. L., Cox J., Mann M., Choudhary C. (2011) A proteome-wide, quantitative survey of in vivo ubiquitylation sites reveals widespread regulatory roles. Mol. Cell. Proteomics 10, M111.013284. [DOI] [PMC free article] [PubMed] [Google Scholar]
- 49. Meyer B., Papasotiriou D. G., Karas M. (2011) 100% protein sequence coverage: a modern form of surrealism in proteomics. Amino Acids 41, 291–310 [DOI] [PubMed] [Google Scholar]
- 50. Okkels L. M., Müller E. C., Schmid M., Rosenkrands I., Kaufmann S. H., Andersen P., Jungblut P. R. (2004) CFP10 discriminates between nonacetylated and acetylated ESAT-6 of Mycobacterium tuberculosis by differential interaction. Proteomics 4, 2954–2960 [DOI] [PubMed] [Google Scholar]
Associated Data
This section collects any data citations, data availability statements, or supplementary materials included in this article.