Abstract
Myelin water imaging is a promising, noninvasive technique for evaluating white matter diseases such as multiple sclerosis and other leukoencephalopathies (LE), and monitoring myelination in early childhood. Unfortunately, poor image quality and a long acquisition time are major obstacles to practical clinical applications. In this study, a novel postprocessing method with an efficient multi-slice acquisition scheme, called T2 spectrum analysis using a weighted regularized non-negative least squares algorithm and non-local mean filter (T2SPARC), is presented to overcome these obstacles and achieve a shorter acquisition time, higher image quality, and large volume coverage. In vivo results from healthy volunteers and a patient with LE showed that the T2SPARC method can generate robust and high-quality myelin water fraction (MWF) maps of 10 slices within 11 minutes. This method also yields some useful byproducts such as intra- and extracellular water fraction (IEWF) and long T2 tissue water fraction (LWF) maps, which can quantify lesions in different brain diseases.
Keywords: Myelin water imaging, T2 spectrum analysis, quantitative MRI, myelin water fraction, white matter, leukoencephalopathy
Introduction
White matter disease in the human brain involves damage to the myelin sheaths, which are formed by the vast membranous extensions of glial cells (i.e., oligodendrocytes). The axon is wrapped in many layers of these electrically insulating sheet-like membrane extensions to form the myelin sheath, which ensures the rapid conduction of electrical impulses in the nervous system (1). Some white matter diseases, including leukoencephalopathy (LE) and multiple sclerosis (MS), lead to demyelination and scarring as well as a broad spectrum of signs and symptoms (2,3). The myelin water fraction (MWF) can serve as a direct indicator of myelin sheath integrity and can provide quantitative measurements of myelin structure and component change due to white matter disease (4,5).
The multi-compartment spectrum analysis of the T2 decay curve proposed by MacKay et al. (5) is one commonly used method to quantify MWF. The T2 spectrum of human brain tissue can include four compartments: 1. myelin water, a very short T2 component with a T2 range from 15 to 40 ms at 3.0 T; 2. intra- and extracellular water, a T2 component with a range from 40 to 200 ms; 3. long T2 tissue water, a T2 component with a range from 200 to 800 ms; and 4. cerebral spinal fluid, a long T2 component from 800 to 2000 ms (6,7). In this study, the ratios of the components to the sum of all the components are termed MWF, intra- and extracellular water fraction (IEWF), long T2 tissue water fraction (LWF), and cerebral spinal fluid fraction (CSFF).
In MacKay’s method, T2 decay curves were acquired using a single-slice, multi-echo Carr-Purcell-Meiboom-Gill (CPMG) sequence with nonselective composite (90°x-180°y-90°x) refocusing pulses and large z-axis gradient crushers (5,8,9). A non-negative least squares (NNLS) algorithm was used for spectrum analysis of T2 decay curves (10). The merits of this method include high-quality T2 decay curves with a high signal–to-noise ratio (SNR) and a robust algorithm that does not require initial estimates and a priori assumptions (5). The MWF generated using this method showed a strong correlation with myelin content validated by histopathologic examination (11-14). However, the single-slice coverage and the long acquisition time (e.g., 25 minutes) due to nonselective refocusing pulses and a higher SNR requirement are obstacles to practical clinical applications (5,15).
To achieve larger volume coverage and a shorter acquisition time, several multi-slice and 3D techniques were proposed recently (15-17). One technique was based on T2* signal decay to acquire five slices with an imaging time of 8.7 minutes (15). The further increase in volume coverage was limited by possible gradient overheating (15). High sensitivity to local field inhomogeneity was one of the major limitations of this technique for practical applications, because the local field gradient along the slice direction can introduce non-exponential signal decay (18,19). In another method, 16 slices can be acquired using a T2 prepared spiral imaging sequence with a scan time of 10 minutes (16). However, this method yields noisy MWF maps with low resolution and poor image quality. A 3D technique was also proposed to generate MWF maps in either 16 or 30 minutes using the spoiled gradient-recalled echo sequence and fully balanced steady state free precession sequence (17). This 3D technique was limited to examining two water components (fast and slowly relaxing components) and yielding noisy MWF maps with higher MWF values (27% vs. 11%) than MWF from other reported methods (15,20,21).
Another way to increase volume coverage is to use a conventional multi-slice CPMG sequence with slice-selective refocusing pulses. The conventional multi-echo CPMG sequence for T2 relaxation measurement was dramatically affected by the stimulated echo caused by slice profile imperfections of refocusing RF pulses (22,23). Due to intrinsic sensitivity to refocusing imperfection, the measured curve may deviate from the true T2 decay curve, especially for the first several points (22). However, the first several points are crucial to measuring the MWF, because the T2 of the myelin water component is short, ranging from 15 to 40 ms. Recently, a technique that uses refocusing pulses with a slice thickness three times the size of the excitation pulse was proposed to diminish deviations and optimize T2 measurements (24). We took advantage of this technique in T2 spectrum analysis and modified the Siemens CPMG sequence (se_mc) by increasing the refocusing slice thickness to three times the size of the excitation slice thickness.
In this study, we propose a new method for acquiring optimized T2 decay curves and analyzing the data with a new algorithm. This method is called T2 SPectrum Analysis using a weighted Regularized NNLS algorithm and non-loCal mean filter (T2SPARC). In this method, a modified multi-slice CPMG sequence with a refocusing slice thickness three times the size of the excitation slice thickness was used to optimize T2 decay curves and achieve a balance between the acquisition time and the quality of T2 decay curves. Since the SNR is the key factor affecting the quality of MWF maps, we propose a new algorithm, a weighted, regularized NNLS algorithm with a large regularization coefficient, in combination with a recently developed nonlocal mean (NLM) denoising technique (25) to reduce the effect of noise and lessen the requirements for the quality of T2 decay curves. A reproducibility study was performed to demonstrate the robustness and reliability of the T2SPARC method.
Materials and Methods
Imaging Acquisition
Two healthy volunteers (male, 36 and 37 years old) and one patient with leukemia (male, 19 years old, with acute therapy-induced neurotoxicity (LE)) were imaged in the preliminary study. The acquisition scheme in each examination includes two scans, each of which acquires five slices and has a slice gap twice as large as the excitation slice thickness due to the large refocusing slice thickness. The position of the second scan is shifted along the slice direction relative to the first scan to generate 10 consecutive slices with a small gap. For each examination, 10 brain axial slices from two scans were acquired using the modified sequence on a 3T scanner (Trio, Siemens Medical Solutions, Erlangen, Germany) using a 12-channel head coil. The protocol for the scans was as follows: FOV = 220×220 mm; slice thickness = 5 mm; acquisition matrix, 256×256; 5 slices with a 200% slice gap; 32 echoes and TEs = 10·N ms (N = 1,2,3, …, 32); TR = 3000 ms; receiver bandwidth = 300 Hz/pixel; GRAPPA reduction factor = 2, and the number of reference lines = 24. The acquisition time for each scan was about 5 minutes 29 seconds, and the total time for two scans was 11 minutes. The slice position of the second scan was shifted 7.5 mm along the slice direction relative to the first scan to generate 10 consecutive slices with 2.5 mm gaps. To confirm the previously demonstrated improved T2 decay curves with a larger refocusing slice profile (24), we acquired a single slice from one healthy volunteer using both the conventional (Siemens se_mc sequence) and the modified CPMG sequences.
In addition, a reproducibility study was performed on five healthy volunteers (three males, two females, average age of 31.6 ± 5.8 years). Each volunteer was imaged three times using the same protocols. The subject was asked to get up from the table after each examination, and was then placed back in the magnet after aligning the head within the coil using positioning beams on the magnet. The central acquisition slice was always aligned with the most inferior extent of corpus callosum in a central sagittal view. Informed consent was obtained from all subjects.
Spectrum Analysis
The T2 decay signal, y(tn), can be described using a general integral of exponential functions (10):
| (1) |
where tn is the measured time point equal to n·TE, and TE is time of echo; S(T2) is the amplitude of the spectrum at relaxation time T2. The range of T2 is from zero to the maximum T2 value Tmax (2 seconds in this study). This integral equation can be discretized as a summation of piecewise amplitude constants over M small ranges of T2:
| (2) |
where M is the number of T2 sampling points and
| (3) |
where ΔT2m is a logarithmic T2 time interval in this study. We rewrote Eq. 2 in a general matrix form:
| (4) |
The T2 spectrum can be solved from Eq. 4.
In this study, the T2 spectrum was partitioned into four intervals: myelin water, T2=15–40 ms; intra- and extracellular water, 40–200 ms; tissue water with long T2, 200–800 ms; and cerebral spinal fluid, 800–2000 ms. For each pixel, the ratios of the direct summation of STm within each interval to its overall summation corresponding to MWF, IEWF, LWF, and CSFF were computed to generate parametric maps.
Regularized Non-Negative Least Squares Algorithm
Since spectral amplitudes STm are non-negative, the NNLS algorithm is suitable for T2 spectrum analysis. However, regularization has to be used to improve the reliability of the solution, because this inverse problem is ill-posed. The regularized NNLS (rNNLS) algorithm is used to solve Eq. 4 by minimizing
| (5) |
where ∥·∥2 represents the Euclidean norm and μ is a regularization constant. The larger the value of μ, the more the algorithm smooths the T2 spectrum. A small value of μ is used in a typical MWF study to satisfy the constraint of where is the minimum misfit of the NNLS solution (26). Due to this constraint, the rNNLS algorithm is still very sensitive to noise. Thus, four averages in acquisition have to be used to double the SNR, which prolongs the total acquisition time to more than 25 minutes for a single slice (5,20).
Weighted rNNLS Algorithm
In this study, we propose a new weighted rNNLS (wrNNLS) algorithm to overcome the intrinsic weighting issue of regularization in the rNNLS algorithm caused by using logarithmically spaced T2 time intervals. The regularized term ST in Eq. 5 includes the spectral amplitude S and T2 time interval as shown in Eq. 3. If T2 is uniformly sampled, the regularization is uniformly weighted for all spectral amplitudes; however, if T2 is logarithmically sampled, the regularization puts more weight on spectral amplitudes that correspond to the larger log-spaced time intervals. This logarithmically sampled weighting disparity is further aggravated by larger values for the regularization constant μ. This issue can be ameliorated as follows:
| (6) |
where W is a weighting matrix and its elements are equal to the inverse of log-spaced T2 time intervals. Using Eq. 6, the spectral amplitudes are equally weighted in regularization even with logarithmically spaced T2 time intervals. Due to high sensitivity to noise, there are still several issues, including the optimal μ value, the number of sampling points, and denoising, which need to be resolved to diminish the effects of noise and achieve robust results in spectrum analysis.
Optimal μ Value
Using Eq. 6, different μ values (0 to 3 incremented by 0.01) were used to search for the optimal value to achieve the most robust MWF values for the data from the modified sequence. Two investigations were performed using in vivo data from a healthy volunteer. In the first investigation, various μ values were used to compute average MWF, IEWF, and their sums within a large manually drawn region of interest (ROI) in white matter from the pixel-wise parametric maps. The optimal μ value was determined to ensure accuracy and robustness for MWF and IEWF values. Two criteria were balanced in determining the optimal μ value: 1) close agreement of MWF with formerly reported values, and 2) minimal change of MWF and IEWF values with change in μ. In the second investigation, T2 decay curves from two adjacent pixels in white matter were converted to T2 spectra using the wrNNLS algorithm with several μ values (0, 0.1, 0.3, and 1.8). In this investigation, we assumed that two adjacent pixels should have approximately the same T2 spectra despite the effect of noise. The second investigation was to determine which μ value would generate similar spectra for two adjacent pixels.
Number of T2 Sampling Points
The number of logarithmically spaced T2 sampling points, M, within the range of 15 milliseconds to 2 seconds was generally 80 or 120 to balance computational efficiency and spectral accuracy (7,20). A larger μ value in the wrNNLS algorithm reduces sensitivity to noise but increases the smoothness of the T2 spectrum. The T2 spectral distribution of myelin and intra- and extracellular water components could become a continuous broad peak instead of two discrete spikes. Even with a specified myelin water T2 threshold (e.g., 40 ms), the actual threshold can vary with the number of sampling points M and become important for the robustness of the wrNNLS algorithm, especially when T2 is logarithmically sampled. An investigation was performed to examine relationships of MWF and the actual threshold with the number of T2 sampling points M to find the optimal number of sampling points, which ensures the minimum difference between the actual and the prescribed threshold.
Non-Local Mean Filter
Even though the sensitivity to noise can be dramatically diminished by using wrNNLS with a larger μ value, parametric maps of MWF and IEWF still appear noisy compared to conventional clinical images. An NLM filter can be used to further denoise those parametric maps and improve their SNRs (25). In an NLM filter, noise is substantially reduced by averaging a large number of similar pixels regardless of whether they are spatially close or not. The denoising performance of an NLM filter is the best with the presence of similar image structures in contrast to other classical neighborhood filters such as an anisotropic filter and a Gaussian filter (27). Therefore, an NLM filter is most suitable for denoising parametric maps of MWF and IEWF, because they have large areas with similar pixels. In this study, an NLM filter with a degree of filtering and radiuses of search and similarity window equal to 10, 5, and 2, respectively (25), was used to improve image quality after all MWF, IEWF, LWF, and CSFF values were scaled by multiplying by 1000.
Reproducibility study
For each subject, rigid-body registration was first applied to align the three sets of images. Five ROIs were then drawn on the MWF image in the first examination, which was applied to the other images (MWF, IEWF, LWF and CSFF) in all examinations. The ROIs encompassed 5 areas: 1. forceps minor, 2. forceps major, 3. genu of the corpus callosum, 4. splenium of the corpus callosum, 5. posterior internal capsule. The standard deviation and coefficient of variation (CV) were derived within each ROI among the 5 different subjects (between-subject) and longitudinally within the single subject (within-subject), and they were then averaged together across the ROIs.
In this study, all MWF, IEWF, LWF, and CSFF images were displayed with color maps of hot magenta, gem, hot red, and hot cyan, respectively, using ImageJ. Most MWF values in gray matter were less than 4% (20,26). The MWF value was largest, 22%, in the globus pallidus, in which high iron deposition leads to a short T2 component (19,28). Therefore, the display window for MWF was chosen from 4% to 23%. In addition, display windows for IEWF, LWF, and CSFF were chosen to be 60% to 100%, 0 to 20%, and 0 to 100%, respectively.
Results
For comparison of RF homogeneity within the excitation slice thickness, the refocusing slice profiles with two slice widths (5 mm and 15 mm) were plotted in Fig. 1a. The refocusing slice profile of the conventional CPMG sequence is shown as a blue curve in Fig 1a. The flip angles of a significant portion of slice were less than 180 degrees leading to large deviations in the first several points in the T2 decay curve. The new refocusing slice profile with three times slice thickness was dramatically improved as shown in Fig. 1a. As previously demonstrated, the new refocusing RF pulse led to a substantially ameliorated T2 decay curve, shown in red (Fig. 1b), in comparison to the T2 decay curve from the original se_mc sequence, shown in blue (Fig. 1b).
Fig. 1.
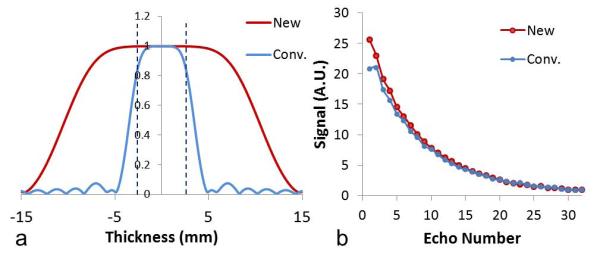
Slice profile of RF180 and its effects on the decay curve. (a) Normalized slice profiles of RF180 in conventional and modified CPMG sequences. The excited slice thickness (5 mm) is marked by the two black dashed lines. (b) T2 signal decay curves in a single pixel of white matter of a healthy volunteer using conventional and modified CPMG sequences. New represents the modified CPMG sequence with the larger refocusing slice thickness; Conv. represents the conventional CPMG sequence with the smaller refocusing slice thickness.
Optimal μ Value
Average MWF, IEWF, and their sums as a function of the regularization coefficient μ are plotted in Fig. 2. The average MWF and IEWF were computed in a large ROI of white matter shown on the inset of Fig. 2b. The average MWF curve dropped a little and increased to a maximum around μ = 1.8, as shown in Fig. 2a. In the plateau region from μ = 1.6 to 2.0, the average MWF was very stable, and the total change within this range was less than 1% relative to the MWF value at μ = 1.6. The average MWF at μ = 1.8 was equal to 12.0%. The average IEWF curve had a trend opposite from that of the averaged MWF curve and reached a minimum value at μ = 1.8. Within the white matter ROI, there were no LWF and CSFF components. The sum of MWF and IEWF should be 100%. The sum of average MWF and IEWF was 99.72% at μ = 1.8, which is very close to the theoretical limit of 100% (Fig. 2b). Therefore, μ = 1.8 is the optimal value to ensure the robustness of MWF.
Fig. 2.
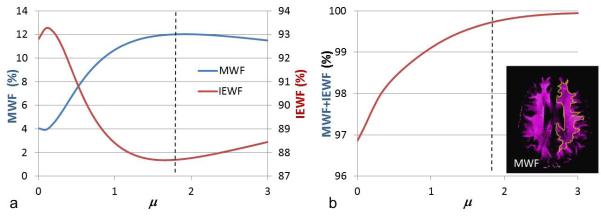
Effect of regularization coefficient μ on MWF and IEWF values in a healthy volunteer. (a) Averaged MWF and IEWF curves calculated in white matter ROI on the inset of the MWF map. (b) Summation of MWF and IEWF changed with μ. The vertical dashed lines are at μ =1.8. MWF represents myelin water fraction; IEWF represents intra- and extracellular water fraction.
In addition, the MWF in two adjacent pixels of white matter was computed using several μ values, as shown in Fig. 3. The positions of two pixels are shown in Fig. 3a, and two signal curves are very similar in Fig. 3b. Since the two adjacent pixels were in white matter with the same components, the two neighboring pixels should have approximately the same T2 spectra despite the effect of noise. In Fig. 3c, the two distinct spectra were generated with μ = 0 due to the ill-posedness of the inverse problem. The main peaks of the two pixels were close, but the small peaks of the two pixels were located on each side of the main peaks, which led to an MWF equal to 0% in one pixel and 9.8% in the other pixel. These substantially different MWF values conflicted with the expected consistency between two adjacent pixels.
Fig. 3.
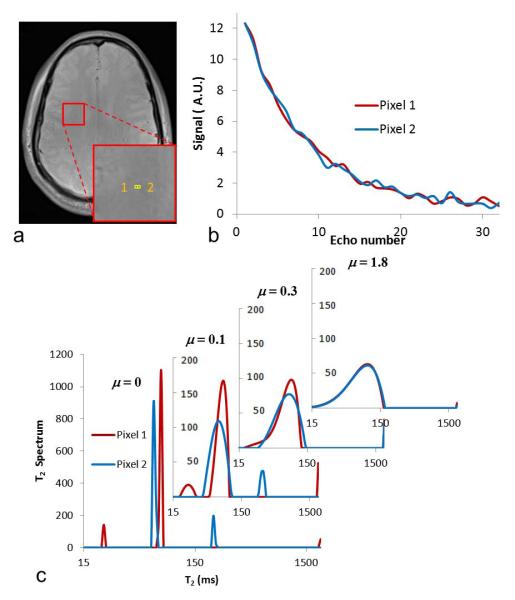
Spectra from two neighboring pixels. (a) Locations of two pixels in white matter. (b) T2 decay curves of two pixels. (c) T2 spectra generated using four μ values.
In Fig. 3c, all the peaks became broader with a small regularization coefficient, μ = 0.1, but the locations of the small peaks of two pixels were still on each side of the major peaks. When μ was increased to 0.3, the spectra within myelin water and intra- and extracellular water intervals became one broad peak, but there was still a significant difference between the two spectra of adjacent pixels. When μ was increased to 1.8, the two spectra of adjacent pixels became approximately the same, from which consistent MWF values of both pixels were computed as 12.7% and 12.1%. In these two investigations, the larger the μ value, the less sensitive the wrNNLS algorithm became to measurement noise and the more the algorithm smoothed the T2 spectrum. The smoothness of the spectrum and the sensitivity to noise have to be compromised to achieve an optimal result. If the regularization is too large, the MWF values become less sensitive to different brain structures and become similar for all regions. If the regularization is too small, the MWF values could be dramatically different in the same brain tissue. There should be an optimal point for regularization to balance the sensitivity and reliability to measure MWF values for different or similar types of brain tissue. In addition, the MWF values should be consistent with the formerly reported values. Therefore, an optimal value of μ = 1.6 was used in this study to achieve this type of optimization to a greater extent.
Number of T2 Sampling Points
Fig. 4 shows that the average MWF within the ROI shown in Fig. 2 varied with different sampling points M when μ = 1.8. The maximal change of MWF reached about 2% within a small range of T2 sampling points from 80 to 120. This 2% variation was considered large for a small average MWF (about 12%). When T2 was logarithmically sampled, the actual T2 upper threshold of the myelin water interval also varied greatly with the number of sampling points. The pattern of the actual upper threshold change was consistent with that of the average MWF, which shows that the variation of the average MWF was caused by using different numbers of sampling points. One set of sampling point numbers was marked on the top of plot, which corresponded to actual thresholds closest to the specified myelin water T2 threshold of 40 ms. In this study, the number of T2 sampling points of 96 was chosen to balance computation efficiency and spectral accuracy.
Fig. 4.
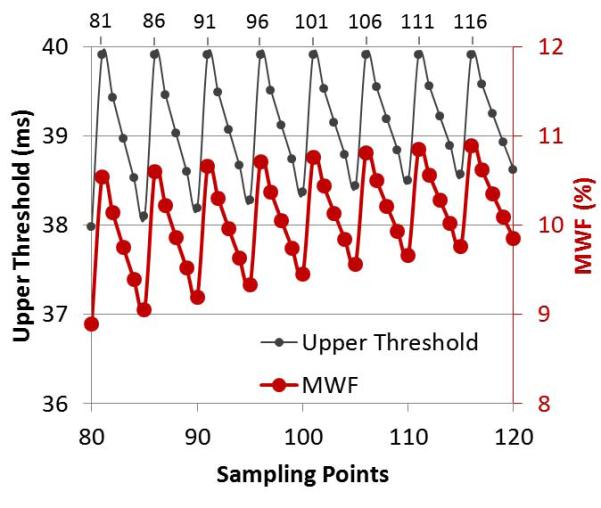
Effects of T2 sampling points. Actual upper T2 threshold of the myelin water component is shown with the solid black line and small dot markers; average MWF within the ROI shown in Fig. 2 is shown with the solid red line and larger dot markers.
Effects of the NLM Filter and CPMG sequences
The effect of the NLM filter is shown in Fig. 5. MWF and IEWF were computed using the wrNNLS algorithm with μ = 1.8 and M = 96. Figs. 5b and 5d show the original MWF and IEWF maps without using the NLM filter, and Figs. 5c and 5e show the filtered MWF and IEWF maps, which are dramatically improved over the original maps without blurring images. Therefore, the NLM filter played a larger role in the final MWF and IEWF maps when noise was the primary issue in data postprocessing. In Fig. 5, MWF is displayed with a color map of hot magenta, and IEWF is displayed with a color map of gem.
Fig. 5.
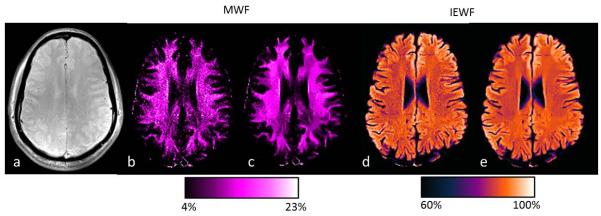
Effects of non-local mean filter. (a) Original magnitude image. (b and d) MWF and IEWF maps without the non-local mean filter. (c and e) Corresponding MWF and IEWF maps with the filter.
Fig. 6 shows two MWF maps using modified and conventional CPMG sequences and the difference between the two maps. The data processing was done using the same wrNNLS algorithm with μ = 1.8 and M = 96 and the NLM filter. Figs. 6b and 6c are displayed in the same color map and color scale. MWF values from the conventional CPMG sequence were substantially lower than those from the modified CPMG sequence. The average MWF values within the small ROI shown in Fig. 6a were 11.9% and 5.7% for the two maps (Figs. 6a and 6b). The nearly uniform shift in white matter between the two MWF maps is shown in Fig. 6c.
Fig. 6.
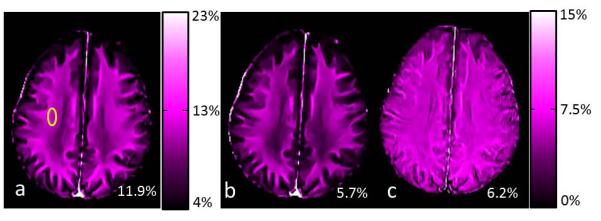
MWF maps generated from the modified (a) and conventional (b) CPMG sequences and the difference (c) between two maps. MWF values from the yellow ROI are shown in the lower right corner of each image.
Effects of rNNLS and wrNNLS algorithms
Fig. 7 shows parametric maps of a single slice from a healthy volunteer using rNNLS and wrNNLS algorithms. The same denoising filter was applied following both algorithms. Four parametric maps using rNNLS and μ = 0.26 are shown in the first row, and parametric maps using wrNNLS and μ = 1.8 are shown in the second row. In the rNNLS algorithm, μ = 0.26 was used because the value substantially improved the results (29). In addition, the MWF value (14%) near the lateral ventricle in white matter using rNNLS with μ = 0.26 was comparable to the MWF value (12.5%) computed using wrNNLS with μ = 1.8. There were two impressive differences between the two algorithms. First, the MWF was dramatically underestimated in the edge region of the brain using rNNLS in comparison with wrNNLS. The MWF values were 6.3% for rNNLS and 11.4% for wrNNLS in the forceps minor. Second, the rNNLS algorithm generated much stronger contamination in the LWF map from the CSFF map than the wrNNLS algorithm because spectral amplitudes corresponding to a larger T2 value in the rNNLS algorithm were overweighted in the regularization because of the logarithmically spaced sampling. Therefore, the quality of the parametric maps using wrNNLS was dramatically improved over those using rNNLS.
Fig. 7.
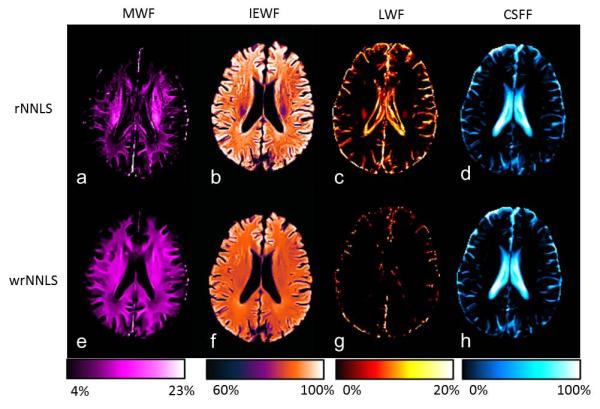
Parametric maps of one slice using the rNNLS and wrNNLS algorithms. (a–d) MWF, IEWF, LWF, and CSFF maps using the rNNLS algorithm with μ = 0.26 and (e–h) corresponding maps using the wrNNLS algorithm with μ = 1.8. Images in each column are displayed with the same color map and color scale. The color bars are displayed under each column.
Parametric Maps of Healthy Volunteer and LE Patient
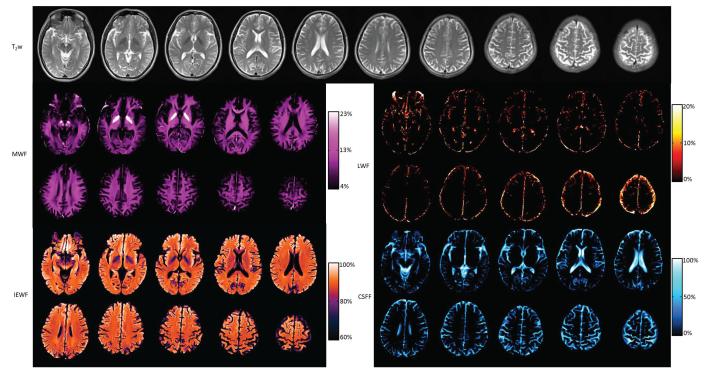
T2-weighted (T2w) images and all parametric maps of 10 slices from a healthy volunteer acquired in one examination are shown in Fig. 8. Ten T2w images are shown in the first two rows; MWF maps are shown in rows three and four; IEWF maps are shown in rows five and six; CSFF maps are shown in rows seven and eight. Each set of images is displayed in the same color map and color scale. Two pairs of bright structures shown in the second and third MWF maps are the globus pallidus, in which the MWF was measured at about 24%. The anatomy of the brain is clearly displayed in the MWF, IEWF, and CSFF maps. For a healthy volunteer, the LWF map was almost empty except for some contamination at the edge of the brain. However, the LWF map from the patient can be very useful. To our knowledge, this is the first time that IEWF and CSFF maps have been shown, even though MWF maps have been widely reported, and LWF maps were shown once by Laule (7). Typical MWF values in six white matter regions were measured in two healthy volunteers and are compared with previously reported values (20) in Table 1. All MWF values from two volunteers were highly consistent with each other. Most MWF values in this study were consistent with formerly reported values except MWF values in the genu of the corpus callosum and the forceps minor. The fourth slice in Fig. 8 was chosen to measure MWF values since the genu and splenium of the corpus callosum can be clearly seen.
Fig. 8.
T2w images and MWF, IEWF, LWF, and CSFF maps of 10 slices of a healthy volunteer. Each set of images is displayed in the same gray or color scale.
Table 1.
Comparison of Myelin Water Fraction (MWF) values (%) of two healthy volunteers with reported values by Whittall et al. (1997) in several white matter regions. Standard deviation were included if available.
| Location | Forceps minor |
Forceps major |
Genu Of CC |
Splenium Of CC |
Posterior Internal capsule |
Average WM |
|---|---|---|---|---|---|---|
| Volunteer 1 | 11.94 ± 0.34 | 10.03 ± 0.62 | 15.40 ± 1.37 | 12.57 ± 1.34 | 14.69 ± 0.89 | 12.02 ± 1.46 |
| Volunteer 2 | 11.39 ± 0.33 | 10.37 ± 0.81 | 15.42 ± 2.74 | 13.03 ± 1.57 | 15.68 ± 0.86 | 12.18 ± 1.99 |
| Whittall et al. | 8.40 ± 0.89 | 10.11 ± 0.51 | 9.86 ± 0.96 | 13.05 ± 0.96 | 15.00 ± 0.95 | 11.28 |
Reported values by Whittall et al. (1997) were averages from 12 volunteers on 1.5 T GE scanner. MWF values for volunteer 1 and 2 were averages in each of white matter regions on 3.0 T Siemens scanner. CC represents corpus callosum; WM represents white matter.
Fig. 9 shows parametric maps from the T2SPARC method for a healthy volunteer and a patient with LE in a similar slice position. Average parametric values from normal appearing white matter and two lesions are summarized in Table 2. Normal MWF values in red ROIs from the volunteer and the patient were similar (12.3% and 11.1%, respectively). MWF values from the green and yellow lesion ROIs were 1.9% and 4.5% in the patient, which were substantially lower than the MWF values from similar regions in the volunteer (11.0% and 12.3%). The LWF in the green ROI from the patient was 8.3%, which was dramatically beyond the normal value (0%).
Fig. 9.
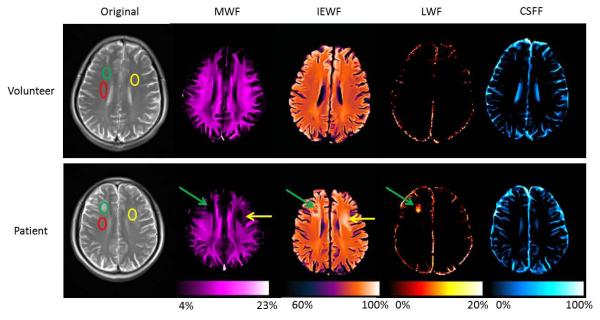
Comparison of parametric maps between a healthy volunteer and a patient using the T2SPARC method. T2-weighted image and four parametric maps from a healthy volunteer are in the first row, and the corresponding images of a patient are in the second row. Three elliptical ROIs were drawn in the volunteer’s and the patient’s T2-weighted image. For the patient, the red ROI was in normal white matter; the green and yellow ROIs were in lesions; the green and yellow arrows point to lesions in the parametric maps. The average measurements of different ROIs are shown in Table 2.
Table 2.
Average parameters measured in different ROIs
| Subject | ROI | MWF % | IEWF % | LWF % | CSFF % |
|---|---|---|---|---|---|
| Volunteer | Red | 12.3 | 87.6 | 0 | 0.1 |
| Yellow | 12.3 | 87.7 | 0 | 0 | |
| Green | 11.0 | 89.0 | 0 | 0 | |
|
| |||||
| Patient | Red | 11.1 | 88.9 | 0 | 0 |
| Yellow | 4.5 | 95.5 | 0 | 0 | |
| Green | 1.9 | 89.8 | 8.3 | 0 | |
Abbreviations: ROI, region of interest; MWF, myelin water fraction; IEWF, intra- and extracellular water fraction; LWF, long T2 tissue water fraction; CSFF, cerebral spinal fluid fraction.
Reproducibility study
For each of the parametric maps, values were averaged together across the ROIs, and the within-subject and between-subject standard deviation and CV values are summarized in Table 3. Within-subject CVs of MWF and IEWF were 3.12% and 0.51%, and between-subject CVs were 7.67% and 1.12%. For each subject, the MWF, IEWF, LWF and CSFF values were found to be highly reproducible. The CVs of LWF and CSFF were not reported due to their small or zero mean values in selected ROIs. The mean, standard deviation, and CV values of MWF in each of five ROIs were reported separately in Table 4. There is a slight variation of the CV values in the different ROIs.
Table 3.
Mean, Std, and CV values measured within five volunteers imaged three times each in the reproducibility study.
| Parameters | MWF | IEWF | LWF | CSFF | |
|---|---|---|---|---|---|
| Mean (%) | 12.35 | 87.41 | 0.00 | 0.14 | |
| Within-subject | Std | 0.37 | 0.45 | 0.00 | 0.11 |
| CV (%) | 3.12 | 0.51 | — | — | |
|
| |||||
| Between-subject | Std | 0.95 | 0.98 | 0.00 | 0.17 |
| CV (%) | 7.67 | 1.12 | — | — | |
Abbreviations: Std, standard deviation; CV, coefficient of variation; MWF, myelin water fraction; IEWF, intra- and extracellular water fraction; LWF, long T2 tissue water fraction; CSF, cerebral spinal fluid fraction.
Table 4.
Mean, Std, and CV values of MWF measured within each of five ROIs in the reproducibility study.
| Parameters | Forceps Minor |
Forceps Major |
Genu of CC |
Splenium of CC |
Posterior internal Capsule |
|
|---|---|---|---|---|---|---|
| Mean (%) | 11.5 | 10.36 | 15.81 | 12.35 | 11.72 | |
| Within-subject | Std | 0.56 | 0.21 | 0.28 | 0.48 | 0.34 |
| CV (%) | 4.94 | 2.03 | 1.77 | 3.98 | 2.89 | |
|
| ||||||
| Between-subject | Std | 0.78 | 0.72 | 1.17 | 1.02 | 1.04 |
| CV (%) | 6.80 | 6.95 | 7.42 | 8.32 | 8.86 | |
Abbreviations: Std, standard deviation; CV, coefficient of variation; MWF, myelin water fraction; CC represents corpus callosum.
Discussion
The T2SPARC method for myelin water imaging consists of 1) an acquisition scheme using a modified multi-slice CPMG sequence with a refocusing slice thickness three times larger and two scans with interleaved slices, 2) a new wrNNLS algorithm with an optimal regularization constant μ = 1.8 and T2 sampling points M = 96, and 3) the NLM denoising filter. The proposed acquisition scheme can substantially diminish deviations of signal measurements from the true T2 decay curve and can reduce scan time to approximately 11 minutes for 10 slices. The postprocessing techniques using the new wrNNLS algorithm and the NLM denoising filter can produce robust parametric maps with remarkable image quality. The crucial parameters for the robustness are the regularization constant and the number of T2 sampling points.
Several reported methods designed to increase robustness attempt to use denoising filters such as the anisotropic diffusion filter to improve the quality of T2 decay curves (30,31) or use spatial regularization to generate results similar to those using a filter (31,32). However, these improvements in image quality were still limited, especially for in vivo data, in comparison with our results. This limitation was mainly due to ill-posedness in the inverse problem when using a small regularization constant. When using a large regularization constant, the sensitivity to noise was dramatically reduced. We proposed an optimal value (μ = 1.8) to balance the smoothness of the spectrum and the sensitivity to noise to achieve the best image quality. In addition, the same prescribed threshold (e.g., 40 ms for MWF) and the fixed optimal T2 sampling number (i.e., M = 96) should be used for comparison of results among different research groups since the sensitivity to the threshold increased.
In the T2SPARC method, the wrNNLS algorithm generated more uniform MWF maps than the rNNLS algorithm as shown in Fig. 7. The rNNLS algorithm dramatically underestimated the MWF near the edge of the brain. Strong contamination in LWF maps from CSFF maps was also observed using the rNNLS algorithm. The underestimation and contamination became more dramatic as the regularization constant increased. The worse contamination was due to the overweighted regularization of spectral amplitudes corresponding to larger T2 value when using logarithmically spaced sampling in comparison with wrNNLS.
The NLM filter is the best denoising filter with the presence of similar image structures in contrast to other classical filters such as the anisotropic diffusion filter (27). The NLM filter played a significant role in the image quality of parametric maps. We applied the NLM filter after the wrNNLS algorithm instead of using the anisotropic diffusion filter before the inverse algorithm as other researchers have done (30,31). The filtered MWF maps from other studies were blurred and smoothed in comparison with our filtered MWF maps, because the anisotropic diffusion filter removed and smoothed some fine details and structure of the image.
Using the T2SPARC method, a potential issue arises if a larger coverage is required, because no more than five slices can be acquired in each of two scans due to the limitation of the specific absorption rate (SAR) in pediatric patients (no more than 7 slices for an adult). A third MRI scan can be added, and the acquisition scheme adjusted to acquire a total of 15 slices (no gap) within 16 minutes 27 seconds in comparison with 11 minutes for two scans. The total acquisition time is still an acceptable time for clinical applications. However, in most cases, 10 slices were adequate to cover most of the brain in pediatric patients. Another issue of concern is the potential to miss small lesions due to the gap or partial volume in the thicker slices. If the scan time is not an issue, acquisition without a gap or even with smaller slice thickness can be achieved with additional scans and a corresponding longer acquisition time (e.g. 16 minutes or more) by adjusting the shift between scans. Magnetic transfer (MT) effects could generate an unintended MT contrast in 2D multislice imaging due to off-resonance excitation of neighboring slices (33). In this study, a large slice gap (200%) greatly diminished the effect of off-resonance excitation without generating an evident magnetization transfer effect on the neighboring slice. In this study, due to the short acquisition window (32 echoes for total of 320 ms sampling), LWF and CSFF values from the T2SPARC method may not be accurate and comparable with those using a longer echo train (48 echoes and extended coverage to 1120 ms (34)). However, longitudinal changes in the LWF and CSFF maps could be monitored when using the same method for each examination. We will further investigate the accuracy and precision of these measures in a future study.
The MWF map was the most common parametric map for assessing myelin integrity. Recently, the LWF was reported for detecting brain lesions with long T2-related abnormalities (7). IEWF and CSFF maps have not been explored previously. This may be due to the poor quality of maps using the rNNLS algorithm with a small regularization constant. In our findings, brain lesions were clearly shown on MWF, IEWF, and LWF maps with different characteristics (Figure 9). For this patient with acute neurotoxicity, the lesion on the right side of brain is clearly distinguished from the similar appearing lesion on the left side by the existence of the LWF component. This lesion on the right was later shown to be chronic on follow-up imaging while the lesion on the left was transient and resolved with time. LWF could potentially become a very important factor for future clinical applications. Other potential applications include assessing demyelinating diseases (e.g., multiple sclerosis), monitoring myelination in early childhood, and detecting cancerous lesions.
In conclusion, we present the T2SPARC method, including an efficient acquisition scheme and a robust and new postprocessing technique for generating myelin water maps. We have shown remarkable in vivo results from healthy volunteers and one LE patient. This method allowed a shorter acquisition time and provided higher image quality and large volume coverage for practical clinical applications. Furthermore, this method yields some byproducts such as IEWF, LWF, and CSFF maps, which can also be useful as a noninvasive means to identify lesions in different brain diseases.
Acknowledgment
This study was supported by Cancer Center Support Grant P30 CA21765 and R01 CA090246 from the National Cancer Institute (NCI), and by the American Lebanese Syrian Associated Charities (ALSAC). We thank David Galloway for editorial assistance.
References
- 1.ffrench-Constant C, Colognato H, Franklin RJ. Neuroscience. The mysteries of myelin unwrapped. Science. 2004;304(5671):688–689. doi: 10.1126/science.1097851. [DOI] [PubMed] [Google Scholar]
- 2.Reddick WE, Laningham FH, Glass JO, Pui CH. Quantitative morphologic evaluation of magnetic resonance imaging during and after treatment of childhood leukemia. Neuroradiology. 2007;49(11):889–904. doi: 10.1007/s00234-007-0262-9. [DOI] [PMC free article] [PubMed] [Google Scholar]
- 3.Compston A, Coles A. Multiple sclerosis. Lancet. 2008;372(9648):1502–1517. doi: 10.1016/S0140-6736(08)61620-7. [DOI] [PubMed] [Google Scholar]
- 4.Menon RS, Rusinko MS, Allen PS. Proton relaxation studies of water compartmentalization in a model neurological system. Magnetic resonance in medicine : official journal of the Society of Magnetic Resonance in Medicine / Society of Magnetic Resonance in Medicine. 1992;28(2):264–274. doi: 10.1002/mrm.1910280208. [DOI] [PubMed] [Google Scholar]
- 5.MacKay A, Whittall K, Adler J, Li D, Paty D, Graeb D. In vivo visualization of myelin water in brain by magnetic resonance. Magnetic resonance in medicine : official journal of the Society of Magnetic Resonance in Medicine / Society of Magnetic Resonance in Medicine. 1994;31(6):673–677. doi: 10.1002/mrm.1910310614. [DOI] [PubMed] [Google Scholar]
- 6.Kolind SH, Madler B, Fischer S, Li DK, MacKay AL. Myelin water imaging: Implementation and development at 3.0T and comparison to 1.5T measurements. Magnetic resonance in medicine : official journal of the Society of Magnetic Resonance in Medicine / Society of Magnetic Resonance in Medicine. 2009;62(1):106–115. doi: 10.1002/mrm.21966. [DOI] [PubMed] [Google Scholar]
- 7.Laule C, Vavasour IM, Madler B, Kolind SH, Sirrs SM, Brief EE, Traboulsee AL, Moore GR, Li DK, MacKay AL. MR evidence of long T2 water in pathological white matter. Journal of magnetic resonance imaging : JMRI. 2007;26(4):1117–1121. doi: 10.1002/jmri.21132. [DOI] [PubMed] [Google Scholar]
- 8.Levitt MH, Freeman R. NMR population inversion using a composite pulse. Journal of Magnetic Resonance. 1979;33(2):473–476. doi: 10.1016/j.jmr.2011.08.016. 1969. [DOI] [PubMed] [Google Scholar]
- 9.Poon CS, Henkelman RM. Practical T2 quantitation for clinical applications. Journal of magnetic resonance imaging : JMRI. 1992;2(5):541–553. doi: 10.1002/jmri.1880020512. [DOI] [PubMed] [Google Scholar]
- 10.Whittall KP, MacKay AL. Quantitative interpretation of NMR relaxation data. Journal of Magnetic Resonance. 1989;84(1):134–152. 1969. [Google Scholar]
- 11.Moore GR, Leung E, MacKay AL, Vavasour IM, Whittall KP, Cover KS, Li DK, Hashimoto SA, Oger J, Sprinkle TJ, Paty DW. A pathology-MRI study of the short-T2 component in formalin-fixed multiple sclerosis brain. Neurology. 2000;55(10):1506–1510. doi: 10.1212/wnl.55.10.1506. [DOI] [PubMed] [Google Scholar]
- 12.Webb S, Munro CA, Midha R, Stanisz GJ. Is multicomponent T2 a good measure of myelin content in peripheral nerve? Magnetic resonance in medicine : official journal of the Society of Magnetic Resonance in Medicine / Society of Magnetic Resonance in Medicine. 2003;49(4):638–645. doi: 10.1002/mrm.10411. [DOI] [PubMed] [Google Scholar]
- 13.Laule C, Leung E, Lis DK, Traboulsee AL, Paty DW, MacKay AL, Moore GR. Myelin water imaging in multiple sclerosis: quantitative correlations with histopathology. Mult Scler. 2006;12(6):747–753. doi: 10.1177/1352458506070928. [DOI] [PubMed] [Google Scholar]
- 14.Laule C, Kozlowski P, Leung E, Li DK, Mackay AL, Moore GR. Myelin water imaging of multiple sclerosis at 7 T: correlations with histopathology. NeuroImage. 2008;40(4):1575–1580. doi: 10.1016/j.neuroimage.2007.12.008. [DOI] [PubMed] [Google Scholar]
- 15.Du YP, Chu R, Hwang D, Brown MS, Kleinschmidt-DeMasters BK, Singel D, Simon JH. Fast multislice mapping of the myelin water fraction using multicompartment analysis of T2* decay at 3T: a preliminary postmortem study. Magnetic resonance in medicine : official journal of the Society of Magnetic Resonance in Medicine / Society of Magnetic Resonance in Medicine. 2007;58(5):865–870. doi: 10.1002/mrm.21409. [DOI] [PubMed] [Google Scholar]
- 16.Oh J, Han ET, Lee MC, Nelson SJ, Pelletier D. Multislice brain myelin water fractions at 3T in multiple sclerosis. Journal of neuroimaging : official journal of the American Society of Neuroimaging. 2007;17(2):156–163. doi: 10.1111/j.1552-6569.2007.00098.x. [DOI] [PubMed] [Google Scholar]
- 17.Deoni SC, Rutt BK, Arun T, Pierpaoli C, Jones DK. Gleaning multicomponent T1 and T2 information from steady-state imaging data. Magnetic resonance in medicine : official journal of the Society of Magnetic Resonance in Medicine / Society of Magnetic Resonance in Medicine. 2008;60(6):1372–1387. doi: 10.1002/mrm.21704. [DOI] [PubMed] [Google Scholar]
- 18.Fernandez-Seara MA, Wehrli FW. Postprocessing technique to correct for background gradients in image-based R*(2) measurements. Magnetic resonance in medicine : official journal of the Society of Magnetic Resonance in Medicine / Society of Magnetic Resonance in Medicine. 2000;44(3):358–366. doi: 10.1002/1522-2594(200009)44:3<358::aid-mrm3>3.0.co;2-i. [DOI] [PubMed] [Google Scholar]
- 19.Hwang D, Kim DH, Du YP. In vivo multi-slice mapping of myelin water content using T2* decay. NeuroImage. 2010;52(1):198–204. doi: 10.1016/j.neuroimage.2010.04.023. [DOI] [PubMed] [Google Scholar]
- 20.Whittall KP, MacKay AL, Graeb DA, Nugent RA, Li DK, Paty DW. In vivo measurement of T2 distributions and water contents in normal human brain. Magnetic resonance in medicine : official journal of the Society of Magnetic Resonance in Medicine / Society of Magnetic Resonance in Medicine. 1997;37(1):34–43. doi: 10.1002/mrm.1910370107. [DOI] [PubMed] [Google Scholar]
- 21.Lankford CL, Does MD. On the inherent precision of mcDESPOT. Magnetic resonance in medicine. 2012 doi: 10.1002/mrm.24241. in press, http://onlinelibrary.wiley.com/doi/10.1002/mrm.24241/abstract. [DOI] [PMC free article] [PubMed]
- 22.Hennig J. Echoes—how to generate, recognize, use or avoid them in MR-imaging sequences. Part I: Fundamental and not so fundamental properties of spin echoes. Concepts in Magnetic Resonance. 1991;3(3):125–143. [Google Scholar]
- 23.Le Roux P. Non-CPMG Fast Spin Echo with Full Signal. Journal of Magnetic Resonance. 2002;155(2):278–292. doi: 10.1006/jmre.2002.2523. [DOI] [PubMed] [Google Scholar]
- 24.Pell GS, Briellmann RS, Waites AB, Abbott DF, Lewis DP, Jackson GD. Optimized clinical T2 relaxometry with a standard CPMG sequence. Journal of magnetic resonance imaging : JMRI. 2006;23(2):248–252. doi: 10.1002/jmri.20490. [DOI] [PubMed] [Google Scholar]
- 25.Buades A, Coll B, Morel J-M. A Non-Local Algorithm for Image Denoising. Proceedings of the 2005 IEEE Computer Society Conference on Computer Vision and Pattern Recognition (CVPR’05) - Volume 2 - Volume 02: IEEE Computer Society.2005. pp. 60–65. [Google Scholar]
- 26.MacKay A, Laule C, Vavasour I, Bjarnason T, Kolind S, Madler B. Insights into brain microstructure from the T2 distribution. Magnetic resonance imaging. 2006;24(4):515–525. doi: 10.1016/j.mri.2005.12.037. [DOI] [PubMed] [Google Scholar]
- 27.Buades A, Coll B, Morel J-M. Nonlocal Image and Movie Denoising. International Journal of Computer Vision. 2008;76(2):123–139. [Google Scholar]
- 28.Haacke EM, Cheng NY, House MJ, Liu Q, Neelavalli J, Ogg RJ, Khan A, Ayaz M, Kirsch W, Obenaus A. Imaging iron stores in the brain using magnetic resonance imaging. Magnetic resonance imaging. 2005;23(1):1–25. doi: 10.1016/j.mri.2004.10.001. [DOI] [PubMed] [Google Scholar]
- 29.Ji Q, Guo J, Glass JO, Reddick WE. Strong Regularization for Brain Myelin Water Quantication in T2 Relaxation MRI Obtained in 3.0 T. Montreal, Canada: 2011. p. 4562. [Google Scholar]
- 30.Jones CK, Whittall KP, MacKay AL. Robust myelin water quantification: averaging vs. spatial filtering. Magnetic resonance in medicine : official journal of the Society of Magnetic Resonance in Medicine / Society of Magnetic Resonance in Medicine. 2003;50(1):206–209. doi: 10.1002/mrm.10492. [DOI] [PubMed] [Google Scholar]
- 31.Hwang D, Chung H, Nam Y, Du YP, Jang U. Robust mapping of the myelin water fraction in the presence of noise: Synergic combination of anisotropic diffusion filter and spatially regularized nonnegative least squares algorithm. Journal of magnetic resonance imaging : JMRI. 2011;34(1):189–195. doi: 10.1002/jmri.22586. [DOI] [PubMed] [Google Scholar]
- 32.Hwang D, Du YP. Improved myelin water quantification using spatially regularized non-negative least squares algorithm. Journal of magnetic resonance imaging : JMRI. 2009;30(1):203–208. doi: 10.1002/jmri.21783. [DOI] [PubMed] [Google Scholar]
- 33.Weigel M, Helms G, Hennig J. Investigation and modeling of magnetization transfer effects in two-dimensional multislice turbo spin echo sequences with low constant or variable flip angles at 3 T. Magnetic resonance in medicine : official journal of the Society of Magnetic Resonance in Medicine / Society of Magnetic Resonance in Medicine. 2010;63(1):230–234. doi: 10.1002/mrm.22145. [DOI] [PubMed] [Google Scholar]
- 34.Skinner MG, Kolind SH, MacKay AL. The effect of varying echo spacing within a multiecho acquisition: better characterization of long T2 components. Magnetic resonance imaging. 2007;25(6):840–847. doi: 10.1016/j.mri.2006.09.046. [DOI] [PubMed] [Google Scholar]


