

Abstract
Background
Ethnic differences in cardiac arrhythmia incidence have been reported, with a particularly high incidence of sudden cardiac death (SCD) and low incidence of atrial fibrillation in individuals of African ancestry. We tested the hypotheses that African ancestry and common genetic variants are associated with prolonged duration of cardiac repolarization, a central pathophysiological determinant of arrhythmia, as measured by the electrocardiographic QT interval.
Methods and Results
First, individual estimates of African and European ancestry were inferred from genome-wide single nucleotide polymorphism (SNP) data in seven population-based cohorts of African Americans (n=12 097) and regressed on measured QT interval from electrocardiograms. Second, imputation was performed for 2.8 million SNPs and a genome-wide association (GWA) study of QT interval performed in ten cohorts (n=13 105). There was no evidence of association between genetic ancestry and QT interval (p=0.94). Genome-wide significant associations (p<2.5×10⁻⁸) were identified with SNPs at two loci, upstream of the genes NOS1AP (rs12143842, p=2×10⁻¹⁵) and ATP1B1 (rs1320976, p=2×10⁻¹⁰). The most significant SNP in NOS1AP was the same as the strongest SNP previously associated with QT interval in individuals of European ancestry. Low p-values (p<10−5) were observed for SNPs at several other loci previously identified in GWA studies in individuals of European ancestry, including KCNQ1, KCNH2, LITAF and PLN.
Conclusions
We observed no difference in duration of cardiac repolarization with global genetic indices of African ancestry. In addition, our GWA study extends the association of polymorphisms at several loci associated with repolarization in individuals of European ancestry to include African Americans.
Keywords: electrocardiography, electrophysiology, genome-wide association studies, ion channels, repolarization
Ethnic differences in cardiac arrhythmia incidence have been reported, with higher incidence of sudden cardiac death (SCD) and lower incidence of atrial fibrillation (AF) in African Americans compared to Americans of European ancestry.1–3 These differences have been independent of measured environmental and behavioral factors and therefore attributed to differences in genetic makeup, although the specific genetic determinants have not been identified.3,4 Rare non-synonymous genetic variants in cardiac ion channel genes have been found more often in African Americans than European Americans,5 some of which have been associated with arrhythmia risk and myocardial electrophysiological characteristics.6
With regard to myocardial electrophysiological characteristics, myocardial repolarization time has been established to be of particular importance for arrhythmia risk. Prolongation of the myocardial repolarization time, as measured by the electrocardiographic QT interval, confers increased risk of SCD7, whereas shortening of the atrial repolarization time has been associated with AF8. Furthermore, QT interval has been shown to be highly heritable in individuals of both European9 and African ancestry,10 resulting from genetic determination by rare variants, common genetic variants, or both. Thus, ancestral differences in repolarization time might account for the observed pattern of ethnic differences in arrhythmia incidence. We therefore formed a consortium of African American cohorts with information on QT interval duration and genome-wide single nucleotide polymorphism (SNP) data. Two hypotheses—firstly whether genetic ancestry is associated with QT interval and secondly whether common genetic variants are associated with QT interval duration in African Americans—were tested in a genome-wide association (GWA) study.
Material and Methods
Study samples
The study included ten cohorts of self-reported African Americans with genome-wide SNP data, as part of the Continental Origins and Genetic Epidemiology Network (COGENT), the Candidate-gene Association Resource (CARe) consortium and the Women’s Health Initiative (WHI) SNP Health Association Resource. The four cohorts genotyped as part of the CARe consortium– Atherosclerosis Risk in Communities (ARIC),11 Cleveland Family Study (CFS),12 Jackson Heart Study (JHS)13 and Multi-Ethnic Study of Atherosclerosis (MESA)14 – have been described previously15, as have the COGENT cohorts; Bogalusa Heart Study (BHS),16 Baltimore Longitudinal Study of Aging (BLSA),17,18 Cardiovascular Heart Study (CHS),19 Health, Aging and Body Composition Study (HABC),20,21 Healthy Aging in Neighborhoods of Diversity across the Life Span (HANDLS)22 and Women’s Health Initiative (WHI).23 Additional cohort descriptions are available in the Supplementary Methods. Genotyping, quality control, calculation of eigenvectors and imputation in the four cohorts of the CARe consortium have been detailed previously15,24 and are summarized along with other cohorts in Supplementary Table 1. The study protocol was approved by the Institutional Review Boards of participating institutions. Only individuals who provided informed consent for genetic testing were included. The authors had full access to the data and take responsibility for its integrity. All authors have read and agreed to the manuscript as written.
Electrocardiographic measurements
12-lead electrocardiograms with standard electrode placements were recorded with a paper speed of 25 mm per second during ten seconds in all cohorts using either MAC PC, MAC6 (CFS), MAC5000 (BLSA), MAC5500 (HANDLS) or MAC1200 (MESA) machines (GE Healthcare, Milwaukee, WI, USA). QT and RR interval durations were measured electronically using either the Marquette 12SL algorithm or the MC MEANS algorithm (JHS).
Phenotype modeling
We excluded individuals on the basis of missing measurements of QT or RR interval duration, atrial fibrillation or flutter, left or right bundle branch block, QRS duration ≥120 msec, intraventricular conduction delay or a pacemaker implant. In both ancestry and GWA analyses, adjustment was performed for age, sex, RR interval and study site in multi-center cohorts (ARIC, CHS, HABC, MESA and WHI) in linear regression models.
Ancestry analysis
In the four CARe cohorts, individual estimates of the proportion of African relative to European ancestry was calculated from 3192 independent ancestry informative markers included on the Affymetrix 6.0 array using the Markov Chain Monte Carlo algorithm implemented in ANCESTRYMAP25 as in previous studies.3,15 Ancestry estimates were calculated from 656,852 autosomal markers using the maximum likelihood algorithm implemented in frappe26 (which has been demonstrated to be robust to linkage disequilibrium) in WHI and the model-based clustering algorithm of STRUCTURE27 in HABC and HANDLS including 1335 independent ancestry informative markers28 and 279,967 markers after linkage disequilibrium based pruning (r2<0.5) from the Illumina 1M array, respectively. To test the association of this measure of continental ancestry with QT interval, QT interval was regressed linearly on ancestry estimates with adjustment for the covariates listed above and association tested using likelihood-ratio or Wald tests. Heterogeneity was assessed across cohorts and results combined using the rmeta package for R (R Foundation for Statistical Computing, Vienna, Austria).
Genome-wide association analysis
Genetic association analyses were performed in each cohort using multiple linear regression models under an additive genetic model, using various statistical software packages as shown in Supplementary Table 1. Directly genotyped SNPs were tested where available, otherwise imputed genotypes were used to achieve a common set of SNPs across cohorts for the combined analysis and to improve coverage. For the family-based CFS study, association was assessed using linear mixed-effects models as implemented in the GWAF package for R.15 Pedigrees were confirmed using identity by state (IBS) or identity by descent (IBD) estimates. JHS contains a family-based subcohort, but use of family-based methods had minimal effects on inflation in preliminary analyses for a set of traits, so linear regression was used as in previous studies.15 Adjustment for the first ten or two (HABC) eigenvectors of genetic variation was performed in study-specific regression models to account for population substructure. Eigenvectors were calculated individually in each cohort using PLINK (HANDLS) or EIGENSTRAT (all other cohorts). Cohort-specific GWA results were combined using fixed effects meta-analysis with inverse variance weights. Genomic control was applied to results from each cohort prior to meta-analysis and in the combined results. A genome-wide significance threshold of 2.5×10⁻⁸ was pre-specified, based on a Bonferroni-adjusted threshold of p<0.05, assuming 2 million independent common variant tests in genomes of individuals of African ancestry as previously suggested.15,29 Effect heterogeneity across cohorts was assessed by Cochran’s χ2 test of heterogeneity and the I2 test.30,31
To identify multiple, independent signals within the same region, linkage disequilibrium (LD) pruning was performed, whereby independent signals were defined as at least two genome-wide significant SNPs in low LD (r2 < 0.05) in the same 1,000 kb region. Starting with the index SNP, defined as the most significant result, all surrounding genome-wide significant SNPs within 1,000 kb with a pairwise r2 ≥ 0.05 were placed into a bin with the index SNP using LD patterns from a 1:1 ratio of the HapMap European CEU sample and the Yoruba YRI sample. The procedure was repeated until all genome-wide SNPs were assigned membership into a bin.
Results
Baseline characteristics of the ten study cohorts are shown in Table 1. Hierarchical exclusions are shown in Supplementary Table 2. Participants were predominantly middle-aged and with a higher proportion of women. The proportion of variation in QT interval (r2) explained by basic covariates (age, sex, RR interval) was relatively high, largely attributable to RR interval, ranging from 0.44 to 0.67 as shown in Table 1.
Table 1.
Sample characteristics.
| ARIC (n=1808) | BHS (n=188) | BLSA (n=153) | CFS (n=316) | CHS (n=667) | HABC (n=1038) | HANDLS (n=957) | JHS (n=2057) | MESA (n=1556) | WHI (n=4365) | |
|---|---|---|---|---|---|---|---|---|---|---|
| Age (years) | 53.7 (5.9) | 35.6 (4.8) | 64.2 (11.3) | 44.3 (15.2) | 72.7 (5.6) | 73.4 (2.9) | 48.4 (8.9) | 54.6 (12.7) | 61.9 (10.1) | 61.6 (6.8) |
| Male sex (%) | 36.3 | 32.4 | 36.9 | 39.3 | 33.9 | 42.0 | 44.2 | 36.7 | 44.7 | 0 |
| QT interval (ms) | 409.2 (30.8) | 389.8 (30.5) | 413.6 (25.7) | 397.5 (30.0) | 404.0 (35.6) | 410.7 (35.1) | 407.4 (32.1) | 413.0 (30.9) | 410.3 (31.8) | 400.7 (34.0) |
| Heart rate (beats/min) | 67.5 (11.3) | 68.9 (11.0) | 63.1 (13.4) | 68.1 (9.8) | 67.3 (11.5) | 66.1 (11.2) | 68.0 (11.4) | 64.6 (10.5) | 63.0 (10.3) | 67.3 (10.9) |
| r2 | 0.52 | 0.57 | 0.53 | 0.51 | 0.67 | 0.56 | 0.44 | 0.52 | 0.65 | 0.65 |
| λGC | 1.02 | 1.00 | 1.00 | 1.05 | 1.07 | 1.00 | 1.00 | 1.05 | 1.01 | 1.03 |
Mean and standard deviation are reported for continuous variables and percentage of cases for dichotomous traits.
r2, coefficient of determination for a clinical model with age, sex and RR interval; λGC, genomic inflation factor; ARIC, Atherosclerosis Risk in Communities Study; BHS, Bogalusa Heart Study; BLSA, Baltimore Longitudinal Study of Aging; CFS, Cleveland Family Study; HABC, Health, Aging and Body Composition Study; HANDLS, Healthy Aging in Neighborhoods of Diversity across the Life Span; JHS, Jackson Heart Study; MESA, Multi-Ethnic Study of Atherosclerosis; WHI, Women’s Health Initiative.
Genetic ancestry and QT interval
Ancestry estimates were available in seven cohorts, including 12 097 individuals. The distribution of estimated proportion of African ancestry relative to European ancestry was roughly similar across cohorts as shown in Table 2. Significant heterogeneity of effects was detected across cohorts (P for heterogeneity=0.03), as shown in Supplementary Figure 1, and hence cohorts were combined using random-effects meta-analysis. Overall, there was no association of continental ancestry with QT interval in the combined sample (p=0.94).
Table 2.
Genetic ancestry and QT interval.
| Cohort | Effect* | P-value | African ancestry** |
|---|---|---|---|
| ARIC | 5.3 (4.8) | 0.27 | 0.85 (0.78–0.89) |
| CFS | 19.6 (10.2) | 0.06 | 0.82 (0.74–0.87) |
| HABC | −2.7 (5.7) | 0.64 | 0.81 (0.72–0.88) |
| HANDLS | −19.0 (8.2) | 0.02 | 0.84 (0.78–0.89) |
| JHS | −1.1 (5.5) | 0.84 | 0.84 (0.79–0.88) |
| MESA | −4.7 (3.5) | 0.19 | 0.81 (0.70–0.88) |
| WHI | 3.2 (2.0) | 0.10 | 0.79 (0.69–0.87) |
| Overall | −0.2 (−5.7, 5.3) | 0.94 |
Effect estimates are given as beta coefficients with standard errors for individual cohorts, with an overall effect estimate with 95% confidence interval. Beta coefficients refer to milliseconds with complete African ancestry compared to European ancestry.
African ancestry refers to the proportion of African compared to European ancestry, presented as median and interquartile range.
Genome-Wide Association Study
A meta-analysis of the ten GWA studies was performed, including a total of 13 105 individuals with typed or imputed genotypes for 2.8 million SNPs. Mild inflation of test statistics was observed with an overall genomic inflation factor (λGC) estimate of 1.03. After genomic control, there was a slight excess of low p-values (Figure 1). A total of 19 SNPs passed genome-wide significance (p<2.5×10⁻⁸), as shown in Table 3 and Figure 2. No evidence of significant heterogeneity was observed, after accounting for 19 tests (p>0.0026), as shown in Table 3. Cohort-specific results are shown in Supplementary Table 3. All 19 SNPs were non-coding and located on chromosome 1 at two loci separated by 7 megabases; 17 SNPs upstream of the NOS1AP gene and 2 SNPs upstream of ATP1B1.
Figure 1.
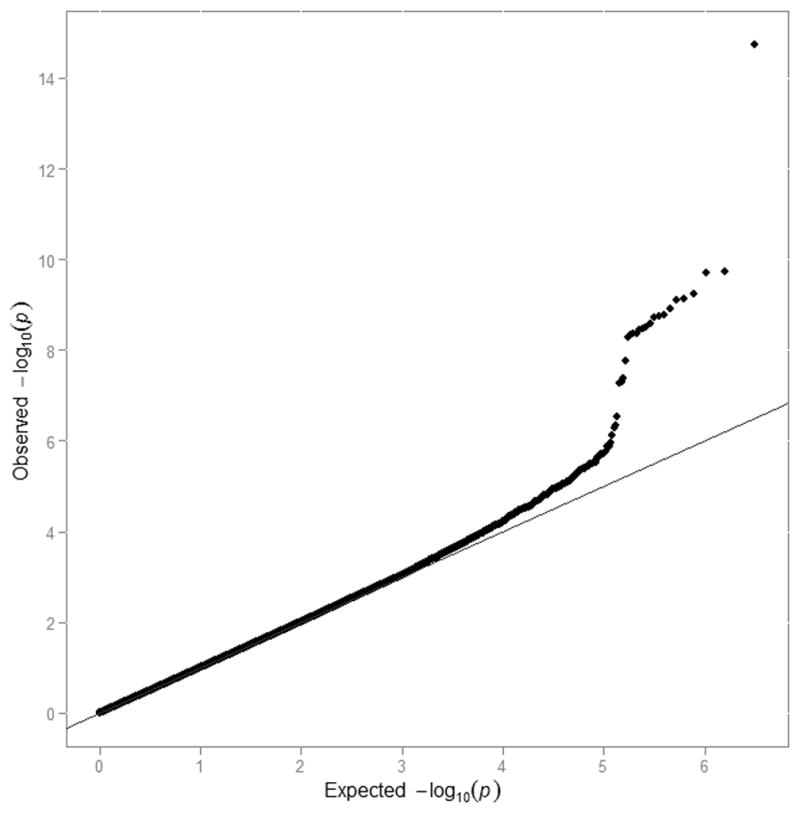
Quantile-quantile plot of GWA analysis of QT interval. Plotted are expected versus observed -log of all p-values after genomic control from QT interval GWAS. The measure of overdispersion of the test statistics, λGC, was 1.03 before genomic control and, by definition, was 1.0 after genomic control.
Table 3.
Results from GWA analysis of QT interval with p<2.5×10⁻⁸.
| SNP | Position on chr1 | Alleles | CAF | Neff | QT effect (SE) | P-value | Q | I2 | Locus |
|---|---|---|---|---|---|---|---|---|---|
| rs12143842 | 160300514 | T/C | 0.20 | 12812 | 3.14 (0.39) | 1.79×10⁻¹⁵ | 0.21 | 0.32 | NOS1AP |
| rs16847548 | 160301898 | C/T | 0.22 | 12629 | 2.17 (0.33) | 1.84×10⁻¹⁰ | 0.02 | 0.58 | NOS1AP |
| rs1320976 | 167339970 | A/G | 0.25 | 10767 | −2.06 (0.32) | 2.00×10⁻¹⁰ | 0.71 | 0 | ATP1B1 |
| rs12061601 | 167337074 | C/T | 0.29 | 12608 | −1.89 (0.30) | 5.88×10⁻¹⁰ | 0.65 | 0 | ATP1B1 |
| rs4657175 | 160462362 | G/T | 0.33 | 13077 | 1.74 (0.28) | 7.24×10⁻¹⁰ | 0.05 | 0.51 | NOS1AP |
| rs4391647 | 160453555 | G/A | 0.33 | 13077 | −1.74 (0.28) | 7.73×10⁻¹⁰ | 0.04 | 0.53 | NOS1AP |
| rs6692381 | 160434508 | T/C | 0.34 | 13093 | −1.71 (0.28) | 1.23×10⁻¹⁰ | 0.05 | 0.51 | NOS1AP |
| rs12123267 | 160465975 | T/C | 0.34 | 13115 | −1.70 (0.28) | 1.67×10−09 | 0.06 | 0.49 | NOS1AP |
| rs12567315 | 160433270 | A/G | 0.33 | 13202 | 1.69 (0.28) | 1.82×10−09 | 0.04 | 0.53 | NOS1AP |
| rs6667431 | 160434545 | A/G | 0.33 | 13232 | 1.69 (0.28) | 1.85×10−09 | 0.04 | 0.53 | NOS1AP |
| rs3934467 | 160449301 | T/C | 0.34 | 13170 | −1.69 (0.28) | 2.58×10−09 | 0.03 | 0.54 | NOS1AP |
| rs7534004 | 160413333 | A/G | 0.31 | 12902 | 1.73 (0.29) | 3.11×10−09 | 0.006 | 0.64 | NOS1AP |
| rs12027785 | 160447769 | A/T | 0.33 | 13203 | 1.67 (0.28) | 3.45×10−09 | 0.03 | 0.55 | NOS1AP |
| rs12116744 | 160447080 | A/G | 0.33 | 13220 | 1.67 (0.28) | 3.56×10−09 | 0.03 | 0.55 | NOS1AP |
| rs4480335 | 160440001 | C/A | 0.33 | 13104 | −1.67 (0.28) | 4.32×10−09 | 0.03 | 0.55 | NOS1AP |
| rs12029454 | 160399741 | A/G | 0.31 | 12675 | 1.73 (0.29) | 4.37×10−09 | 0.005 | 0.64 | NOS1AP |
| rs10800352 | 160439313 | G/A | 0.33 | 13272 | −1.66 (0.28) | 4.70×10−09 | 0.02 | 0.57 | NOS1AP |
| rs4306106 | 160438618 | A/G | 0.33 | 13270 | 1.66 (0.28) | 5.07×10−09 | 0.02 | 0.56 | NOS1AP |
| rs10127719 | 160422794 | C/T | 0.32 | 12746 | 1.64 (0.29) | 1.75×10−08 | 0.02 | 0.58 | NOS1AP |
All SNPs are non-coding. positions are on the forward strand from the reference sequence in NCBI build 35. SNP IDs refer to dbSNP. All SNPs are on chromosome 1. Alleles are shown as coded/noncoded. CAF refers to coded allele frequency. Neff refers to the effective sample size in the meta-analysis. defined as NxR2. and reflects the loss of power with poor imputation compared to the total sample size. Effects are milliseconds/coded allele copy with standard error within parentheses. Results of heterogeneity tests are presented as the p-value for Cochran’s Q test (Q) and the I2 statistic.
Figure 2.

Results of GWA analysis of QT interval. Each dot represents one SNP. On the y-axis is -log10 p-value and on the x-axis physical position by chromosome.
With linkage disequilibrium (LD) clustering of the 17 genome-wide significant SNPs upstream of NOS1AP, we identified two separate signals that were in very low LD (r2 < 0.05) in Yoruban (YRI) and European (CEU) HapMap samples; one signal marked by rs12143842 (minor allele frequency, MAF=0.20) which was also the strongest SNP in GWA studies in individuals of European ancestry and with a similar effect,32–34 and a second signal marked by rs4657175 (MAF=0.33, r2 to rs12143842 <0.01 in YRI). rs4657175 was also strongly correlated with an independent signal previously reported in the QTGEN study32 (rs12029454, r2=0.81 in YRI), that also reached genome-wide significance in our study. Both SNPs were directly genotyped or imputed with high accuracy in all cohorts (observed/expected variance>0.9). No effect heterogeneity was observed for rs12143842 (I2=0.32, p=0.21) and nominally significant heterogeneity was observed for rs4657175 (I2=0.51, p=0.05).
The two genome-wide significant SNPs upstream of ATP1B1 were in very strong LD (r2 in YRI: 1.0), but were not correlated with the ATP1B1 variant previously identified in the QTSCD study33, rs10919071 (r2=0.02 in CEU, monomorphic in YRI). Indeed, rs10919071, was not significantly associated with QT interval in African Americans (MAF=0.03, p=0.07) although it had a similar effect estimate in the same direction (beta coefficient=2.08 msec per minor allele). The most significant SNP at the locus in the current study, rs1320976, showed no evidence of effect heterogeneity (I2=0, p=0.71) and was directly genotyped in all cohorts, except in four of the smaller cohorts (BHS, BLSA, HABC, HANDLS).
Several additional SNPs at loci identified in GWA studies in individuals of European ancestry also reached low p-values (p<10−5) in African Americans, including SNPs near LITAF (rs8049607), PLN (rs11752626), KCNQ1 (rs231906) and KCNH2 (rs3778872), as shown in Supplementary Table 4. The same SNP near LITAF showed the most significant association at the locus in African Americans (p=7×10⁻⁷) whereas SNPs near PLN (p=2×10⁻⁶), KCNQ1 (p=2×10⁻⁶) and KCNH2 (p=3×10⁻⁶) showed strong to modest correlation with the most significant SNPs at these loci in studies of individuals with European ancestry.32–34 Results in African Americans for top SNPs at each of the 12 loci from GWA studies in individuals of European ancestry are shown in Supplementary Table 5.
Discussion
This study examined the association of genetically inferred continental ancestry and genetic polymorphisms on cardiac repolarization, as measured by the electrocardiographic QT interval, in several large cohorts of African Americans. We observed no overall evidence of association with QT interval with proportion of individual African ancestry inferred from genome-wide data. In a GWA study including 13 105 African Americans, we observed genome-wide significant associations with SNPs at two loci (NOS1AP, ATP1B1), and consistent associations (p<10−5) for SNPs at four additional loci (LITAF, PLN, KCNQ1 and KCNH2) previously associated with QT interval in individuals of European ancestry.32–34 While the p-values for association were modest, the direction of effect for the top SNP at each of the 12 previously reported loci was the same, consistent with modest power to detect mostly true underlying effects. The most significant association in NOS1AP, rs12143842, was the same SNP reported by three previous GWA studies of QT in populations of European descent.32–34 Furthermore, the variant we identified in the ATP1B1 locus was independent from the previously reported SNP,33 consistent with a second signal of association.
Genetic ancestry
In contrast to our findings, a shorter average QT interval in individuals of self-reported African-American ancestry compared to self-reported European ancestry was observed in a small subset of the ARIC study35 and in a large cohort of inpatients and outpatients from the electronic medical records of the Vanderbilt University Medical Center.36 Both studies accounted for differences in heart rate using Bazett’s formula which is explicitly discouraged in current guidelines for ECG interpretation37 and can under or overcorrect the influence of heart rate on QT interval.38 A previous study from the WHI adjusting for heart rate using linear regression did not observe differences in QT interval by self-reported ancestry.39 Our study has some advantages over these previous studies. First, our derivation of ancestry from genome-wide genetic data reduced bias resulting from the ambiguity of self-reported ancestry and allowed treatment of ancestry as a continuous variable. Second, our use of multiple population-based cohorts reduced bias resulting from ethnic differences in access and utilization of health care and allowed consistency in methodology used for ascertainment and measurement of QT interval. Third, our meta-analysis of several large cohorts allowed adequate power to detect strong or modest ancestral effects. Fourth, our use of continuous ECG measurements of QT and RR intervals allowed adjustment for heart rate using regression modelling techniques, which are well known to be more stable across the entire range of QT interval than Bazett’s formula.37 Thus, our findings from several large population cohorts that QT interval adjusted for major covariates is not associated with the proportion of African ancestry based on whole-genome SNP suggests that observations in the two previous studies might reflect chance, selection bias, measurement bias or other confounding influences that contribute to between race comparisons rather than within-race proportion genetic ancestry analyses. However, our findings do not rule out a small effect.
Common genetic variants and QT interval
GWA studies in samples of European ancestry have to date reported 12 loci associated with QT interval (Supplementary Table 5), with multiple independent signals at least at one locus (NOS1AP).32–34,40 Our findings establish with genome-wide significance that SNPs at two of these loci on chromosome 1 – ATP1B1 and two signals at NOS1AP – associate with QT interval in African Americans as well, with the strongest association for the same SNP upstream of NOS1AP conferring a similar QT prolongation as in previous studies (~3msec per minor allele copy). Furthermore, we observed low p-values (p<10−5) for SNPs at four additional loci previously reported in populations of European descent. These observations provide additional support for a similar genetic architecture for myocardial repolarization time in African Americans and Europeans.
For NOS1AP and LITAF, the identical SNP showed the strongest association, whereas top SNPs near PLN, KCNQ1 and KCNH2 were correlated with top SNPs from studies in individuals of European ancestry. In contrast, the two SNPs upstream of ATP1B1 of genome-wide significance were not correlated with the SNP from studies in individuals of European ancestry which itself was not associated with QT interval in African Americans. This finding could reflect ancestry-specific association signals at the locus or different degrees of LD across ancestries with a true, ungenotyped causal variant. In addition, this could also reflect the modest power to detect common variant associations of weak effect. The current study is similar in size to the QTGEN and QTSCD studies and it is perhaps not unexpected that different equally powered studies will identify different common variants when multiple variants exist at a locus, as has now been observed in many large-scale genetic association studies. Additional studies are needed to identify the causal variants and genes. Even though the most significant associations were observed with SNPs in potential regulatory regions upstream of NOS1AP and ATP1B1 (http://genome.ucsc.edu/ENCODE/), associations could be mediated by causal variants in longer-range LD blocks or located in regulatory motifs influencing more distant genes. However, NOS1AP and ATP1B1 are strong candidate genes; NOS1AP encodes a protein that may interact with neuronal nitric oxide synthase to accelerate cardiac repolarization by inhibition of L-type calcium channels41 whereas ATP1B1 encodes the cardiac beta-subunit of the membrane-bound Na,K-ATPase that is essential in the maintenance of the myocardial resting membrane potential, for which the alpha-subunit is targeted by digoxin.42
Potential clinical implications
QT interval is a strong determinant of arrhythmia risk. Substantial heritability estimates (h2) have been reported for QT-interval both in individuals of European and African ancestry, ranging from 0.35 in individuals of European ancestry9 to 0.41 in African Americans,10 after adjustment for basic covariates including age, sex and RR interval. A large proportion of QT variability has been shown to be explained by genetic factors, up to 40%, and about half of this was recently shown to be explained by common genetic variants.43 In the present and previous studies,15 we have shown that electrocardiographic markers of conduction and repolarization are not associated with genetic ancestry. These findings suggest that the reported ethnic differences in risk of cardiac arrhythmia may not be explained by an excess of common or rare variants influencing cardiac repolarization, but this has not been systematically tested. Indeed, in GWA studies we identify many of the same genetic associations with QT interval in individuals of African ancestry as have been found among individuals of European ancestry. Ancestral differences in arrhythmia risk might therefore be mediated by differences that do not impact electrophysiological properties of global repolarization or conduction.
Single polymorphisms have limited predictive ability individually, and are unlikely to individually have clinical utility. However, each novel locus can provide novel insights into pathophysiology and potentially therapeutic targets. Our analysis only found two genome-wide significant loci even though our sample size was similar to two previous studies in individuals of European ancestry, which identified ten loci each.32,33 Such a discrepancy could reflect the greater heterogeneity in populations of African ancestry or that admixed populations have lower effective sample sizes if locus-specific ancestry is associated with differing linkage disequilibrium patterns. Individuals of African ancestry have been shown to exhibit greater heterozygosity with more rare variants, lower proportion of common variants and shorter-range LD patterns44,45 resulting in lower coverage and power of GWA approaches compared to European-derived populations.
Strengths and limitations
In forming a consortium of large, population-based cohort studies of African American participants, our study was well powered to detect substantial ancestral and genetic effects and allowed linear modelling of ancestry on QT interval with adjustment for major covariates. Furthermore, our use of multiple African American population cohorts collected at several different locations makes our study likely to provide a broader coverage of African American populations.
Our study also has limitations that merit consideration. First, our results cannot rule out a smaller effect of ancestry on QT interval duration. Second, participants with extreme repolarization abnormalities may not have survived to the baseline visit of the cohorts studied. This limitation is likely to be of small impact, as participants of most cohorts were in the early middle age. Third, we did not have information on several clinical factors that are known to influence QT interval, including concurrent medications, myocardial ischemia, heart failure and timepoint on the day of ECG recording which potentially explain a large proportion of QT variation. Although such factors are unlikely to be determined by genotypic effects and thus unlikely to bias our observations, they could potentially dilute the effect of genetic associations.
In conclusion, our results establish that QT interval does not differ substantially by ancestry and extended the association of genetic polymorphisms at several loci including NOS1AP and ATP1B1 to populations of African ancestry. Future studies aimed at identifying mediators of excess genetic arrhythmia risk in African Americans should focus on factors other than cardiac conduction and repolarization.
Supplementary Material
Ethnic differences in cardiac arrhythmia incidence have been reported, with a particularly high incidence of ventricular fibrillation and sudden cardiac death and low incidence of atrial fibrillation in African Americans compared to Americans of European ancestry. However, it remains unknown whether such differences result from differences in inherited myocardial electrophysiological properties. Previous studies have shown inconsistent results regarding ethnic differences in electrocardiographic QT interval, a measure of myocardial repolarization time and a central pathophysiological determinant of arrhythmia known to have a strong genetic component. In the present study, we therefore studied whether African compared to European ancestry inferred from genome-wide genotype data was associated with QT interval in 12 000 African Americans from seven population-based studies. We observed no difference in duration of QT interval with African compared to European ancestry, arguing against important differences in myocardial repolarization time across these ethnicities. We also performed a genome-wide association study to identify common genetic variants associated with electrocardiographic QT interval in 13 000 African Americans from ten cohorts, and observed association with QT interval for several loci previously identified as genetic determinants of QT interval in individuals of European ancestry, including SNPs at genetic loci harboring the genes NOS1AP, ATP1B1, KCNQ1, KCNH2, LITAF and PLN.
Acknowledgments
The authors wish to acknowledge the support of the National Heart, Lung, and Blood Institute in creating the CARe resource for biomedical research used in this work and the contributions of all the research institutions, study investigators, field staff and study participants involved in this study.
Funding Sources: The following four parent studies contributed parent study data, ancillary study data, and DNA samples through the Massachusetts Institute of Technology - Broad Institute (N01-HC-65226) to create the Candidate gene Association Resource (CARe) genotype/phenotype database for wide dissemination to the biomedical research community:Atherosclerosis Risk in Communities (ARIC): The Atherosclerosis Risk in Communities Study is carried out as a collaborative study supported by National Heart, Lung, and Blood Institute contracts (HHSN268201100005C, HHSN268201100006C, HHSN268201100007C, HHSN268201100008C, HHSN268201100009C, HHSN268201100010C, HHSN268201100011C, and HHSN268201100012C); Cleveland Family Study (CFS): Case Western Reserve University (NIH HL 46380, M01RR00080); Jackson Heart Study (JHS): Jackson State University (N01-HC-95170), University of Mississippi (N01-HC-95171), Tougaloo College (N01-HC-95172) provided by the National Heart, Lung, and Blood Institute and the National Center for Minority Health and Health Disparities; Multi-Ethnic Study of Atherosclerosis (MESA): University of Washington (N01-HC-95159), Regents of the University of California (N01-HC-95160), Columbia University (N01-HC-95161), Johns Hopkins University (N01-HC-95162, N01-HC-95168), University of Minnesota (N01-HC-95163), Northwestern University (N01-HC-95164), Wake Forest University (N01-HC-95165), University of Vermont (N01-HC-95166), New England Medical Center (N01-HC-95167), Harbor-UCLA Research and Education Institute (N01-HC-95169), Cedars-Sinai Medical Center (R01-HL-071205), University of Virginia (subcontract to R01-HL-071205). The Baltimore Longitudinal Study of Aging (BLSA) was supported in part by the Intramural Research Program of the NIH, National Institute on Aging. A portion of that support was through a R&D contract with MedStar Research Institute. Bogalusa Heart Study (BHS) investigators E.N.S., S.S.M., and N.J.S. were supported in part by NIH/NCRR Grant Number UL1 RR025774 and Scripps Genomic Medicine. The BHS was supported by grants HD-061437 and HD-062783 from the National Institute of Child Health and Human Development, and AG-16592 from the National Institute on Aging. Cardiovascular Health Study (CHS): This CHS research was supported by NHLBI contracts N01-HC-85239, N01-HC-85079 through N01-HC-85086; N01-HC-35129, N01 HC-15103, N01 HC-55222, N01-HC-75150, N01-HC-45133 and NHLBI grants HL080295, HL075366, HL087652, HL085251, HL105756 with additional contribution from NINDS. Additional support was provided through AG-023629, AG-15928, AG-20098, and AG-027058 from the NIA. See also http://www.chs-nhlbi.org/pi.htm. DNA handling and genotyping was supported in part by National Center for Research Resources grant M01-RR00425 to the Cedars-Sinai General Clinical Research Center Genotyping core and National Institute of Diabetes and Digestive and Kidney Diseases grant DK063491 to the Southern California Diabetes Endocrinology Research Center. The Health, Aging, and Body Composition Study (Health ABC) was supported by NIA contracts N01AG62101, N01AG62103, and N01AG62106. The genome-wide association study was funded by NIA grant 1R01AG032098-01A1 to Wake Forest University Health Sciences and genotyping services were provided by the Center for Inherited Disease Research (CIDR). CIDR is fully funded through a federal contract from the National Institutes of Health to The Johns Hopkins University, contract number HHSN268200782096C. This research was supported in part by the Intramural Research Program of the NIH, National Institute on Aging. The Healthy Aging in Neighborhoods of Diversity across the Life Span Study (HANDLS) study was in part supported by the intramural research program of the National Institute on Aging and the National Center for Minority Health and Health Disparities, National Institutes of Health. This research was supported by the Intramural Research Program of the NIH, National Institute on Aging and the National Center on Minority Health and Health Disparities (project # Z01-AG000513 and human subjects protocol # 2009-149). Data analyses for the HANDLS study utilized the high-performance computational capabilities of the Biowulf Linux cluster at the National Institutes of Health, Bethesda, Md. (http://biowulf.nih.gov). The Women’s Health Initiative (WHI) is funded by the National Heart, Lung, and Blood Institute, National Institutes of Health, U.S. Department of Health and Human Services through contracts N01WH22110, 24152, 32100-2, 32105-6, 32108-9, 32111-13, 32115, 32118-32119, 32122, 42107-26, 42129-32, and 44221. This manuscript was prepared in collaboration with investigators of the WHI, and has been reviewed and/or approved by the Women’s Health Initiative (WHI). WHI investigators are listed at http://www.whiscience.org/publications/WHI_investigators_shortlist.pdf. Funding for WHI SHARe genotyping was provided by NHLBI Contract N02-HL-64278.
JGS was supported by the Swedish Heart Lung Foundation. CLA was supported by grant R00-HL-098458 from the National Heart, Lung, and Blood Institute. AMB was supported by grant 5T32CA009330-30 from the National Cancer Institute. This work was funded by in part by grants from the NIH/NIEHS (1-R01-ES017794, Whitsel) and the NIH/NCI (N01-WH-2-2110, North). CN-C was supported by NIH 1R01HL098283, Doris Duke Charitable Foundation Clinical Scientist Development Award and Burroughs Wellcome Fund Career Award for Medical Scientists. The funders had no role in study design, data collection and analysis, decision to publish, or preparation of the manuscript.
Footnotes
Conflict of Interest Disclosures: A number of the co-authors have grants or grant applications related to genetic studies of cardiovascular diseases and traits (Y.L, M.C.L., B.M.P, R.W., M.K.E, S.R.H., E.A.W.). B.M.P is on the data and safety board of a device trial (Zoll Lifecor) and on the steering committee of the Yale Open Data Access project.
References
- 1.Zheng ZJ, Croft JB, Giles WH, Mensah GA. Sudden cardiac death in the united states, 1989 to 1998. Circulation. 2001;104:2158–2163. doi: 10.1161/hc4301.098254. [DOI] [PubMed] [Google Scholar]
- 2.Becker LB, Han BH, Meyer PM, Wright FA, Rhodes KV, Smith DW, et al. Racial differences in the incidence of cardiac arrest and subsequent survival. N Engl J Med. 1993;329:600–606. doi: 10.1056/NEJM199308263290902. [DOI] [PubMed] [Google Scholar]
- 3.Marcus GM, Alonso A, Peralta CA, Lettre G, Vittinghoff E, Lubitz SA, et al. European ancestry as a risk factor for atrial fibrillation in African Americans. Circulation. 2010;122:2009–2015. doi: 10.1161/CIRCULATIONAHA.110.958306. [DOI] [PMC free article] [PubMed] [Google Scholar]
- 4.Noseworthy PA, Newton-Cheh C. Genetic determinants of sudden cardiac death. Circulation. 2008;118:1854–1863. doi: 10.1161/CIRCULATIONAHA.108.783654. [DOI] [PubMed] [Google Scholar]
- 5.Ackerman MJ, Tester DJ, Jones GS, Will ML, Burrow CR, Curran ME. Ethnic differences in cardiac potassium channel variants: Implications for genetic susceptibility to sudden cardiac death and genetic testing for congenital long QT syndrome. Mayo Clin Proc. 2003;78:1479–1487. doi: 10.4065/78.12.1479. [DOI] [PubMed] [Google Scholar]
- 6.Splawski I, Timothy KW, Tateyama M, Clancy CE, Malhotra A, Beggs AH, et al. Variant of SCN5A sodium channel implicated in risk of cardiac arrhythmia. Science. 2002;297:1333–1336. doi: 10.1126/science.1073569. [DOI] [PubMed] [Google Scholar]
- 7.Newton-Cheh C, Shah R. Genetic determinants of QT interval variation and sudden cardiac death. Curr Opin Genet Dev. 2007;17:213–221. doi: 10.1016/j.gde.2007.04.010. [DOI] [PubMed] [Google Scholar]
- 8.Wakili R, Voigt N, Kaab S, Dobrev D, Nattel S. Recent advances in the molecular pathophysiology of atrial fibrillation. The Journal of clinical investigation. 2011;121:2955–2968. doi: 10.1172/JCI46315. [DOI] [PMC free article] [PubMed] [Google Scholar]
- 9.Newton-Cheh C, Larson MG, Corey DC, Benjamin EJ, Herbert AG, Levy D, et al. QT interval is a heritable quantitative trait with evidence of linkage to chromosome 3 in a genome-wide linkage analysis: The Framingham Heart Study. Heart Rhythm. 2005;2:277–284. doi: 10.1016/j.hrthm.2004.11.009. [DOI] [PubMed] [Google Scholar]
- 10.Akylbekova EL, Crow RS, Johnson WD, Buxbaum SG, Njemanze S, Fox E, et al. Clinical correlates and heritability of QT interval duration in blacks: The Jackson Heart Study. Circ Arrhythm Electrophysiol. 2009;2:427–432. doi: 10.1161/CIRCEP.109.858894. [DOI] [PMC free article] [PubMed] [Google Scholar]
- 11.The ARIC Investigators. The Atherosclerosis Risk in Communities (ARIC) study: Design and objectives. Am J Epidemiol. 1989;129:687–702. [PubMed] [Google Scholar]
- 12.Redline S, Tishler PV, Tosteson TD, Williamson J, Kump K, Browner I, et al. The familial aggregation of obstructive sleep apnea. Am J Respir Crit Care Med. 1995;151:682–687. doi: 10.1164/ajrccm/151.3_Pt_1.682. [DOI] [PubMed] [Google Scholar]
- 13.Taylor HA, Jr, Wilson JG, Jones DW, Sarpong DF, Srinivasan A, Garrison RJ, et al. Toward resolution of cardiovascular health disparities in African Americans: Design and methods of the Jackson Heart Study. Ethn Dis. 2005;15:S6-4–17. [PubMed] [Google Scholar]
- 14.Bild DE, Bluemke DA, Burke GL, Detrano R, Diez Roux AV, Folsom AR, et al. Multi-ethnic study of atherosclerosis: Objectives and design. Am J Epidemiol. 2002;156:871–881. doi: 10.1093/aje/kwf113. [DOI] [PubMed] [Google Scholar]
- 15.Smith JG, Magnani JW, Palmer C, Meng YA, Soliman EZ, Musani SK, et al. Genome-wide association studies of the PR interval in African Americans. PLoS genetics. 2011;7:e1001304. doi: 10.1371/journal.pgen.1001304. [DOI] [PMC free article] [PubMed] [Google Scholar]
- 16.Berenson GS. Bogalusa Heart Study: A long-term community study of a rural biracial (black/white) population. Am J Med Sci. 2001;322:267–274. [PubMed] [Google Scholar]
- 17.Shock NW. Normal human aging: The Baltimore Longitudinal Study of Aging. 1984. [Google Scholar]
- 18.Harman SM, Metter EJ, Tobin JD, Pearson J, Blackman MR. Longitudinal effects of aging on serum total and free testosterone levels in healthy men. Baltimore Longitudinal Study of Aging. J Clin Endocrinol Metab. 2001;86:724–731. doi: 10.1210/jcem.86.2.7219. [DOI] [PubMed] [Google Scholar]
- 19.Fried LP, Borhani NO, Enright P, Furberg CD, Gardin JM, Kronmal RA, et al. The Cardiovascular Health Study: Design and rationale. Ann Epidemiol. 1991;1:263–276. doi: 10.1016/1047-2797(91)90005-w. [DOI] [PubMed] [Google Scholar]
- 20.Visser M, Simonsick EM, Colbert LH, Brach J, Rubin SM, Kritchevsky SB, et al. Type and intensity of activity and risk of mobility limitation: The mediating role of muscle parameters. J Am Geriatr Soc. 2005;53:762–770. doi: 10.1111/j.1532-5415.2005.53257.x. [DOI] [PubMed] [Google Scholar]
- 21.Cauley JA, Danielson ME, Boudreau RM, Forrest KY, Zmuda JM, Pahor M, et al. Inflammatory markers and incident fracture risk in older men and women: The Health Aging and Body Composition study. J Bone Miner Res. 2007;22:1088–1095. doi: 10.1359/jbmr.070409. [DOI] [PubMed] [Google Scholar]
- 22.Evans MK, Lepkowski JM, Powe NR, LaVeist T, Kuczmarski MF, Zonderman AB. Healthy aging in neighborhoods of diversity across the life span (HANDLS): Overcoming barriers to implementing a longitudinal, epidemiologic, urban study of health, race, and socioeconomic status. Ethn Dis. 2010;20:267–275. [PMC free article] [PubMed] [Google Scholar]
- 23.Design of the Women’s Health Initiative clinical trial and observational study. The Women’s Health Initiative study group. Control Clin Trials. 1998;19:61–109. doi: 10.1016/s0197-2456(97)00078-0. [DOI] [PubMed] [Google Scholar]
- 24.Musunuru K, Lettre G, Young T, Farlow DN, Pirruccello JP, Ejebe KG, et al. Candidate gene Association Resource (CARe): Design, methods, and proof of concept. Circ Cardiovasc Genet. 2010;3:267–75. doi: 10.1161/CIRCGENETICS.109.882696. [DOI] [PMC free article] [PubMed] [Google Scholar]
- 25.Patterson N, Hattangadi N, Lane B, Lohmueller KE, Hafler DA, Oksenberg JR, et al. Methods for high-density admixture mapping of disease genes. Am J Hum Genet. 2004;74:979–1000. doi: 10.1086/420871. [DOI] [PMC free article] [PubMed] [Google Scholar]
- 26.Tang H, Peng J, Wang P, Risch NJ. Estimation of individual admixture: Analytical and study design considerations. Genet Epidemiol. 2005;28:289–301. doi: 10.1002/gepi.20064. [DOI] [PubMed] [Google Scholar]
- 27.Pritchard JK, Stephens M, Donnelly P. Inference of population structure using multilocus genotype data. Genetics. 2000;155:945–959. doi: 10.1093/genetics/155.2.945. [DOI] [PMC free article] [PubMed] [Google Scholar]
- 28.Reich D, Patterson N, Ramesh V, De Jager PL, McDonald GJ, Tandon A, et al. Admixture mapping of an allele affecting interleukin 6 soluble receptor and interleukin 6 levels. Am J Hum Genet. 2007;80:716–26. doi: 10.1086/513206. [DOI] [PMC free article] [PubMed] [Google Scholar]
- 29.Pe’er I, Yelensky R, Altshuler D, Daly MJ. Estimation of the multiple testing burden for genomewide association studies of nearly all common variants. Genet Epidemiol. 2008;32:381–385. doi: 10.1002/gepi.20303. [DOI] [PubMed] [Google Scholar]
- 30.Cochran WG. The combination of estimates from different experiments. Biometrics. 1954;10:101–129. [Google Scholar]
- 31.Higgins JP, Thompson SG. Quantifying heterogeneity in a meta-analysis. Stat Med. 2002;21:1539–1558. doi: 10.1002/sim.1186. [DOI] [PubMed] [Google Scholar]
- 32.Newton-Cheh C, Eijgelsheim M, Rice KM, de Bakker PI, Yin X, Estrada K, et al. Common variants at ten loci influence QT interval duration in the QTGEN study. Nat Genet. 2009;41:399–406. doi: 10.1038/ng.364. [DOI] [PMC free article] [PubMed] [Google Scholar]
- 33.Pfeufer A, Sanna S, Arking DE, Muller M, Gateva V, Fuchsberger C, et al. Common variants at ten loci modulate the QT interval duration in the QTSCD study. Nat Genet. 2009;41:407–414. doi: 10.1038/ng.362. [DOI] [PMC free article] [PubMed] [Google Scholar]
- 34.Nolte IM, Wallace C, Newhouse SJ, Waggott D, Fu J, Soranzo N, et al. Common genetic variation near the phospholamban gene is associated with cardiac repolarisation: Meta-analysis of three genome-wide association studies. PLoS One. 2009;4:e6138. doi: 10.1371/journal.pone.0006138. [DOI] [PMC free article] [PubMed] [Google Scholar]
- 35.Vitelli LL, Crow RS, Shahar E, Hutchinson RG, Rautaharju PM, Folsom AR. Electrocardiographic findings in a healthy biracial population. Atherosclerosis risk in communities (ARIC) study investigators. Am J Cardiol. 1998;81:453–459. doi: 10.1016/s0002-9149(97)00937-5. [DOI] [PubMed] [Google Scholar]
- 36.Ramirez AH, Schildcrout JS, Blakemore DL, Masys DR, Pulley JM, Basford MA, et al. Modulators of normal electrocardiographic intervals identified in a large electronic medical record. Heart Rhythm. 2011;8:271–277. doi: 10.1016/j.hrthm.2010.10.034. [DOI] [PMC free article] [PubMed] [Google Scholar]
- 37.Rautaharju PM, Surawicz B, Gettes LS, Bailey JJ, Childers R, Deal BJ, et al. AHA/ACCF/HRS recommendations for the standardization and interpretation of the electrocardiogram: Part iv: The st segment, t and u waves, and the qt interval: A scientific statement from the american heart association electrocardiography and arrhythmias committee, council on clinical cardiology; the american college of cardiology foundation; and the heart rhythm society: Endorsed by the international society for computerized electrocardiology. Circulation. 2009;119:e241–250. doi: 10.1161/CIRCULATIONAHA.108.191096. [DOI] [PubMed] [Google Scholar]
- 38.Bazett HC. An analysis of the time-relations of electrocardiograms. Heart. 1920;7:353–370. [Google Scholar]
- 39.Rautaharju PM, Prineas RJ, Kadish A, Larson JC, Hsia J, Lund B. Normal standards for QT and QT subintervals derived from a large ethnically diverse population of women aged 50 to 79 years (the Women’s Health Initiative [WHI]) Am J Cardiol. 2006;97:730–737. doi: 10.1016/j.amjcard.2005.09.108. [DOI] [PubMed] [Google Scholar]
- 40.Arking DE, Pfeufer A, Post W, Kao WH, Newton-Cheh C, Ikeda M, et al. A common genetic variant in the nos1 regulator NOS1AP modulates cardiac repolarization. Nat Genet. 2006;38:644–651. doi: 10.1038/ng1790. [DOI] [PubMed] [Google Scholar]
- 41.Chang KC, Barth AS, Sasano T, Kizana E, Kashiwakura Y, Zhang Y, et al. Capon modulates cardiac repolarization via neuronal nitric oxide synthase signaling in the heart. Proc Nat Acad Sci U S A. 2008;105:4477–4482. doi: 10.1073/pnas.0709118105. [DOI] [PMC free article] [PubMed] [Google Scholar]
- 42.Schwinger RH, Bundgaard H, Muller-Ehmsen J, Kjeldsen K. The Na, K-ATPase in the failing human heart. Cardiovasc Res. 2003;57:913–920. doi: 10.1016/s0008-6363(02)00767-8. [DOI] [PubMed] [Google Scholar]
- 43.Yang J, Manolio TA, Pasquale LR, Boerwinkle E, Caporaso N, Cunningham JM, et al. Genome partitioning of genetic variation for complex traits using common snps. Nat Genet. 2011;43:519–525. doi: 10.1038/ng.823. [DOI] [PMC free article] [PubMed] [Google Scholar]
- 44.The international hapmap investigators. A haplotype map of the human genome. Nature. 2005;437:1299–1320. doi: 10.1038/nature04226. [DOI] [PMC free article] [PubMed] [Google Scholar]
- 45.Tishkoff SA, Williams SM. Genetic analysis of African populations: Human evolution and complex disease. Nat Rev Genet. 2002;3:611–621. doi: 10.1038/nrg865. [DOI] [PubMed] [Google Scholar]
Associated Data
This section collects any data citations, data availability statements, or supplementary materials included in this article.