

Abstract
Although many of the frequently used pluripotency biomarkers are glycoconjugates, a glycoconjugate-based exploration of novel cellular biomarkers has proven difficult due to technical difficulties. This study reports a unique approach for the systematic overview of all major classes of oligosaccharides in the cellular glycome. The proposed method enabled mass spectrometry–based structurally intensive analyses, both qualitatively and quantitatively, of cellular N- and O-linked glycans derived from glycoproteins, glycosaminoglycans, and glycosphingolipids, as well as free oligosaccharides of human embryonic stem cells (hESCs), induced pluripotent stem cells (hiPSCs), and various human cells derived from normal and carcinoma cells. Cellular total glycomes were found to be highly cell specific, demonstrating their utility as unique cellular descriptors. Structures of glycans of all classes specifically observed in hESCs and hiPSCs tended to be immature in general, suggesting the presence of stem cell–specific glycosylation spectra. The current analysis revealed the high similarity of the total cellular glycome between hESCs and hiPSCs, although it was suggested that hESCs are more homogeneous than hiPSCs from a glycomic standpoint. Notably, this study enabled a priori identification of known pluripotency biomarkers such as SSEA-3, -4, and -5 and Tra-1–60/81, as well as a panel of glycans specifically expressed by hESCs and hiPSCs.
Keywords: omics-based biomarker discovery, stemness, interglycomic correlations, glycoblotting, β-elimination in the presence of pyrazolone
Human embryonic stem cells (hESCs) derived from the inner cell mass of the blastocyst and, more recently, induced pluripotent stem cells (hiPSCs) reprogrammed from somatic cells share the property of indefinite growth while maintaining pluripotency (1, 2). Extensive research has been conducted with these cells to develop disease models, methods for drug screening, and ultimately, regenerative therapies. Because stem cells are currently defined by a combination of physical, phenotypic, and functional properties, the identification of novel cell surface markers is highly advantageous for the rapid characterization and isolation of different stem cell populations.
Many of the frequently used pluripotency biomarkers, including stage-specific embryonic antigens (SSEA-3, -4, and -5) and tumor-rejection antigens (Tra-1–60 and Tra-1–81), are glycoconjugates (3, 4). These glycomarkers have been identified following the rather fortuitous development of specific anti-glycoconjugate antibodies. A glycoconjugate-based approach would therefore be expected to streamline the discovery process for novel cellular biomarkers. However, such an approach has proven difficult due to technical difficulties associated with the analysis of various types of cellular glycomes, given the entire repertoire of glycoconjugate-associated sugars in cells and tissues. Glycoconjugates represent the most structurally and functionally diverse class of molecules in nature, ranging from relatively simple nuclear or cytosolic glycoproteins with dynamic monosaccharide modifications (O-GlcNAcylation) to extraordinarily complex N- and O-linked glycans [e.g., glycans derived from glycoproteins, glycosaminoglycans (GAGs), and glycosphingolipids (GSLs); reviewed in refs. 5 and 6]. Considering that cell surfaces are coated with a variety of intricately arranged glycoconjugates, and some carbohydrate epitopes (e.g., Lewisx, also known as SSEA-1) may be constituents of different glycoconjugates (5), a systematic overview of all major classes of oligosaccharides within the cellular glycome would be most opportune for the identification of novel stem cell biomarkers.
To date, total cellular glycosylation analyses are scarce. Wearne et al. (7) used fluorescently labeled lectins to classify structural glycosylation motifs on the stem cell surface, and the utility of lectin arrays for cell characterization has recently been illustrated (8, 9). However, only a limited number of lectins and glycan-specific antibodies are in fact available, and it is often difficult to discriminate between different glycoconjugate species by these methods. Furthermore, although analysis of the total cellular glycome has been addressed in pioneering mass spectrometric work (10, 11), no attempts have yet been made to determine all major classes of glycans within a cell or the relative concentration of each type of glycan present.
This study now provides an integrated analytical technique to visualize the entire complement of sugars in the cellular glycome, including N-glycans, O-glycans, glycosaminoglycans, GSL-associated glycans, and free oligosaccharides (FOSs). The usefulness of this approach was validated by clarifying intra- and interglycomic correlations (correlations within and between each individual glycome of various glycoconjugates) under conditions of a perturbed glycan synthetic pathway. This approach was finally applied to delineate the glycomic profiles of hESCs and hiPSCs, as well as various human cells derived from normal and carcinoma cells. The cellular glycomic profiles were revealed in their entirety, allowing the accurate identification of known pluripotency biomarkers and the discovery of unique pluripotency biomarker candidates.
Results
Systematic Survey of Cellular Glycomes.
The general analytical scheme that was used in this study is shown in SI Appendix, Fig. S1. Glycans can be regarded as a class of organic compounds that have a hemiacetal group at the reducing terminal following their enzymatic release from proteins and lipids. GSL glycans were released by digestion with EGCases I and II (12), and N-glycans were released by digestion with PNGase F. GAGs are highly complicated molecules, and therefore their constituent repeating disaccharides were analyzed. These repeating disaccharides can be generated on enzymatic depolymerization with chondroitinase, heparitinase, hyaluronidase, etc. To maximize the deglycosylation/depolymerization efficiency, conditions for sample preparation, including extraction of glycoconjugates and enzymatic liberation of glycans, were optimized (SI Appendix, Fig. S2).
Hemiacetal is a masked aldehyde, and because aldehydes are rare functionalities in cells, GSL/N-glycans and GAGs disaccharides can be selectively enriched by chemoselective ligation on reaction of the aldehyde with reagents bearing hydrazide functional groups as we previously described (13). Any impurities can then be thoroughly washed away, followed by subjection of the reagent-bound glycans to on-bead methyl esterification to render sialylated oligosaccharides that are the chemical equivalent of neutral oligosaccharides (14). The reagent-bound glycans are finally recovered by an imine exchange reaction, which not only releases the glycans but also allows for their recovery as derivatives of aoWR, a highly sensitive tag for MALDI-TOF (15), or 2-AB for chromatographic analysis (16) (SI Appendix, Fig. S1A). Fairly good reproducibility of the glycomic analysis was demonstrated, as shown in SI Appendix, Fig. S3.
As noted above, GSL/N-glycans and GAGs were released from cellular components by endoglycosidases. Because no analogous endoglycosidase is known for O-glycans, we established a unique technique to release and label O-glycans from glycoproteins by β-elimination in the presence of pyrazolone analogs (BEP; SI Appendix, Fig. S1B) combined with sequential solid-phase extraction (SPE). The O-glycans released during BEP are recovered as bis-pyrazolone derivatives, without any detectable side reaction (17).
The protocols established to streamline individual glycomic analytical procedures for N- and O-linked glycans, GAGs, GSL glycans, and FOSs are summarized in Fig. 1. One million cells are enough for the analysis of each class of glycome, and the required amount can be reduced down to 105 cells or even fewer. Cell pellets were first divided into two groups: one for the analysis of N- and O-glycans and FOSs and the other for the analysis of GSLs and GAGs. Note that the inherent presence of intracellular FOSs can potentially interfere with glycomic analyses for all types of glycoconjugates. The structures of FOSs are identical or very similar to those of N-glycans because FOSs are generated as the result of N-glycoproteins catabolism. The latter occurs via two distinct metabolic pathways: the endoplasmic reticulum–associated degradation (ERAD) of misfolded, newly synthesized N-glycoproteins and the mature N-glycoprotein turnover pathway. Therefore, it is indispensable to separate FOSs from glycoconjugates before analysis or to subtract the amount of background FOSs from the final analytical readout.
Fig. 1.

Streamlined protocol for the analysis of cellular N- and O-linked glycans derived from glycoproteins, GSL glycans, GAGs, and FOSs.
Apart from the technical issues, analysis of FOSs may help to characterize/describe cells. FOSs reportedly increase under conditions of endoplasmic reticulum (ER) stress (18), which is in turn linked to various disease states (19). As shown in SI Appendix, Fig. S4, FOSs were effectively separated from glycoproteins by ethanol precipitation before PNGase F digestion or BEP. FOSs were selectively enriched in the supernatant following ethanol precipitation of the solubilized, reduced, and alkylated cell lysates, whereas the vast majority of the glycoproteins were recovered from the pellet.
Absolute quantification of each glycoconjugate was accomplished by comparative analyses between the areas of the MS signals (or HPLC signal in the case of GAGs) derived from each glycan and the internal standard. The basis of the quantitative analysis of glycans on MALDI-TOF MS relies on the previous observations that oligosaccharides with masses greater than ∼1,000 Da exhibited similar signal strengths, irrespective of structure (13, 20) and that methyl esterification of sialic acid renders sialylated oligosaccharides chemically equivalent to neutral oligosaccharides and allows simultaneous analysis of neutral and sialylated oligosaccharides (14, 21). Some of the GSL-glycans, FOSs, and O-glycans analyzed in this study have molecular masses less than 1,000 Da, and therefore the quantitative values obtained for these glycans may be underestimated, which is an issue to be addressed in the future. Absolute quantitation allowed for determination of the relative concentration of each glycan type.
The usefulness of total glycomic analysis for the characterization/description of cells was validated using the WT CHO cell line and its lectin-resistant mutants (Lec1 and Lec8) (SI Appendix, Results). Perturbed glycan synthetic pathways, such as those observed in the mutant CHO cells, can cause unexpected glycan expression profiles, which may be difficult to predict in the absence of glycomics.
Elucidation of the Total Glycomes of hESC, hiPSC, and Other Human Cell Lines.
The methodology described above was applied to delineate the entire glycomes of four hESC lines [ES1, 3, 4, and 5 (22)] and five hiPSC lines [HiPS-RIKEN-1A, 2A and 12A derived from human umbilical cord, or iPS1A, 2A and 12A; HiPS-RIKEN-3A (iPS3A) derived from human decidual tissue; and HiPS-RIKEN-11A (iPS11A) derived from amniotic tissue] (23). In addition, the glycomes of six human somatic carcinoma cell lines (Hep G2, A549, KLM-11, Caco-2, HeLa, and HL60), one immortalized but not yet malignant cell line (HEK293), one human embryonic carcinoma (EC) cell line (NEC8), and one normal human cell line (MRC-5) were analyzed as references.
Representative MS spectra and chromatogram showing the glycomic profiles of iPS3A are shown in Fig. 2 and SI Appendix, Fig. S5. In total, we quantitatively detected ∼200 glycans (65 GSL glycans, 93 N-glycans, 16 O-glycans, 15 FOSs, and 17 GAG disaccharides; SI Appendix, Table S2). The total glycomic profile of each cell line is illustrated based on the absolute amount of each type of glycan and each glycan substructure, as shown in Fig. 3. Pie charts at the vertices of the pentagon correspond to the glycan expression profiles of N-glycans, FOSs, GAGs, GSL glycans, and O-glycans. The size of each circle and its constituent colors reflect the absolute glycan quantity (pmol/100 µg protein) and the glycan substructures, respectively. As such, the relative abundance of each class of glycoconjugate and its diversity is obvious at a glance by the pentagonal cellular glycomic notations. This analysis clearly demonstrated that these glycans were highly cell type specific in terms of both the expression amount and the composition. As shown in SI Appendix, Figs. S6 and S7, the four ES cells gave quite similar total glycomic patterns, with a high degree of correlation [r (correlation coefficient) = 0.933–0.994, mean = 0.963]. The pentagonal glycomic profiles of the hiPSCs also gave similar patterns but with a lower degree of correlation (r = 0.804–0.989, mean = 0.921). From a glycomic point of view, these results suggest that hESCs are more homogeneous than hiPSCs. Regarding the comparison of the total glycomic profiles between hESCs and hiPSCs, a fairly high degree of correlation was observed (r = 0.743–0.970, mean = 0.896). Total glycomic profiles of some of the hiPSCs were quite similar to those of the hESCs (e.g., ES1 vs. iPS1A, r = 0.97). It is worth noting that ES5, iPS2A, and iPS12A tended to be contaminated with differentiating cells, which may explain the relatively low correlation coefficient values observed for these cell lines compared with the other cell lines (SI Appendix, Fig. S7).
Fig. 2.

Representative MS spectra and chromatograms showing the glycomic profiles obtained for induced pluripotent stem cell line (iPS3A): (A) N-glycans, (B) GSL glycans, (C) O-glycans, (D) FOSs, and (E) GAGs. Estimated structures are shown. Green circle, Man; yellow circle, Gal; blue square, GlcNAc; yellow square, GalNAc; red triangle, Fuc; purple diamond, Neu5Ac; open diamond, Neu5Gc.
Fig. 3.
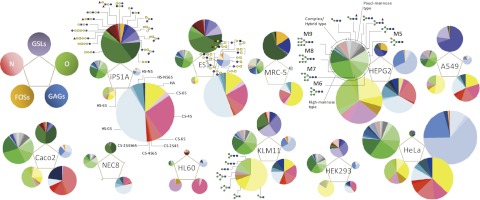
Comprehensive glycomic profiles for various human cells. Pentagonal cellular glycomic notations showing the entire glycome of hESC lines (ES1); hiPSC lines (iPS1A derived from human umbilical cord); six human somatic carcinoma cell lines (Hep G2, A549, KLM-11, Caco-2, HeLa, and HL60); one immortalized but not yet malignant cell line (HEK293); one human embryonic carcinoma cell line (NEC8); and one normal human cell line (MRC-5, lung, diploid). Pie charts at the vertices of the pentagon correspond to the glycan expression profiles of N-glycans, FOSs, GAGs, GSL glycans, and O-glycans. The size of each circle and its constituent colors reflect the absolute quantity of glycans (pmol/100 µg protein) and the glycan substructures, respectively. The size of each circle corresponding to FOS content is enlarged by 40-fold (area ratio). Estimated structures are shown. Detailed figure legends are shown in SI Appendix, Fig. S6.
Fig. 3 and SI Appendix, Fig. S6 show that the hESCs and iPSCs were both characterized by their substantially high abundance of GAG disaccharides and GSL glycans compared with the other cells. The absolute amounts of N-glycans and O-glycans of hESCs and hiPSCs were comparable among all cell types, although the expression levels of individual glycans within these glycomes varied from cell type to cell type. FOS levels expressed by the hESCs and hiPSCs were fairly low relative to the other cells. As shown in SI Appendix, Fig. S8, the ratio of total cellular FOSs to total cellular N-glycans differed among carcinoma cells, hESCs, and hiPSCs. The [FOS]/[N-glycan] values were significantly higher in epithelial carcinoma cells compared with hESCs and hiPSCs. This observation may be explained by the fact that cancerous cells often display elevated protein synthesis, turnover, and metabolism, as well as proteasome activity (24–26).
The compositions of the glycans making up each class of glycome often differed markedly depending on the cell type. In the case of N-glycans, high mannose–type glycans were commonly the major components for all cells analyzed (shown in shades of green in the pie charts for the N-glycans; Fig. 3) except for MRC-5, a normal human cell line. In contrast, the levels of pauci-mannose glycans were significantly lower in hESCs and hiPSCs (shown in shades of gray in the pie charts for the N-glycans; Fig. 3) relative to the other cell types. The composition of the complex/hybrid type glycans also differed significantly among the cells (SI Appendix, Fig. S9). Regarding GSL glycans, domination of globo-series GSL glycans was observed for hESCs and hiPSCs. SSEA-3 (GSL-15), SSEA-4 (GSL-17), and SSEA-1/5 (GSL-20) were all observed in hESCs and hiPSCs. As shown in SI Appendix, Fig. S10, we confirmed that the expression of SSEA-1 was almost negligible in hESCs and hiPSCs by immunofluorescence and flow cytometry analyses, indicating that the detected GSL-20 is not Gal(β1–4)[Fuc(α1–3)]GlcNAc(β1–3)Gal(β1–4)Glc (SSEA-1) but is instead Fuc(α1–2)Gal(β1–3/4)GlcNAc(β1–3)Gal(β1–4)Glc (SSEA-5), a recently discovered pluripotency biomarker (27). Note that SSEA-5 was originally identified by the fortuitous development of its specific antibody, whereas our approach does not rely on antibodies. Regarding GAG disaccharides, the relative amounts of chondroitin sulfate/dermatan sulfate (CS/DS) and heparan sulfate (HS) disaccharides were comparable in hESCs and hiPSCs, wheresa their levels varied substantially in the other cells. The vast majority of the HS disaccharides were not sulfated in hESCs and hiPSCs, whereas the predominant CS species was the 4-monosulfated disaccharide. O-glycans profiles of hESCs and hiPSCs were characteristic in their abundance of extended core 1 or core 2 O-glycans terminated with β1–3 galactose structures.
Identification of Pluripotency Biomarker Candidates.
To identify pluripotency biomarker candidates, the expression profiles were statistically compared between stem cells (hESCs and hiPSCs) and nonstem cells, and various unique features were observed that appeared to be characteristic of the former. As shown in SI Appendix, Figs. S11 and S12, expression of a number of glycans was found to be characteristic of stem cells. Care must be paid about the contamination of glycans originating from mouse embryonic fibroblasts (MEFs), which are feeder cells used for the culture of hESCs and hiPSCs. This concern was especially true for N-glycans because many N-glycans whose expressions are significantly highly in stem cells apparently originated from MEFs (SI Appendix, Figs. S11 and S13).
After eliminating such glycans from the list (glycans shown in italic in SI Appendix, Table S2), hierarchical clustering analysis based on the quantitative glycomic profiles of N-glycans, FOSs, GAGs, GSL glycans, and O-glycans was performed. As shown in Fig. 4, the hierarchical clustering analysis yielded a plausible classification scheme for human cells. hESCs and hiPSCs were clustered into a single clade, indicating the close similarity among the various human cell types analyzed in this study. Within this clade, hESC5, hiPS-2A, and hiPS-12A, which were contaminated with substantial numbers of differentiating cells, were further subdivided into additional groups. NEC8 was located within the closest proximity to the stem cells, which appears to be reasonable considering that NEC8 cells have characteristics similar to EC cells, which are capable of pluripotent differentiation (28). The carcinoma cells were clustered into a single clade, although their mutual correlations were generally low. Normal cells (MRC5) and floating cells (HL60) fell into two distinct groups.
Fig. 4.

Classification of cells and glycans by total cellular glycomics based on unsupervised cluster analysis. The absolute amount of each glycan (pmol/100 μg protein) was analyzed by using Cluster 3.0 software. The heat map with clustering was acquired by using Java Treeview software. The region shown in red indicates a clade where SSEA-3, -4, and -5 and the Tra-1–60 and Tra-1–81 epitopes are clustered. Glycans are marked with blue based on the P value when the expressed amount was compared between stem cells (hESCs and hiPSCs) and nonstem cells.
Regarding the classification of the glycan side, SSEA-3, -4, and -5 and Globo H (GSL-15, -17, -20, and -16, respectively), which are known to be pluripotent GSL glycan biomarkers, were clustered into a single clade among a total of ∼200 glycans (Fig. 4, a clade shown in red). An additional four glycans [three O-glycans (O-7, 1-0, and -14) and one N-glycan (N-80)] were also clustered into this clade. Natunen et al. (29) recently reported that the specific binding of Tra-1–60 and Tra-1–81 occurs to glycans containing a tetrasaccharide structure, where type 1 lactosamine is β1,3-linked to type 2 lactosamine. This group in fact detected Hex3HexNAc3, which proven to possess β1–3-linked Gal at the nonreducing end and was tentatively assigned to be a core 2 branched O-glycan with Galβ1–3GlcNAcβ1–3Galβ1–4GlcNAcβ1–6(Galβ1–3)GalNAc sequences. In this study, we also confirmed the presence of β1–3-linked Gal at the nonreducing end of the O-glycan having a composition of Hex3HexNAc3 (SI Appendix, Fig. S12B, i), which is most likely the same O-glycan as Natunen et al. identified as the Tra-1 epitope. Likewise, an O-glycan having a composition of Hex2HexNAc2 was also proven to possess β1–3-linked Gal at the nonreducing end. The N-glycan, N-80 (Hex6HexNAc5Fuc2NeuAc1), may contain one or more SSEA-5 epitopes. However, this requires further elucidation.
Glycans clustered into adjacent clades were also found to be highly stem cell specific. In summary, the following N-glycans were significantly enhanced in hESCs/hiPSCs: (i) multiply fucosylated type (N-30, -80, -65), (ii) neutral triantennary type (N-41), and (iii) bisect and/or LacdiNAc type (N-22, N-42). Expression of the following GSL glycans was also significantly enhanced in stem cells compared with nonstem cells: Gb5 (SSEA-3), sialyl-Gb5 (SSEA-4), fucosyl Lc4 (SSEA-5), difucosyl-(n)Lc4, (n)Lc5, (n)Lc4, Gb4, GM1(NeuGc), and Lc3 (or aGM2) (P < 0.01). It may be worth mentioning that extended types of (neo)lacto-series glycans such as GSL-49, GSL-40, and GSL-57 were expressed at significantly high levels in carcinoma cells vs. the other types of cells analyzed.
A number of GAGs, including nonsulfated chondroitin (CS-0S), nonsulfated heparan (HS-0S), 2- and/or 4-sulfated chondroitin (CS-2S4S, CS-2S, and CS-4S), and N- or 6-sulfated heparan (HS-6S and HS-NS) were found at significantly higher levels in stem cells vs. nonstem cells (P < 0.01). This observation suggests the presence of stem cell–specific sulfation spectra. Regarding O-glycans, O-2, -4, -7, -10, and -14 were significantly high in stem cells compared with nonstem cells (P < 0.01). They appear to share a common structural feature (extended core 1 or core 2 O-glycans terminated with β1–3 galactose). O-14 (Hex3HexNAc3), considered to be a Tra-1–60 and Tra-1–81 epitope, was the most statistically significant (lowest P value) discriminator between stem cells and nonstem cells among all glycans (P = 0.00013).
Discussion
A concept and methodology of total cellular glycomics, a systematic overview of the major classes of cellular glycome, were proposed and established. The current study accomplished the comprehensive and streamlined analyses of N-glycans and O-glycans of glycoproteins, GAGs, GSLs, and FOSs. Limitations include the inability to analyze keratan sulfates (technique not yet established) and cerebrosides (inherent enzyme specificities of EGCases used). Analyses of monosaccharides (e.g., GlcNAc, GalNAc) were also not performed because of low mass interference peaks. Unlike sialic acids, both sulfate and phosphate are not neutralized by the methyl esterification protocol used, which may complicate the detection of such species. In addition, some of the larger N-glycans previously shown to be present in HL60, which uses permethylation of N-glycans before MS analysis (30, 31), were not detected in this study. This difference may be explained by the fact that larger N-glycans such as polylactosamine-extended glycans are more frequently observed on permethylation of glycans. The vision shown in this study may stimulate a more aggressive development of more sophisticated analysis to accomplish the global glycomics analysis. As part of the effort to improve the analytical methodology, method development for glycoblotting-assisted permethylation analysis is currently in progress in our laboratory to combine the advantages of both methods; high purification power and high sample throughput (in a 96-well format) advantages achieved by glycoblotting and the abilities of detecting larger glycans, sulfated and phosphorylated glycans, as well as facilitating the MS/MS analysis by leading predictable fragmentation on permethylation (32, 33).
Total glycomic analyses of the WT CHO cell line and its lectin-resistant mutants (Lec1 and Lec 8) demonstrated their feasibility as cellular descriptors because the mutants accurately delineated the glycomic profiles predicted from known deficiencies in glycosylation processing (SI Appendix, Results). More importantly, this study provided previously unknown information that would not be available in the absence of glycomic analyses. Notably, transgenic mice and KO mice for various glycogens have no apparent phenotype (34), suggesting that compensation by alternate glycogene(s) may occur. Total glycomics are anticipated to provide a straightforward measure to unveil the network of intra- and interglycomic correlations in such cases under both normal and pathological conditions.
In this study, we report to delineate a comprehensive glycomic analysis of the major glycoconjugates of hESCs and hiPSCs. Recently, several pioneering studies have started to clarify the individual glycomes of hESCs and hiPSCs. For example, MS-based structurally intensive studies of the hESC N-glycome have been recently documented (35, 36). Furthermore, Liang et al. (37) reported the total GSL glycan profiles of two hESC lines. However, there are no previous structurally intensive glycomic studies regarding hESC GAGs or FOSs to the best of the authors’ knowledge. Moreover, the glycosylation of hiPSC-derived cellular components had not been studied before the current work, regardless of the type of glycoconjugate.
The N-glycomic profiles observed in this study mostly agree with previous observations. However, analysis of the total glycome of various human cells allowed an in-depth comparison of their glycomic profiles. This comparison highlighted the unique glycosylation characteristics of each cell type and also identified a panel of unique pluripotency biomarkers. Recently, an unusual abundance of high-mannose glycans in hESCs was reported (36). However, we observed that high mannose–type glycans were commonly the major components of not only stem cells but also carcinoma cells. We instead identified various structural feature of N-glycans (e.g., multiply fucosylated type, bisect, and/or LacdiNAc type) that appeared to be associated with stemness. Glycomic analyses of hESC-derived GSL glycans were also consistent with previously reported observations (37). However, because our analysis focused on glycan moieties following their release from lipids by EGCases, we eliminated the complexity associated with lipid heterogeneity. Furthermore, we substantially improved detection sensitivity by glycoblotting and subsequent aoWR (an MS-friendly tag) derivatization, thus enabling the detection of low-abundance GSL glycans.
It should be emphasized that absolute quantitation rather than relative quantitation allowed direct comparison of the expressed amounts of glycans originating from different types of glycoconjugates. As shown in Fig. 4, glycans derived from various classes of glycoconjugates were successfully categorized into a single clade on the dendrogram, which assisted in the unveiling of interglycome correlations. Indeed, well-known pluripotency biomarkers such as SSEA-3, -4, and -5 (GSL glycans), as well as the Tra-1–60 and Tra-1–81 epitopes (O-glycans), were clustered into a single clade. In other words, these glycans were identified as pluripotency biomarkers without any prior knowledge, demonstrating the power of the total glycomic approach for the discovery of cellular biomarkers.
That we could precisely identify known biomarkers by an omics-based approach also highlights the usefulness of the glycoconjugate-focused strategy, given that global proteomic studies often fail to identify known biomarkers because their expression levels are too low to be detected by MS (38). This observation may suggest that glyco-biomarkers are more abundant than protein biomarkers because the same structural glycan can attach to several different proteins, thereby increasing the total concentration of the glycan and simplifying the detection of glyco-biomarkers vs. protein biomarkers. However, it is also possible that glycoproteins with a specific glycosylation profile (both in terms of structure and glycan attachment site) would provide a more specific biomarker than glycans alone. Now that panels of stem cell–specific N- and O-glycans, as well as GAG candidates, have been identified, our next focus will be directed toward the identification of proteins that carry such marker glycans. This possibility is true also for GSL glycans. A given combination of glycan and lipid moieties may also allow for the identification of even more specific and functional biomarkers. The validity of the identified pluripotency biomarker candidates should also be validated by other means including flow cytometry experiments.
The advantage of the total cellular glycome rather than individual glycomes for the description/characterization of cells is evident when the correlation matrix created by quantitative total glycomics is compared with those created by analysis of the N-glycome, O-glycome, glycosaminoglycome, GSL glycan glycome, and FOS glycome (SI Appendix, Fig. S7). Although each individual glycome could discriminate stem cells from other cells to a certain extent, the discrimination power was most efficient when quantitative information regarding the glycome in its entirety was taken into account. Structures of glycans of all classes specifically observed in hESCs and hiPSCs tended to be immature in general, suggesting the presence of stem cell–specific glycosylation spectra. The current analysis revealed the high similarity of the total cellular glycome between hESCs and hiPSCs, although it was suggested that hESCs are more homogeneous than hiPSCs from a glycomic standpoint.
In conclusion, this study set forth a concept of total cellular glycomics (including the analysis of N- and O-linked glycans derived from glycoproteins, GSL glycans, GAGs, and FOSs) to describe/characterize cells and established techniques to enable it. By using the techniques described herein, the glycomes of various human stem and nonstem cells were clarified. Cellular glycomes were found to be highly cell type specific and capable of functioning as unique cellular descriptors as demonstrated by the identification of known pluripotency biomarkers and novel candidates. We anticipate that total cellular glycomics will facilitate the description of numerous cell types, as well as the discrimination between normal and pathological conditions. A panoramic view of the total glycome also allows the investigator to decipher intra- and interglycomic correlations, thus opening a new avenue in systems biology glycomics.
Materials and Methods
Cells.
The following cell lines were provided by RIKEN Bio Resource Center in Japan: human promyeloleukemic cells (HL60), human cervical carcinoma cells (HeLa), human embryonic carcinoma (EC) cells (NEC8), human lung carcinoma cells (A549), human pancreatic cancer cells (KLM-1), human colon carcinoma cells (Caco-2), human hepatocyte carcinoma cells (HepG2), human embryonic kidney cells (HEK293), and normal embryonic lung fibroblasts (MRC-5). Human ES cells (KhES1, 3, 4, and 5) and iPS cells [HiPS-RIKEN-1A, -2A, and -12A derived from human umbilical cord, or iPS1A, 2A, and 12A; HiPS-RIKEN-3A (iPS3A) derived from human decidual tissue, and HiPS-RIKEN-11A (iPS11A) derived from amniotic tissue] were maintained in an undifferentiated state in the presence of MEFs. The culture procedures and materials are provided in SI Appendix, Materials and Methods.
Extraction of (Glyco)Proteins and FOSs.
For N-glycan and FOS analyses, cell pellets were homogenized in 100 mM Tris-acetate buffer supplemented with 2% SDS as a surfactant. In the presence of Benzonase Nuclease, the reductive alkylation was performed. Then, ethanol precipitation was carried out. Detailed procedures and materials are provided in SI Appendix, Materials and Methods.
Extraction of GSLs and GAGs.
The streamlined GAG and GSL extraction procedures were essentially the same as previously described (12,16). Detailed procedures and materials are provided in SI Appendix, Materials and Methods.
Glycoblotting.
N-glycans, FOSs, and GSL glycans were subjected to glycoblotting as previously described (13), with minor modifications. Detailed procedures and materials are provided in SI Appendix, Materials and Methods.
Cellular O-Glycomic Analysis by BEP.
The extracted cellular (glyco)proteins were subjected to BEP as previously described (17), with modifications. Detailed procedures and materials are provided in SI Appendix, Materials and Methods.
MALDI-TOF MS Analysis.
Purified N-glycans, O-glycans, FOSs, and GSL glycan solutions were mixed with 2,5-dihydrobenzoic acid solution (10 mg/mL in 30% acetonitrile) and subsequently subjected to MALDI-TOF MS analysis. Detailed procedures and materials are provided in SI Appendix, Materials and Methods.
Supplementary Material
Acknowledgments
We thank Ms. N. Sekine and Ms. A. Ito for administrative assistance. This work was supported in part by the Special Coordination Funds for Promoting Science and Technology from the Ministry of Education, Culture, Sports, Science and Technology of Japan. This study was partially supported by a grant from the Hoan-sya Foundation.
Footnotes
The authors declare no conflict of interest.
This article is a PNAS Direct Submission.
This article contains supporting information online at www.pnas.org/lookup/suppl/doi:10.1073/pnas.1214233110/-/DCSupplemental.
References
- 1.Thomson JA, et al. Embryonic stem cell lines derived from human blastocysts. Science. 1998;282(5391):1145–1147. doi: 10.1126/science.282.5391.1145. [DOI] [PubMed] [Google Scholar]
- 2.Takahashi K, et al. Induction of pluripotent stem cells from adult human fibroblasts by defined factors. Cell. 2007;131(5):861–872. doi: 10.1016/j.cell.2007.11.019. [DOI] [PubMed] [Google Scholar]
- 3.Kannagi R, et al. Stage-specific embryonic antigens (SSEA-3 and -4) are epitopes of a unique globo-series ganglioside isolated from human teratocarcinoma cells. EMBO J. 1983;2(12):2355–2361. doi: 10.1002/j.1460-2075.1983.tb01746.x. [DOI] [PMC free article] [PubMed] [Google Scholar]
- 4.Lee JB, et al. Comparative characteristics of three human embryonic stem cell lines. Mol Cells. 2005;19(1):31–38. [PubMed] [Google Scholar]
- 5.Varki A, et al. Essentials of Glycobiology. 2nd Ed. Cold Spring Harbor, New York: Cold Spring Harbor Laboratory Press; 2009. [PubMed] [Google Scholar]
- 6.Lanctot PM, Gage FH, Varki AP. The glycans of stem cells. Curr Opin Chem Biol. 2007;11(4):373–380. doi: 10.1016/j.cbpa.2007.05.032. [DOI] [PMC free article] [PubMed] [Google Scholar]
- 7.Wearne KA, Winter HC, O’Shea K, Goldstein IJ. Use of lectins for probing differentiated human embryonic stem cells for carbohydrates. Glycobiology. 2006;16(10):981–990. doi: 10.1093/glycob/cwl019. [DOI] [PubMed] [Google Scholar]
- 8.Tateno H, et al. Glycome diagnosis of human induced pluripotent stem cells using lectin microarray. J Biol Chem. 2011;286(23):20345–20353. doi: 10.1074/jbc.M111.231274. [DOI] [PMC free article] [PubMed] [Google Scholar]
- 9.Toyoda M, et al. Lectin microarray analysis of pluripotent and multipotent stem cells. Genes Cells. 2011;16(1):1–11. doi: 10.1111/j.1365-2443.2010.01459.x. [DOI] [PubMed] [Google Scholar]
- 10.Parry S, et al. Integrated mass spectrometric strategy for characterizing the glycans from glycosphingolipids and glycoproteins: Direct identification of sialyl Le(x) in mice. Glycobiology. 2007;17(6):646–654. doi: 10.1093/glycob/cwm024. [DOI] [PubMed] [Google Scholar]
- 11.Babu P, et al. Structural characterisation of neutrophil glycans by ultra sensitive mass spectrometric glycomics methodology. Glycoconj J. 2009;26(8):975–986. doi: 10.1007/s10719-008-9146-4. [DOI] [PMC free article] [PubMed] [Google Scholar]
- 12.Fujitani N, et al. Qualitative and quantitative cellular glycomics of glycosphingolipids based on rhodococcal endoglycosylceramidase-assisted glycan cleavage, glycoblotting-assisted sample preparation, and matrix-assisted laser desorption ionization tandem time-of-flight mass spectrometry analysis. J Biol Chem. 2011;286(48):41669–41679. doi: 10.1074/jbc.M111.301796. [DOI] [PMC free article] [PubMed] [Google Scholar]
- 13.Furukawa J, et al. Comprehensive approach to structural and functional glycomics based on chemoselective glycoblotting and sequential tag conversion. Anal Chem. 2008;80(4):1094–1101. doi: 10.1021/ac702124d. [DOI] [PubMed] [Google Scholar]
- 14.Miura Y, Shinohara Y, Furukawa J, Nagahori N, Nishimura S. Rapid and simple solid-phase esterification of sialic acid residues for quantitative glycomics by mass spectrometry. Chemistry. 2007;13(17):4797–4804. doi: 10.1002/chem.200601872. [DOI] [PubMed] [Google Scholar]
- 15.Uematsu R, et al. High throughput quantitative glycomics and glycoform-focused proteomics of murine dermis and epidermis. Mol Cell Proteomics. 2005;4(12):1977–1989. doi: 10.1074/mcp.M500203-MCP200. [DOI] [PubMed] [Google Scholar]
- 16.Takegawa Y, et al. Simultaneous analysis of heparan sulfate, chondroitin/dermatan sulfates, and hyaluronan disaccharides by glycoblotting-assisted sample preparation followed by single-step zwitter-ionic-hydrophilic interaction chromatography. Anal Chem. 2011;83(24):9443–9449. doi: 10.1021/ac2021079. [DOI] [PubMed] [Google Scholar]
- 17.Furukawa J, et al. A versatile method for analysis of serine/threonine posttranslational modifications by β-elimination in the presence of pyrazolone analogues. Anal Chem. 2011;83(23):9060–9067. doi: 10.1021/ac2019848. [DOI] [PubMed] [Google Scholar]
- 18.Hirayama H, Seino J, Kitajima T, Jigami Y, Suzuki T. Free oligosaccharides to monitor glycoprotein endoplasmic reticulum-associated degradation in Saccharomyces cerevisiae. J Biol Chem. 2010;285(16):12390–12404. doi: 10.1074/jbc.M109.082081. [DOI] [PMC free article] [PubMed] [Google Scholar]
- 19.Yoshida H. ER stress and diseases. FEBS J. 2007;274(3):630–658. doi: 10.1111/j.1742-4658.2007.05639.x. [DOI] [PubMed] [Google Scholar]
- 20.Naven TJ, Harvey DJ. Effect of structure on the signal strength of oligosaccharides in matrix-assisted laser desorption/ionization mass spectrometry on time-of-flight and magnetic sector instruments. Rapid Commun Mass Spectrom. 1996;10(11):1361–1366. doi: 10.1002/(SICI)1097-0231(199608)10:11<1361::AID-RCM642>3.0.CO;2-A. [DOI] [PubMed] [Google Scholar]
- 21.Powell AK, Harvey DJ. Stabilization of sialic acids in N-linked oligosaccharides and gangliosides for analysis by positive ion matrix-assisted laser desorption/ionization mass spectrometry. Rapid Commun Mass Spectrom. 1996;10(9):1027–1032. doi: 10.1002/(SICI)1097-0231(19960715)10:9<1027::AID-RCM634>3.0.CO;2-Y. [DOI] [PubMed] [Google Scholar]
- 22.Amps K, et al. International Stem Cell Initiative Screening ethnically diverse human embryonic stem cells identifies a chromosome 20 minimal amplicon conferring growth advantage. Nat Biotechnol. 2011;29(12):1132–1144. doi: 10.1038/nbt.2051. [DOI] [PMC free article] [PubMed] [Google Scholar]
- 23.Fujioka T, Shimizu N, Yoshino K, Miyoshi H, Nakamura Y. Establishment of induced pluripotent stem cells from human neonatal tissues. Hum Cell. 2010;23(3):113–118. doi: 10.1111/j.1749-0774.2010.00091.x. [DOI] [PubMed] [Google Scholar]
- 24.Pan JA, Ullman E, Dou Z, Zong WX. Inhibition of protein degradation induces apoptosis through a microtubule-associated protein 1 light chain 3-mediated activation of caspase-8 at intracellular membranes. Mol Cell Biol. 2011;31(15):3158–3170. doi: 10.1128/MCB.05460-11. [DOI] [PMC free article] [PubMed] [Google Scholar]
- 25.Melville S, McNurlan MA, Calder AG, Garlick PJ. Increased protein turnover despite normal energy metabolism and responses to feeding in patients with lung cancer. Cancer Res. 1990;50(4):1125–1131. [PubMed] [Google Scholar]
- 26.Wyke SM, Russell ST, Tisdale MJ. Induction of proteasome expression in skeletal muscle is attenuated by inhibitors of NF-kappaB activation. Br J Cancer. 2004;91(9):1742–1750. doi: 10.1038/sj.bjc.6602165. [DOI] [PMC free article] [PubMed] [Google Scholar]
- 27.Tang C, et al. An antibody against SSEA-5 glycan on human pluripotent stem cells enables removal of teratoma-forming cells. Nat Biotechnol. 2011;29(9):829–834. doi: 10.1038/nbt.1947. [DOI] [PMC free article] [PubMed] [Google Scholar]
- 28.Koji H, Yamada A, Nagasawa T, Gamou S. DMRT-1 expression during NEC8 human embryonic carcinoma cell differentiation. Cancer Sci. 2006;97(4):277–282. doi: 10.1111/j.1349-7006.2006.00178.x. [DOI] [PMC free article] [PubMed] [Google Scholar]
- 29.Natunen S, et al. The binding specificity of the marker antibodies Tra-1-60 and Tra-1-81 reveals a novel pluripotency-associated type 1 lactosamine epitope. Glycobiology. 2011;21(9):1125–1130. doi: 10.1093/glycob/cwq209. [DOI] [PMC free article] [PubMed] [Google Scholar]
- 30.Reinke SO, Bayer M, Berger M, Hinderlich S, Blanchard V. The analysis of N-glycans of cell membrane proteins from human hematopoietic cell lines reveals distinctions in their pattern. Biol Chem. 2012;393(8):731–747. doi: 10.1515/hsz-2012-0195. [DOI] [PubMed] [Google Scholar]
- 31.Rillahan CD, et al. Global metabolic inhibitors of sialyl- and fucosyltransferases remodel the glycome. Nat Chem Biol. 2012;8(7):661–668. doi: 10.1038/nchembio.999. [DOI] [PMC free article] [PubMed] [Google Scholar]
- 32.Khoo KH, Yu SY. Mass spectrometric analysis of sulfated N- and O-glycans. Methods Enzymol. 2010;478:3–26. doi: 10.1016/S0076-6879(10)78001-0. [DOI] [PubMed] [Google Scholar]
- 33.Yu SY, Wu SW, Hsiao HH, Khoo KH. Enabling techniques and strategic workflow for sulfoglycomics based on mass spectrometry mapping and sequencing of permethylated sulfated glycans. Glycobiology. 2009;19(10):1136–1149. doi: 10.1093/glycob/cwp113. [DOI] [PubMed] [Google Scholar]
- 34.Furukawa K, et al. Novel functions of complex carbohydrates elucidated by the mutant mice of glycosyltransferase genes. Biochim Biophys Acta. 2001;1525(1-2):1–12. doi: 10.1016/s0304-4165(00)00185-9. [DOI] [PubMed] [Google Scholar]
- 35.Satomaa T, et al. The N-glycome of human embryonic stem cells. BMC Cell Biol. 2009;10:42. doi: 10.1186/1471-2121-10-42. [DOI] [PMC free article] [PubMed] [Google Scholar]
- 36.An HJ, et al. Extensive determination of glycan heterogeneity reveals an unusual abundance of high mannose glycans in enriched plasma membranes of human embryonic stem cells. Mol Cell Proteomics. 2012;11(4):M111–010660. doi: 10.1074/mcp.M111.010660. [DOI] [PMC free article] [PubMed] [Google Scholar]
- 37.Liang YJ, et al. Switching of the core structures of glycosphingolipids from globo- and lacto- to ganglio-series upon human embryonic stem cell differentiation. Proc Natl Acad Sci USA. 2010;107(52):22564–22569. doi: 10.1073/pnas.1007290108. [DOI] [PMC free article] [PubMed] [Google Scholar]
- 38.Schneider LV, Hall MP. Stable isotope methods for high-precision proteomics. Drug Discov Today. 2005;10(5):353–363. doi: 10.1016/S1359-6446(05)03381-7. [DOI] [PubMed] [Google Scholar]
Associated Data
This section collects any data citations, data availability statements, or supplementary materials included in this article.