

Abstract
The structure of biofilms formed by seven nonpigmented rapidly growing mycobacteria, including saprophytes and opportunistic species, was analyzed. Analysis included amount of covered surface, thickness, cell viability, and presence of intrinsic autofluorescence at different times using confocal laser scanning microscopy and image analysis. Autofluorescence was detected inside and outside cells of all mycobacteria.
TEXT
It is known that bacteria grow in nature by forming structured and specialized communities of organisms embedded in a matrix of extrapolymeric substance known as a biofilm (1). Biofilms are also considered to be an important pathogenic factor for many diseases, especially implant-related infections (2).
Nonpigmented rapidly growing mycobacteria (NPRGM) (3) are usually considered contaminants or colonizers, although in some patients they are the true cause of the disease (4, 5). The source of human infection is usually the environment (6), with drinking water distribution systems and hospital and household plumbing being the mainly reported sources (4, 7). Findings of recent studies suggest that the biofilm-developing capacity is a property related to the involvement of these bacteria in human pathogenicity (8) and in antimicrobial resistance (9, 10). In a previous report, we observed that NPRGM were able to form biofilms in vitro (5), with differences regarding the importance of biofilms in the pathogenesis of human diseases (11). Other studies have also shown differences among strains within the same species (12). Moreover, there are studies that relate the ability to form biofilms with the presence of cording or rough colonies in the tested strains (12–14).
Intrinsic autofluorescence, including the presence of autofluorescence in the cyan range in Mycobacterium species (16), is a characteristic that has been found previously in several microorganisms (15). In this study, we aimed to analyze the structure of mycobacterial biofilms, with a special focus on detection of autofluorescence.
The strains used were Mycobacterium abscessus DSM 44196, Mycobacterium chelonae ATCC 19235, Mycobacterium fortuitum ATCC 6841, Mycobacterium mageritense ATCC 700351, Mycobacterium mucogenicum DSM 44124, Mycobacterium peregrinum ATCC 14467, and Mycobacterium smegmatis ATCC 607.
Biofilm development was analyzed at 24, 48, 72, and 96 h using hydrophobic uncoated sterile slide 2- by 4-well plates (ibidy GmbH, Martinsried, Germany), as follows.
Mycobacterial colonies were resuspended in sterile phosphate-buffered saline solution (PBS) to achieve a cell density of 1.5 × 10⁸ CFU/ml. Three hundred microliters of this suspension was inoculated on each well. Inoculated slides were incubated at 37°C in a 5% CO2 atmosphere for 30 min. The suspension was then removed, and the wells were washed once with PBS. Three hundred microliters of Middlebrook 7H9 broth was then added to each well, and the slides were placed on an orbital shaker (80 rpm) and incubated at 37°C in normal atmosphere for 4 days. Slides were examined, and the medium was changed daily. All the experiments were performed in triplicate for each strain.
The slide wells were stained using Live/Dead BackLight stain (Invitrogen, Eugene, OR) and Nile Red stain (Sigma-Aldrich Co., St. Louis, MO). Stains were performed according to the instructions provided by the manufacturer. More specifically, Live/Dead BackLight staining was carried out as follows. A working solution was prepared using the L7012 kit reagents. Three microliters of component A and 3 μl of component B were mixed with 1 ml of sterile distilled water. The solution was mixed thoroughly, and 25 μl of working solution was added to each well, followed by incubation for 15 min in the dark, and then the stain was removed and the well was washed with sterile distilled water. After staining, plates were analyzed using a Leica DM IRB confocal laser-scanning microscope (Leica, Germany).
One set of wells was used per NPRGM species to study both autofluorescence and Nile Red stain, and the other was used to analyze the proportion of live and dead mycobacteria. All materials managed in the experiments emitted no autofluorescence.
The covered surface was studied by taking 24 microphotographs for each stain, bacterium, and time set. Photographs were analyzed as previously described (5). The thickness of the biofilm was measured in eight predefined points/well.
Linear mixed-effects models were used to evaluate the effect of testing time and species on autofluorescence. This variable was analyzed as the percentage of fluorescence related to the number of bacterial cells detected with the Nile Red stain using the following formulation: (% autofluorescence of covered surface/% Nile Red covered surface) × 100. Time was treated as a continuous variable, and species was treated as a nominal factor. For interspecies comparisons, M. abscessus was taken as a reference category. Fitted models included fixed effects for species and time, random intercepts, and slopes. Statistical significance for fixed effects was assessed by using the analysis of variance (ANOVA) F-test. Statistical analysis was performed by using the NLME software package implemented in the R environment (17).
Figure 1A shows the mean thickness values during 4 days. A maximum thickness for M. fortuitum biofilm was detected at 72 h (23.11 ± 4.35 μm), as well as for M. chelonae (19.24 ± 5.02 μm). The other five species, namely, M. abscessus (13.64 ± 6.22 μm), M. mageritense (28.75 ± 11.85 μm), M. mucogenicum (33.26 ± 11.93 μm), M. peregrinum (19.89 ± 3.87 μm) and M. smegmatis (36.36 ± 10.83 μm), reached maximum thickness at the end of the experiment.
Fig 1.
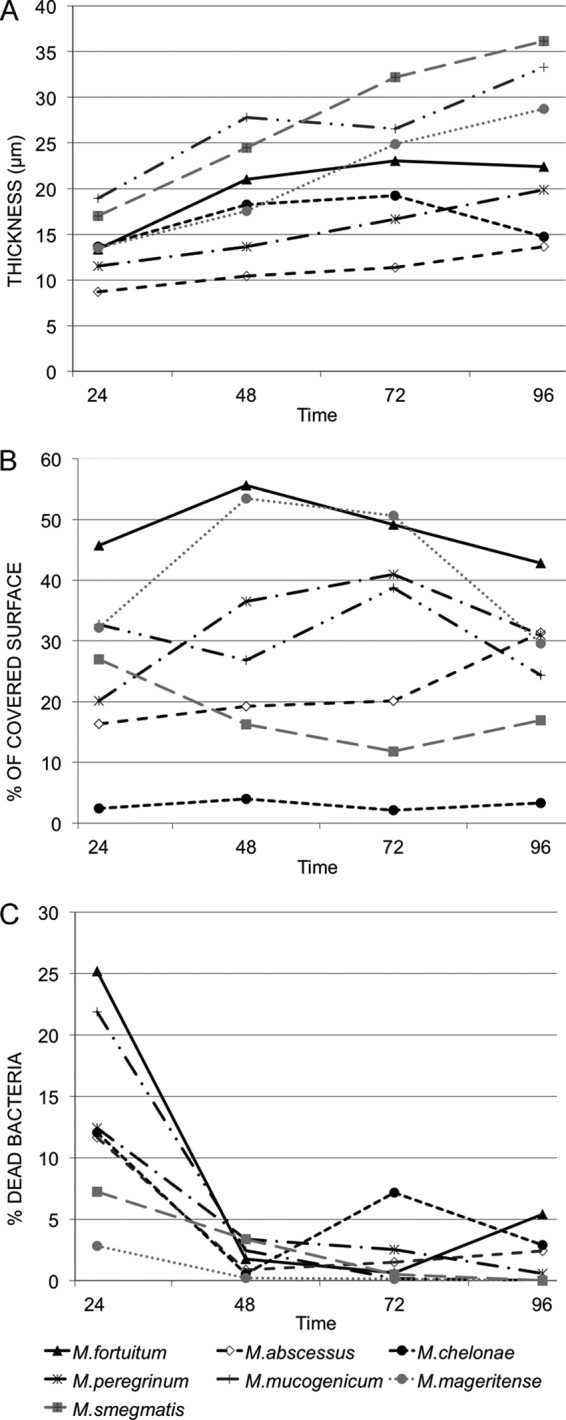
Evolution of different parameters measured for the biofilm of the different species throughout the experiment. (A) Thickness; (B) percentage of surface covered by the biofilm; (C) percentage of dead bacteria inside the biofilm. All data were obtained from samples stained with BackLight Live/Dead stain. Time: hours of incubation.
Analysis of variance indicated that time and species affected the variability of the thickness between the different experiments (P values from ANOVA were ≤0.0001 for both factors). All the strains increased their thickness throughout the incubation time. The fixed slope for time is estimated to be 0.14, i.e., for each additional hour, we observed an average increase in thickness of 0.14. Estimated coefficients for species were all positive, indicating that mean thickness was lower in M. abscessus than in the rest of the species.
Figure 1B shows the mean percentages of covered surface. Observed P values from ANOVA F tests were less than 0.0001 for species. Fixed effects indicate that the mean percentage of covered surface for M. chelonae was lower than that for M. abscessus and higher than those for M. fortuitum and M. mageritense. Time was not an important factor to explain the changes in the covered surface (P = 0.7568) according to this model.
Figure 1C shows the mean percentages of dead bacteria inside the biofilms. Most mycobacteria were alive during the development of the biofilm. Interestingly, a high percentage of dead cells was detected among all mycobacterial strains 24 h after inoculation. We have no explanation for this phenomenon, but stress at the beginning of the experiment or the period of adaptation required to form cell clusters that mature and detach to colonize other surfaces could be potential causes of cell defeat.
The analysis showed that time was an important factor in the viability of bacteria (P = 0.0002). However, the species involved did not have impact on this parameter (P = 0.6314). The fixed slope for time indicates an average reduction of 0.15 in the percentage of deaths for each additional hour.
ANOVA revealed that both time (P = 0.1618) and species (P = 0.3563) were not significant factors to explain the differences found in the autofluorescence measured in the biofilms. The large standard deviation of random error for this model is remarkable. As expected, there is a concordance between the Nile Red-stained bacteria and autofluorescent ones (see Fig. S1 in the supplemental material). Interestingly, we have detected autofluorescence signal outside the bacterial cells in some species with irregular distribution inside the biofilm (see Fig. S1 and S2). M. abscessus, M. mageritense, M. mucogenicum, and M. smegmatis showed this phenomenon after 24 h of incubation, while M. chelonae, M. peregrinum, and M. fortuitum showed autofluorescence after 24 and 48 h.
We found that M. chelonae expanded by forming biofilm that grows vertically, while M. fortuitum and other species covered the entire surface with a lesser thickness (see Fig. S2 in the supplemental material). We also observed extensive cording in the cases of M. abscessus and M. chelonae. Williams et al. (12) showed that cording is associated with the pathogenicity of the strains. In our experiment, this property was detected in M. chelonae and M. abscessus, both considered the most pathogenic species of this group (18).
Autofluorescence has been found in different mycobacterial species (16, 19). It has been hypothesized that coenzyme F420 is involved in autofluorescence of mycobacteria (16). According to our results, this molecule must be secreted by the bacterial components of the biofilm and can be detected in the extracellular matrix using autofluorescence. Another hypothesis could be that coenzyme F420 is released after cell death during biofilm formation. Finally, the preferential detection of extracellular autofluorescence when biofilm formation starts could suggest that autofluorescence could be due to an unknown quorum-sensing factor. This knowledge would help to clarify the involvement of biofilm formation in the infectious capacity of these bacteria.
Supplementary Material
ACKNOWLEDGMENTS
This study was funded by a grant from the Spanish Ministry of Science (FUNCOAT CSD 2008-00023).
We acknowledge Oliver Shaw for his help with the language of the manuscript and Mar Gonzalez Garcia-Parreño for her help with confocal microscopy studies.
Footnotes
Published ahead of print 30 November 2012
Supplemental material for this article may be found at http://dx.doi.org/10.1128/AEM.03149-12.
REFERENCES
- 1. Hall-Stoodley L, Stoodley P. 2005. Biofilm formation and dispersal and the transmission of human pathogens. Trends Microbiol. 13:7–10 [DOI] [PubMed] [Google Scholar]
- 2. Hall-Stoodley L, Costerton JW, Stoodley P. 2004. Bacterial biofilms: from the natural environment to infectious diseases. Nat. Rev. Microbiol. 2:95–108 [DOI] [PubMed] [Google Scholar]
- 3. Primm TP, Lucero CA, Falkinham JO., III 2004. Health impacts of environmental mycobacteria. Clin. Microbiol. Rev. 17:98–106 [DOI] [PMC free article] [PubMed] [Google Scholar]
- 4. Falkinham JO., III 2009. Surrounded by mycobacteria: nontuberculous mycobacteria in the human environment. J. Appl. Microbiol. 107:356–367 [DOI] [PubMed] [Google Scholar]
- 5. Esteban J, Martin-de-Hijas NZ, Kinnari TJ, Ayala G, Fernandez-Roblas R, Gadea I. 2008. Biofilm development by potentially pathogenic non-pigmented rapidly growing mycobacteria. BMC Microbiol. 8:184 doi:10.1186/1471-2180-8-184 [DOI] [PMC free article] [PubMed] [Google Scholar]
- 6. Falkinham JO., III 2002. Nontuberculous mycobacteria in the environment. Clin. Chest Med. 23:529–551 [DOI] [PubMed] [Google Scholar]
- 7. van Ingen J, Boeree MJ, Dekhuijzen PN, van Soolingen D. 2009. Environmental sources of rapid growing nontuberculous mycobacteria causing disease in humans. Clin. Microbiol. Infect. 15:888–893 [DOI] [PubMed] [Google Scholar]
- 8. Esteban J, Garcia-Pedrazuela M, Munoz-Egea MC, Alcaide F. 2012. Current treatment of nontuberculous mycobacteriosis: an update. Expert Opin. Pharmacother. 13:967–986 [DOI] [PubMed] [Google Scholar]
- 9. Ortiz-Perez A, Martin-de-Hijas N, Alonso-Rodriguez N, Molina-Manso D, Fernandez-Roblas R, Esteban J. 2011. Importance of antibiotic penetration in the antimicrobial resistance of biofilm formed by non-pigmented rapidly growing mycobacteria against amikacin, ciprofloxacin and clarithromycin. Enferm. Infecc. Microbiol. Clin. 29:79–84 [DOI] [PubMed] [Google Scholar]
- 10. Greendyke R, Byrd TF. 2008. Differential antibiotic susceptibility of Mycobacterium abscessus variants in biofilms and macrophages compared to that of planktonic bacteria. Antimicrob. Agents Chemother. 52:2019–2026 [DOI] [PMC free article] [PubMed] [Google Scholar]
- 11. Martin-de-Hijas NZ, Garcia-Almeida D, Ayala G, Fernandez-Roblas R, Gadea I, Celdran A, Gomez-Barrena E, Esteban J. 2009. Biofilm development by clinical strains of non-pigmented rapidly growing mycobacteria. Clin. Microbiol. Infect. 15:931–936 [DOI] [PubMed] [Google Scholar]
- 12. Williams MM, Yakrus MA, Arduino MJ, Cooksey RC, Crane CB, Banerjee SN, Hilborn ED, Donlan RM. 2009. Structural analysis of biofilm formation by rapidly and slowly growing nontuberculous mycobacteria. Appl. Environ. Microbiol. 75:2091–2098 [DOI] [PMC free article] [PubMed] [Google Scholar]
- 13. Catherinot E, Clarissou J, Etienne G, Ripoll F, Emile JF, Daffe M, Perronne C, Soudais C, Gaillard JL, Rottman M. 2007. Hypervirulence of a rough variant of the Mycobacterium abscessus type strain. Infect. Immun. 75:1055–1058 [DOI] [PMC free article] [PubMed] [Google Scholar]
- 14. Howard ST, Rhoades E, Recht J, Pang X, Alsup A, Kolter R, Lyons CR, Byrd TF. 2006. Spontaneous reversion of Mycobacterium abscessus from a smooth to a rough morphotype is associated with reduced expression of glycopeptidolipid and reacquisition of an invasive phenotype. Microbiology 152:1581–1590 [DOI] [PubMed] [Google Scholar]
- 15. Bhatta H, Goldys EM, Learmonth RP. 2006. Use of fluorescence spectroscopy to differentiate yeast and bacterial cells. Appl. Microbiol. Biotechnol. 71:121–126 [DOI] [PubMed] [Google Scholar]
- 16. Patino S, Alamo L, Cimino M, Casart Y, Bartoli F, Garcia MJ, Salazar L. 2008. Autofluorescence of mycobacteria as a tool for detection of Mycobacterium tuberculosis. J. Clin. Microbiol. 46:3296–3302 [DOI] [PMC free article] [PubMed] [Google Scholar]
- 17. Pinheiro JC, Bates DM, DebRoy S, Sarkar D. 2006. NLME: linear and nonlinear mixed effects models. R package, version 3.1-79 [Google Scholar]
- 18. De Groote MA, Huitt G. 2006. Infections due to rapidly growing mycobacteria. Clin. Infect. Dis. 42:1756–1763 [DOI] [PubMed] [Google Scholar]
- 19. Joshi P, Singh M, Bhargava A, Mehrotra R. 2012. Autofluorescence—an important ancillary technique for the detection of Mycobacterium tuberculosis: revisited. Diagn. Cytopathol. doi:10.1002/dc.21860 [DOI] [PubMed] [Google Scholar]
Associated Data
This section collects any data citations, data availability statements, or supplementary materials included in this article.