

Abstract
Cinnamaldehyde is a natural antimicrobial that has been found to be effective against many food-borne pathogens, including Escherichia coli O157:H7. Although its antimicrobial effects have been well investigated, limited information is available on its effects at the molecular level. Sublethal treatment at 200 mg/liter cinnamaldehyde inhibited growth of E. coli O157:H7 at 37°C and for ≤2 h caused cell elongation, but from 2 to 4 h growth resumed and cells reverted to normal length. To understand this transient behavior, genome-wide transcriptional analysis of E. coli O157:H7 was performed at 2 and 4 h of exposure to cinnamaldehyde in conjunction with reverse-phase high-performance liquid chromatography (RP-HPLC) analysis for cinnamaldehyde and other cinnamic compounds. Drastically different gene expression profiles were obtained at 2 and 4 h. RP-HPLC analysis showed that cinnamaldehyde was structurally stable for at least 2 h. At 2 h of exposure, cinnamaldehyde induced expression of many oxidative stress-related genes and repressed expression of DNA, protein, O-antigen, and fimbrial synthetic genes. At 4 h, many cinnamaldehyde-induced repressive effects on E. coli O157:H7 gene expression were reversed, and cells became more motile and grew at a slightly higher rate. Data indicated that by 4 h, E. coli O157:H7 was able to convert cinnamaldehyde into the less toxic cinnamic alcohol using dehydrogenase/reductase enzymes (YqhD and DkgA). This is the first study to characterize the ability of E. coli O157:H7 to convert cinnamaldehyde into cinnamic alcohol which, in turn, showed that the antimicrobial activity of cinnamaldehyde is mainly attributable to its carbonyl aldehyde group.
INTRODUCTION
Safety and shelf-life of perishable foods can be improved by altering pH, reducing water activity (through dehydration or by adding solutes), lowering temperature, modifying atmosphere storage, or by a combination of these techniques (1). However, marginal conditions have caused cell elongation of many food-borne pathogens, often without substantial changes in viable numbers. For example, low pH (4.3), low water activity (0.95), and low temperature caused elongation of Escherichia coli O157, commensal E. coli, and Salmonella (2, 3), while exposure to 5% NaCl caused elongation of Bacillus cereus (4). Similarly, elongation of Listeria monocytogenes under 100% CO2 and 4°C or pH 5 and 10% NaCl (5, 6), as well as elongation of E. coli by high hydrostatic pressure (7), have also been reported. The elongation of cells under many of these conditions seemed to continue indefinitely, while the conditions that caused elongation were imposed (3, 8, 9). Removal of restrictions and exposure of elongated cells to favorable conditions resulted in rapid division of elongated cells into multiple daughter cells (8, 10).
Use of natural antimicrobials as alternatives to traditional preservation techniques, like heat treatment, dehydration, and chemical preservatives, has gained popularity in recent years as consumers increasingly prefer foods processed with milder preservation techniques, which have enhanced natural appeal and perceived nutritional quality (11). Plant essential oils and their components, like eugenol, cinnamaldehyde, thymol, and carvacrol, have been reported to be effective against many food-borne pathogens, including E. coli O157:H7 (12), which continues to be one of the major food-borne pathogens in many developed countries (13). E. coli O157:H7 infections contribute significantly not only to the economic burden (http://www.producesafetyproject.org/admin/assets/files/Health-Related-Foodborne-Illness-Costs-Report.pdf-1.pdf) but also to the overall morbidity and mortality of food-borne illnesses (14, 15). Cinnamaldehyde improves the safety of many perishable foods by inactivating E. coli O157:H7 and other food-borne pathogens (16–21).
Cinnamaldehyde at concentrations between 100 and 300 mg/liter can also cause cell elongation in E. coli O157:H7 without substantial changes in viability occurring during exposure at 37°C for ≤5 h. Elongation was more extensive at 2 h exposure to 200 mg/liter cinnamaldehyde. Unlike exposure to other marginal conditions, cinnamaldehyde-induced cell elongation did not last indefinitely, and cells resumed multiplication after 2 h of treatment and returned to normal morphology by 4 h (22). This transient cell elongation could have been the result of one or more of the following: (i) E. coli O157:H7 became adapted or acclimated to cinnamaldehyde by modifying gene expression, which may occur under other marginal conditions (23, 24); (ii) a reduction in the concentration of cinnamaldehyde occurred through chemical instability or by its volatilization from media during constant agitation, and/or (iii) the conversion of cinnamaldehyde to cinnamic alcohol occurred by the action of alcohol dehydrogenases/reductases, as can occur in human skin cells during its detoxification (25). E. coli has multiple alcohol dehydrogenases (26) which can convert cinnamaldehyde into cinnamic alcohol. Therefore, the objectives of the study were to examine how transcriptional changes differed in E. coli O157:H7 when measureable growth was inhibited at 2 and 4 h by 200 mg/liter cinnamaldehyde. Changes in cinnamaldehyde concentration and its possible metabolite, cinnamic alcohol, were also monitored in the cultures during this period. Furthermore, even though ample literature describes the antimicrobial potency of cinnamaldehyde and other plant essential oil components, comparatively less information describes their influence on transcriptomic changes in E. coli O157:H7. The study was undertaken to provide better understanding of the antimicrobial action of cinnamaldehyde at the molecular level.
MATERIALS AND METHODS
Bacterial strain and growth conditions.
E. coli O157:H7 02:0627 and a nonmotile strain, 02:1840, were used in this study. Strain 02:0627 was chosen for the examination of cinnamaldehyde-induced transcriptomic changes, because it has been found to undergo extensive cell elongation in response to cinnamaldehyde treatment (22). The nonmotile strain was used only as a negative control for motility assays. Both E. coli O157:H7 strains were provided by R. Ahmed, National Microbiology Laboratory, Public Health Agency of Canada (Winnipeg, Manitoba, Canada). E. coli cultures were stored at −80°C and maintained on brain heart infusion agar (BHIA) plates (Oxoid, Mississauga, Ontario, Canada) at 4°C with monthly transfer to new plates. Active E. coli cultures were obtained by transferring a single colony from a plate to 10 ml brain heart infusion broth (BHIB; Accumedia, Lansing, MI) with incubation at 37°C for 16 to 18 h. A flask containing 99 ml BHIB was inoculated with 1 ml overnight culture and incubated at 37°C to get exponential-phase cultures with absorbance at 600 nm (A600) between 0.6 and 0.7.
Cinnamaldehyde treatment.
Cinnamaldehyde was obtained from SAFC Supply Solutions (St. Louis, MO). Filter-sterilized (0.2-μm-syringe filter unit; Fisher Scientific, Edmonton, Alberta, Canada) cinnamaldehyde was dissolved in BHIB containing 4% (vol/vol) dimethyl sulfoxide (DMSO; Sigma-Aldrich, Oakville, Ontario, Canada) to yield a 6,400 mg/liter cinnamaldehyde stock solution, which was prepared immediately prior to each use.
Appropriate amounts of the cinnamaldehyde stock solution were added to each of two 250-ml screw-cap Erlenmeyer flasks to achieve a final concentration of 200 mg/liter after the total volume was adjusted to 150 ml by addition of inoculum and BHIB. Approximately 15 ml of exponential-phase culture was added to each flask to yield an initial bacterial population near 2.5 × 10⁷ (A600 value between 0.06 and 0.07). Two control culture flasks containing a similar bacterial concentration and DMSO (0.125%) without cinnamaldehyde were also prepared. The contents of the flasks were mixed well and incubated at 37°C for ≤4 h with shaking at 100 rpm. Growth and changes in cell length were monitored for 4 h as previously described (22, 27).
RNA extraction.
Duplicate control and 200 mg/liter cinnamaldehyde-treated cultures of E. coli O157:H7 were obtained as described above and incubated at 37°C with shaking at 100 rpm for 4 h. At 2 and 4 h, three 600-μl samples were collected from each culture, with the exception of the 200 mg/liter treatment at 2 h, where three 1-ml samples were collected and transferred to sterile DNA/RNA-free 2-ml-sized microcentrifuge tubes. These volumes were chosen based on preliminary experiments to yield ≥10 μg of total RNA from each control or treatment culture. Samples were centrifuged at 13,000 × g for 5 min at 4°C. After discarding supernatants, 1 ml TRIzol reagent (Invitrogen Canada, Burlington, Ontario, Canada) was added, vortexed, and incubated at 65°C for 10 min. Total RNA was isolated using chloroform phase separation, isopropanol precipitation, 75% ethanol washing, and air drying as described by the TRIzol manufacturer. The RNA pellet was dissolved using 100 μl RNase-free water, digested with DNase I, and cleaned up using RNeasy mini columns (Qiagen Sciences, Germantown, MD) according to the manufacturer's protocol. RNA was resuspended in 40 μl nuclease-free water (Applied Biosystems, Foster City, CA), and its quality and quantity were measured using a spectrophotometer (Du 800; Beckman Coulter; Fullerton, CA).
cDNA synthesis, labeling, and hybridization.
Both cDNA synthesis and terminal labeling were performed according to the standard Affymetrix protocol (Santa Clara, CA). Hybridization of the cDNAs was conducted at Genome Québec Innovation Centre (McGill University, Montréal, Quebec, Canada) using an Affymetrix Genechip E. coli Genome 2.0 array as described by the manufacturer.
Microarray data analysis.
Raw microarray data from two biological replicates per treatment at each sampling time were imported into FlexArray 1.6.1 software, and statistical tests were performed (28). Data normalization, background correction, and expression value calculation were done using the robust multiarray average algorithm (RMA) (29). The EB (Wright and Simon) algorithm was employed to enhance the robustness of the data. Each average fold change (FC) of treatments was compared to the corresponding mean value of controls. Because the RMA algorithm reduced the false-positive rate, increased sensitivity, and compressed the FC, an FC value of ≥2 log2 or ≤−2 log2 with a P value of ≤0.05 was considered a cutoff point to determine differentially expressed genes (29, 30). The differentially expressed genes were classified into functional groups using the Database for Annotations, Visualizations, and Integrated Discovery (DAVID), version 6.7 (31, 32).
Motility assay.
Soft-BHIA (BHIB plus 0.25% agar; Fisher) plates with 100, 200, and 300 mg/liter cinnamaldehyde and without cinnamaldehyde were prepared and immediately vacuum sealed in aroma-impermeable packages (ESE 1275 R; Winpak, Winnipeg, Manitoba, Canada) containing a polyethylene terephthalate layer (PET) (33). The vacuum-sealed plates were stored at 4°C overnight for solidification. Exponential-phase cultures of the motile and nonmotile E. coli O157:H7 strains were prepared as described above and diluted to nearly 107 CFU/ml. Soft BHIA plates were removed from vacuum packages, and a 1-μl sample of diluted culture (about 104 CFU/plate) was placed in the middle of each agar plate by stabbing incompletely through with a micropipette tip to avoid swarming on the bottom surface (34). Four plates from each concentration were again vacuum sealed and incubated at 37°C for 12 h, and duplicates were held without vacuum packaging. The diameter of each motility halo was recorded. Since vacuum packaging did not affect the halo, the experiment was repeated without a vacuum. Following measurements, the contents of each plate were transferred to a stomacher bag and decimally diluted with 0.1% peptone. Diluted samples were plated as described above and incubated at 37°C for 18 to 24 h, and colonies were counted.
RP-HPLC analysis.
Duplicate E. coli O157:H7 06:0627 cultures with (treatment) and without (positive control) 200 mg/liter cinnamaldehyde plus uninoculated BHIB with 200 mg/liter cinnamaldehyde (negative control) were prepared as described above and incubated at 37°C with shaking at 100 rpm. Ten-ml samples collected from treatment and positive controls at 0, 2, and 4 h were centrifuged at 10,000 × g for 10 min at 4°C, and the pellet and supernatant were separated. The cell pellets were resuspended in methanol (Fisher) and sonicated for 15 min in a Bransonic bath (5510; Branson, Grass Valley, CA). The suspension was filtered through 0.2-μm nylon syringe filter units (Fisher) and directly used for reverse-phase high-performance liquid chromatography (RP-HPLC) analysis. The supernatant was mixed with 10 ml ethyl acetate (Sigma-Aldrich) to avoid interference by materials present in BHIB with RP-HPLC detection. The mixture was vortexed at maximum speed for 3 min. After a 3-min rest, the clear top ethyl acetate phase was collected and the procedure was repeated twice. Ethyl acetate extracts prepared from negative controls were not centrifuged. The pooled ethyl acetate extracts generated from each 10-ml sample were evaporated using a rotary evaporator (IKA; RV10 Digital, Santa Clara, CA), and the residue was dissolved in 20 ml methanol. The solution was further diluted in methanol, if needed, filtered through a 0.2-μm nylon syringe filter unit, and immediately used for RP-HPLC analyses. The extracts prepared from duplicate supernatants and corresponding cell pellets were analyzed separately.
The analysis was performed using a Waters HPLC system consisting of a model 486 detector operated at 280 nm and a 600E system controller (Waters Corporation, Milford, MA). The data were processed using Waters LC-module 1 millennium software, version 32. A reverse-phase Gemini C18 column (150 by 4.6 mm, 5-μm particle size) was connected by a security guard column (Gemini-NX C18; 4 by 3.0 mm; Phenomenex, Torrance, CA) to the instrument. The mobile phases used for separation were the following: A, 1% acetic acid (Sigma-Aldrich) in methanol, and B, 1% acetic acid in water. A gradient flow of mobile phases (0 to 10 min at 15% A, 85% B; 10 to 11 min at 50% A, 50% B; 11 to 18 min at 65% A, 35% B; and 18 to 30 min at 15% A, 85% B) at a rate of 1 ml/min was used for separation. The retention times and standard curves for cinnamaldehyde and cinnamic alcohol were obtained by injecting 10 μl filtered standard solution (0.5 to 50 μg/ml) of each compound. The linearity of the curves and the respective correlation coefficients were calculated from the peak area at each standard concentration. Ten μl extract from treatment samples or positive or negative controls were injected. The methanol extracts obtained from cells were injected at the same level, separately, and final concentrations of cinnamaldehyde or cinnamic alcohol were obtained by combining values of the cell extract and the extract from corresponding supernatants.
Determination of the MIC of cinnamic alcohol.
The broth macrodilution assay described previously was used to determine the MIC of cinnamic alcohol (22). Exponential-phase culture prepared at 37°C was diluted in BHIB to yield 2.5 × 10⁶ CFU/ml and added to screw-cap glass tubes containing 2-fold serial dilutions of cinnamic alcohol in BHIB to achieve final concentrations of 100 to 3,200 mg/liter. A set of tubes containing similar concentrations of cinnamic alcohol in BHIB without inoculum and a tube containing only inoculum were included in each experiment. The contents of the tubes were vortexed and incubated at 37°C for 24 h with shaking at 150 rpm. The lowest concentration of cinnamic alcohol showing no visible growth or turbidity after 24 h at 37°C was considered the MIC.
Response to cinnamaldehyde reexposure.
A control with 0.125% DMSO and 200 mg/liter cinnamaldehyde-treated cultures were prepared as described above and maintained for 4 h. Thirty-ml control and treatment samples then were centrifuged at 4°C for 10 min at 6,000 × g. The supernatant was discarded, and the pellet was resuspended in 30 ml BHIB. Appropriate amounts of suspended pretreated cells were added to flasks to yield 2.5 × 10⁷ CFU/ml at a final concentration of 200 mg/liter cinnamaldehyde. Similarly, a suspension of untreated cells was also treated with 200 mg/liter cinnamaldehyde. In addition, both pretreated and control cells were added to fresh BHIB with or without 0.125% DMSO at similar inoculum levels. All flasks were incubated at 37°C for 4 h, and viable numbers were counted at hourly intervals as previously described. Three biological replicates were used for each treatment.
Data analysis.
Cell motility and RP-HPLC data were compared by one-way analysis of variance (ANOVA). Tukey's test was used to assess differences among treatments, and statistical difference between treatment means was concluded when P ≤ 0.05.
Microarray data accession number.
Data from microarray analyses were deposited at the National Center for Biotechnology Information Gene Expression Omnibus database (http://www.ncbi.nlm.nih.gov.geo) under accession number GSE40693.
RESULTS
Changes in transcriptomic response.
Whole-genome transcriptomic profiling of E. coli O157:H7 at 2 and 4 h of exposure to 200 mg/liter cinnamaldehyde was performed using the commercially available Affymetrix GeneChip 2.0 array. This array contained 10,208 oligonucleotide probe sets, corresponding to 20,336 genes of 4 E. coli genomes (strains K-12 MG1655, O157:H7 EDL033, O157:H7 Sakai, and uropathogenic CFT073). Genes that showed a high degree of similarity among the E. coli strains were represented by a single probe set and were the equivalent ortholog in all 4 strains (35). A total of 8,662 probe sets (84.9%) were detected in hybridized chips and used for data analysis.
A total of 195 genes were differentially expressed after treatment with cinnamaldehyde for 2 h, of which 72 were upregulated. After 4 h of cinnamaldehyde treatment, a total of 466 genes were differentially expressed, of which 352 were upregulated. Forty-one genes were found to be differentially expressed at both 2 and 4 h; however, only 31 genes with well or putatively identified functions are presented in Table 1. Hypothetical genes that were differentially expressed either at 2 or 4 h are not presented, but a complete list of these genes was deposited in the National Center for Biotechnology Information Gene Expression Omnibus database.
Table 1.
E. coli O157:H7 genes that were differentially expressed after 2 and 4 h of cinnamaldehyde exposure
| Gene and functional group | Function | Fold change (log2) in expression at: |
|
|---|---|---|---|
| 2 h | 4 h | ||
| Energy derivation and oxidation reduction | |||
| yqhD | Alcohol dehydrogenase, NAD(P) dependent | 6.1 | —a |
| dkgA | 2,5-diketo-d-gluconate reductase A | 5.0 | — |
| fumB | Anaerobic class I fumarate hydratase (fumarase B) | −4.8 | 2.1 |
| glpABCb | Anaerobic sn-glycerol-3-phosphate dehydrogenase | −2.1/−2.8/−6.4 | —/2.8/4.4 |
| hybOABDEFGb | Hydrogenase 2 | −2.4/−3.0/−2.4/−3.4/−2.1/−2.1/−3.3 | 1.5/2.3/2.9/2.2/1.9/1.6/1.6 |
| gapC | Glyceraldehyde 3-phosphate dehydrogenase C | 2.0 | 2.6 |
| cyoA | Cytochrome o ubiquinol oxidase subunit II | 3.4 | 2.2 |
| nemA | N-Ethylmaleimide reductase | 5.0 | 3.8 |
| Translation/protein synthesis | |||
| iraD | DNA replication/recombination | −2.8 | 2.1 |
| dusB | tRNA-dihydrouridine synthase B | −2.7 | 3.1 |
| rplC | 50S ribosomal protein L3 | −2.6 | 2.6 |
| Stress response | |||
| cspHGb | Cold shock protein | −4.2/−2.4 | 6.2/5.9 |
| asr | Acid shock-inducible periplasmic protein | 2.6 | −5.3 |
| dps | DNA starvation/stationary-phase protection protein Dps | 3.4 | −2.4 |
| psiE | Phosphate-starvation-inducible protein PsiE | 2.1 | −2.6 |
| rydB | ncRNA | 5.3 | −2.3 |
| yhcN | Conserved protein; periplasmic protein | 5.1 | 2.0 |
| Antibiotic resistance | |||
| marAc | DNA-binding transcriptional dual activator of multiple antibiotic resistance | 3.8 | — |
| marRc | DNA-binding transcriptional repressor of multiple antibiotic resistance | 4.2 | — |
| marBc | Multiple antibiotic resistance protein | 3.1 | — |
| mdtEFb | Multidrug efflux system protein | −2.8/−3.3 | 1.6/2.8 |
| Membrane/membrane transport | |||
| ECs2113 | Type 1 fimbrial protein, A chain precursor | −2.2 | 2.4 |
| ECs2112 | Putative fimbrial chaperone protein | −3.2 | 2.1 |
| ECs4328 | Putative acyl carrier protein | −2.0 | 3.7 |
| yhiD | Putative Mg2+ transport ATPase | −4.2 | 2.1 |
| yedE | Putative inner membrane protein | −2.6 | 2.1 |
| ynjD | Predicted transporter subunit: ATP-binding component of ABC superfamily | −2.3 | 2.5 |
| ynjE | Putative thiosulfate sulfur transferase | −2.5 | 2.4 |
| yhjX | Inner membrane protein/MFS transporter | 3.9 | −2.3 |
| gfcB | Predicted outer membrane lipoprotein | −2.1 | 2.7 |
| efeU | Ferrous iron permease | 2.8 | −3.1 |
| tolCb | Outer membrane channel protein | 1.8 | 1.5 |
| Anaerobiosis | |||
| ansB | l-Asparaginase II | −3.6 | 2.2 |
| speF | Ornithine decarboxylase | −2.2 | 2.1 |
None of the genes influencing cell shape/cell division were differentially expressed after 2 h of treatment. However, at 4 h of treatment, 18 genes, which included those related to cell division, peptidoglycan synthesis, and chromosome segregation, were overexpressed, while genes encoding cell division inhibitors were downregulated (see Table S1 in the supplemental material).
More than 32 genes related to energy derivation and oxidation/reduction reactions were differentially expressed at 2 h of treatment, while 37 genes belonging to this group were differentially expressed at 4 h. The genes involved in aerobic respiration and electron transport were upregulated (Table 1; also see Table S2 in the supplemental material), while the genes involved in anaerobic respiration and all three hydrogenases were downregulated at 2 h (Table 1; also see Table S3). Of the genes upregulated at 2 h, the highest expression (6.1-fold) was observed with the gene encoding alcohol dehydrogenase (yqhD), which was followed by a 5.0-fold increase in the gene encoding 2,5-diketo-d-gluconate reductase A (dkgA). At 4 h, no differential expression was observed with yqhD, dkgA, and other aerobic respiratory genes. The expression of many previously suppressed genes associated with anaerobic respiration and many genes involved in electron transport were upregulated at 4 h (see Table S4).
Treatment with cinnamaldehyde for 2 h caused a significant reduction in the expression of genes responsible for DNA replication, protein synthesis (including RNA synthesis and 50S and 30S ribosomal protein synthesis), O-antigen synthesis, and fimbrial synthesis (Table 1; also see Table S3 in the supplemental material). The overall negative effect was reversed at 4 h, and the expression of many DNA replication, protein, O-antigen, and fimbrial synthesis genes increased by 1.8- to ≥5-fold (Table 1; also see Table S4). In addition, many genes associated with lipid A biosynthesis and long-chain fatty acid biosynthesis were upregulated at 4 h.
Various stress response genes were differentially expressed at 2 and 4 h of treatment. The genes sodA, katE, gshA, and yhcN, which are known to be involved in various oxidative stress responses in E. coli, were upregulated at 2 h (38–41), but many of these genes were not differentially expressed at 4 h (Table 1; also see Table S2 in the supplemental material). The gene for Fe-S scaffold protein cluster assembly (sufA) was expressed slightly below (1.9-fold) the cutoff limit at 2 h. The gene bhsA, which is involved in biofilm formation and oxidative stress response (39, 42), was upregulated at 2 h, while expression of the gene for DNA starvation/stationary-phase protection (dps) was decreased from 3.4-fold at 2 h to −2.4-fold at 4 h. Some osmotically inducible genes and a gene for heat shock protein were upregulated at 2 h, but the many genes belonging to these two groups were either not differentially expressed or were downregulated at 4 h (Table 1; also see Tables S2 and S5 in the supplemental material). In contrast, the genes encoding the cold shock proteins, cspH and cspG, were downregulated by ≥2.4-fold at 2 h and were upregulated by ≥6-fold at 4 h. The expression of genes involved in glutamate-dependent acid resistance and acid-resistant proteins were repressed by ≥3.5-fold at 2 h and were not differentially expressed at 4 h. On the other hand, genes for the acid-inducible protein InaA were upregulated by 3.9-fold, but only at 2 h.
Cinnamaldehyde exposure for 2 or 4 h substantially induced expression of several antibiotic resistance genes. The genes of the multiple antibiotic resistance (mar) operon, marRAB, and antibiotic resistance genes under the control of MarA were upregulated at 2 h (Table 1; also see Table S2 in the supplemental material), while many other antibiotic resistance genes that are unrelated to MarA were overexpressed at 4 h (see Table S4).
Cinnamaldehyde exposure at 2 h repressed the expression of outer membrane porin protein genes (ompC and ompF), and no differential expression of these genes was observed at 4 h (see Table S3 in the supplemental material). In addition, the gene for the outer membrane channel/efflux protein (tolC) was expressed slightly below the cutoff limit at both 2 and 4 h.
Although several transcriptional regulatory genes were differentially expressed either at 2 or 4 h of cinnamaldehyde exposure, notable were the upregulation of yqhC, a putative ARAC-type regulator at 2 h, and induction of genes encoding the global DNA binding transcriptional regulator, Fis, at 4 h.
None of the motility and chemotaxis-related genes was differentially expressed at 2 h, but >20 of these genes were upregulated at 4 h. The highest level of expression of all genes was observed with genes encoding flagellar motor proteins (motAB; ≥6.7-fold).
Motility assay.
The soft BHIA plate motility assay was performed to examine whether elevated expression of motility/chemotaxis genes observed at 4 h of cinnamaldehyde treatment resulted in increased motility of E. coli O157:H7. The diameters of the E. coli O157:H7 motility halo in control, 100, 200, and 300 mg/liter cinnamaldehyde-containing soft-agar plates were 4.2, 4.5, 5.4, and 0.6 cm, respectively. The motility halo diameter of cells treated with 200 mg/liter was significantly (P ≤ 0.05) higher than that of the control (Fig. 1). Growth was observed only at the inoculation site of the nonmotile E. coli O157:H7 control. The numbers of E. coli O157:H7 in control and 200 mg/liter cinnamaldehyde-containing soft-agar plates were 8.8 and 9.2 log CFU/cm2, respectively.
Fig 1.
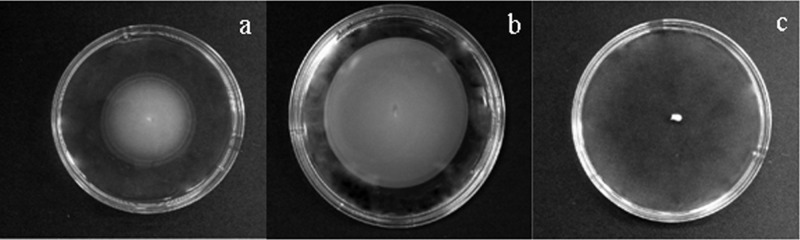
Photographs of agar plates showing active motility of E. coli O157:H7 within the agar of control (a), 200 mg/liter cinnamaldehyde, soft-BHI-agar plates (b), and a nonmotile E. coli O157:H7 control (c) after 12 h of incubation at 37°C.
RP-HPLC analysis.
The changes in concentrations of cinnamaldehyde and its possible metabolite, cinnamic alcohol, in BHIB with E. coli O157:H7 (treatment) and without bacterial inoculation but with cinnamaldehyde (negative control) were monitored by RP-HPLC analysis (Fig. 2). The concentration of cinnamaldehyde detected immediately before incubation at 37°C (0 h) was 154.5 ± 10.2 mg/liter with the negative control and treatment (Table 2). This indicates that only about 80% of the cinnamaldehyde added (200 mg/liter) was extracted using ethyl acetate. At 2 h the cinnamaldehyde concentration decreased by 20 mg/liter in both the negative control and treatment culture and remained stable in the negative control at 4 h. However, with E. coli O157:H7, the cinnamaldehyde concentration decreased to ≤10 mg/liter at 4 h, and the cinnamic alcohol concentration increased to about 120 mg/liter. Cinnamic alcohol was not detected in the positive control (E. coli O157:H7 alone) for ≤4 h.
Fig 2.

RP-HPLC detection of cinnamaldehyde (a) and a mixture of 5 mg/liter cinnamaldehyde and 50 mg/liter cinnamic alcohol standards (b) at 280 nm using 1% acetic acid in water and 1% acetic acid in methanol as the mobile phase. The cinnamaldehyde retention time was 16.920 min; the cinnamic alcohol retention time was 16.762 min.
Table 2.
Conversion of cinnamaldehyde to cinnamic alcohol by E. coli O157:H7 in BHIB at 37°Ca
| Treatment | Concn (mg/liter) of: |
|||||
|---|---|---|---|---|---|---|
| Cinnamaldehyde |
Cinnamic alcohol |
|||||
| 0 h | 2 h | 4 h | 0 h | 2 h | 4 h | |
| BHIB plus cinnamaldehyde, uninoculated (negative control) | 156.4 ± 2.7Aa | 125.9 ± 1.0Ab | 115.9 ± 4.7Ab | ND | ND | ND |
| BHIB plus E. coli O157:H7 plus cinnamaldehyde (treatment) | 151.1 ± 16.1Aa | 120.6 ± 3.1Ab | 7.1 ± 0.1Bc | ND | ND | 114 ± 8.3 |
| BHIB plus E. coli O157:H7 (positive control) | ND | ND | ND | ND | ND | ND |
ND, not detected. Different superscript uppercase letters in each column indicate a significant difference (P < 0.05). Different superscript lowercase letters in each row denote a significant difference (P < 0.05).
MIC value of cinnamic alcohol.
Since cinnamic alcohol was detected at 4 h in treated samples, its antimicrobial potency (MIC value) against E. coli O157:H7 was determined and found to be 1,600 mg/liter.
Response to cinnamaldehyde reexposure.
Since it was observed that E. coli O157:H7 converted cinnamaldehyde to cinnamic alcohol, the response to renewed exposure to 200 mg/liter cinnamaldehyde was examined. As expected, a ≤2-h growth delay was observed with cells that were not previously exposed to 200 mg/liter cinnamaldehyde (22, 27), while preexposure to 200 mg/liter cinnamaldehyde for 4 h decreased the growth delay by ≥1 h upon reexposure (Fig. 3). The growth of E. coli O157:H7 was not affected by 0.125% DMSO.
Fig 3.
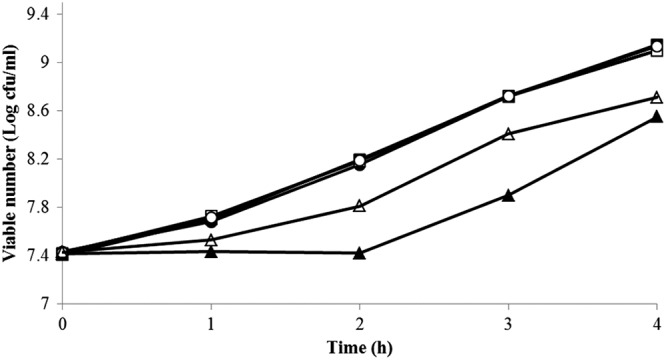
Growth of E. coli O157:H7 in response to reexposure to 200 mg/liter cinnamaldehyde at 37°C. Closed triangles indicate growth upon a single exposure to cinnamaldehyde. Open triangles indicate cells previously exposed to 200 mg/liter cinnamaldehyde for 4 h, centrifuged, and reexposed to 200 mg/liter cinnamaldehyde. Also shown is the growth of cells without cinnamaldehyde, including cells not previously exposed to cinnamaldehyde and in the absence (closed square) or the presence of 0.125% DMSO (closed circles), as well as cells previously treated with 200 mg/liter cinnamaldehyde for 4 h in the absence of DMSO (open squares) or presence of 0.125% DMSO (open circles).
DISCUSSION
Since exposure of E. coli O157:H7 to 200 mg/liter cinnamaldehyde for 2 and 4 h yielded two distinctive phenotypes at 37°C (at 2 h cells were elongated with a mean length of ≥6 μm, and at 4 h cells were of normal [≤3.0 μm] length), gene expression analysis of the whole E. coli O157:H7 genome was conducted at these time points (22, 27). Cinnamaldehyde has been reported to bind with FtsZ via its carbonyl group and inhibit FtsZ polymerization and its guanosine-5′-triphosphatase (GTPase) activity (43). Since FtsZ polymerization is dependent on GTP hydrolysis (44), it is possible that inhibition of GTPase activity led to inhibition of septum development and subsequently caused elongation of E. coli O157:H7 cells.
The protein MarR negatively regulates the transcription of the marRAB operon under normal growth conditions. However, inactivation of MarR by antibiotics, oxidizing agents, and phenolic compounds leads to overexpression of the marRAB operon (45). Upregulation of marRAB at 2 h of exposure indicates, as with other oxidizing agents, such as paraquat, sodium salicylate (46), chlorine (41), and reuterin (3-hydroxypropionaldehyde), an antimicrobial compound produced by Lactobacillus reuteri (42), that cinnamaldehyde may also have inhibited the repressive effect of MarR. Coincidently, >15 genes that have been reported to be under the direct or indirect control of MarA (36, 37) were also differentially expressed. Of particular importance were repression of opmF and activation of acrA and tolC expression, which are involved in MarA-mediated antibiotic resistance, and repression of acid resistance genes hdeAB, hdeD, gadE, gadAB, gadC, and gadE. When this effect is considered with the upregulation of other antibiotic resistance genes, namely, acrD, ampC, emrAD, mdtEF, and mdtIJ, at 4 h, enhanced antibiotic resistance following cinnamaldehyde challenge appears probable.
E. coli is known to produce catalase (KatE) and superoxide dismutase (SodA) to remove hydrogen peroxide, superoxide molecules, or other reactive oxygen species and reduce oxidative stress (41). Oxidizing agents like hydrogen peroxide and chlorine have been reported to induce genes responsible for glutathione synthesis in E. coli (39, 41) and enhance its protective response to oxidative stress (47). Furthermore, the reactive oxygen species produced under high oxidative stress can interact with Fe-S clusters, which serve as cofactors in enzymatic proteins, causing their decomposition. To overcome this detrimental effect, E. coli may upregulate the genes for Fe-S cluster assembly (41). In addition to genes for catalase (katE), superoxide dismutase (sodA), glutathione synthetase (gshA), and Fe-S scaffold protein cluster assembly (sufA), genes for biofilm cell signaling protein (bhsA) and periplasmic protein (yhcN), which are upregulated under oxidative stress (39, 42, 46), were also upregulated at 2 h. Dps, a nonspecific DNA-binding protein, not only protects DNA from oxidative damage by binding with it (48) but also protects cells by sequestering iron during oxidative (H2O2) stress (49). In combination with the overexpression of dps at 2 h, the observed downregulation of DNA replication-related genes suggests that cinnamaldehyde negatively affects DNA synthesis in E. coli O157:H7.
Overall, these observations indicate that cinnamaldehyde induced an oxidative stress response in E. coli O157:H7. Many enzymes involved in oxidative stress responses have been reported to reduce the intracellular NADPH level in E. coli, which not only lowers the reducing power of the cells but also inhibits cell multiplication by limiting its biosynthetic capability (46, 50–52). This may explain the observed repression of biosynthetic genes, such as genes for protein synthesis (as indicated by ribosomal and RNA synthesis) and O-antigen synthesis, which have been reported to be important for attachment to plants and for bovine colonization (53, 54), as well as fimbrial synthesis. Furthermore, increased levels of tricarboxylic acid cycle enzymes, including fumC and acnA, that are resistant to oxidative stress (superoxide) (55), suggest that overexpression of these enzymes aids E. coli in combating effects of cinnamaldehyde-induced oxidative stress by increasing the reducing power of E. coli cells via reduction of NAD+ (46). These observations also suggest that detrimental effects of cinnamaldehyde are not limited to the cell membrane (12) and involve the cytoplasm as well.
As with other studies that examined oxidative stress (39, 41, 46), overexpression of genes related to osmotic stress and heat shock at 2 h indicate that different stress response networks either are interconnected or represent cross-regulation by cinnamaldehyde-induced oxidative stress (39, 56). However, with the exception of cold shock genes, these genes were either downregulated or not differentially expressed by 4 h. Nonpersistent upregulation of various stress response genes to cinnamaldehyde exposure indicates that cinnamaldehyde exposure does not necessarily provide cross-protection to other stresses.
Although there was a small but significant reduction in cinnamaldehyde concentration at 2 h that was relatable to extraction efficacy, no new metabolite(s) was detected by RP-HPLC, confirming that cinnamaldehyde was stable up to this point in tests. Thus, transcriptomic changes observed at 2 h were the result of cinnamaldehyde exposure. However, in the presence of E. coli O157:H7 at 4 h, the cinnamaldehyde concentration decreased to ≤10 mg/liter, while cinnamic alcohol increased to ≥120 mg/liter. Since the MIC value of cinnamic alcohol was 4 times higher than that of cinnamaldehyde (400 mg/liter) against this E. coli strain (22), it is evident that the antimicrobial activity of cinnamaldehyde is due mainly to its carbonyl-carrying aldehyde group. E. coli has been reported to overexpress the alcohol dehydrogenase YqhD in the presence of toxic aldehydes as a way to afford protection from them (57–59). Another aldehyde reductase, 2,5-diketo-d-gluconate reductase A (DkgA), is also overexpressed in the presence of aldehydes (59, 60). Both of these enzymes have broader substrate specificity (26, 57, 59, 60), and the genes encoding these enzymes (yqhD and dkgA) were positively regulated by YqhC in the presence of aldehydes, including cinnamaldehyde (59). The observed elevated expression of yqhC, yqhD, and dkgA at 2 h and subsequent conversion of cinnamaldehyde to cinnamic alcohol by E. coli O157:H7 during tests strongly suggests that these enzymes have played a role in this reaction. Furthermore, the shorter growth delay observed during reexposure to 200 mg/liter indicates that preexposure to cinnamaldehyde enables cells to adapt to the inhibitory challenge.
While this is the first study to show that E. coli O157:H7 can convert cinnamaldehyde to cinnamic alcohol, it is known that E. coli has several enzymes that enable phenolic compounds to be utilized as energy sources (61). However, it is unlikely when inhibitory concentrations of cinnamaldehyde are used that its degradation by E. coli O157:H7 can occur.
The conversion of cinnamaldehyde to cinnamic alcohol resulted from the repression of many genes related to stress response and overexpression of genes related to protein synthesis, O-antigen, fimbriae, and lipid A synthesis at 4 h. Reduction of the cinnamaldehyde concentration through its dissimilation by E. coli O157:H7 was likely responsible for its reduced/neutralized inhibition of cell division, which at the molecular level can involve the cell division protein FtsZ (43). Many genes, including those for motility/chemotaxis, cell division cycle/cell shape, DNA synthesis, fatty acid synthesis, F0F1 ATP synthase, as well as the global transcriptional regulator Fis, which positively controls energy metabolism, protein synthesis, and motility during exponential growth (62), were also upregulated. E. coli uses different respiratory enzymes in a hierarchal order, and the enzymes NouA-N, HybABC, and GlpABC preferentially contribute to the generation of proton-motive force by proton pumping during high metabolic fluxes or growth rates (63). The upregulation of these genes observed at 4 h is consistent with the slightly elevated growth rate found between 2 and 4 h of cinnamaldehyde exposure (22, 27) and the increased motility of E. coli O157:H7 on soft-agar plates containing 200 mg/liter cinnamaldehyde.
Based on the transcriptomic data and results of Domadia et al. (43), a model depicting the overall response of E. coli O157:H7 to cinnamaldehyde is presented in Fig. 4. Activation of the MarA-mediated antibiotic resistance network is not included in this model because it would essentially be a reproduction of the model presented by Alekshun and Levy (45).
Fig 4.

Model showing response of E. coli O157:H7 to cinnamaldehyde exposure. As cinnamaldehyde is hydrophobic, it dissolves/diffuses through the cytoplasmic membrane to the cytoplasm (12). There, it inactivates FtsZ by attaching via its carbonyl aldehyde group (43) and subsequently causes cell elongation. The aldehyde group also causes oxidative stress and induces overexpression of oxidative stress response enzymes. These enzymes utilize cellular NADPH for their activity, which leads to depletion of NADPH levels and decreased biosynthetic capability, eventually inhibiting cell multiplication. The protein YqhC senses toxic aldehydes/cinnamaldehyde and induces expression of alcohol dehydrogenase (YqhD) and aldehyde reductase (DkgA) (26, 58–60). These enzymes convert cinnamaldehyde to the less toxic cinnamic alcohol. Loss of the aldehyde group reverses the inhibition of FtsZ as well as oxidative stress. Elongated cells reverse to normal length; cells become metabolically active and motility is restored.
Summary.
The whole-genome transcriptional profiling of E. coli O157:H7 at 2 and 4 h of exposure to cinnamaldehyde revealed substantially different gene expression at each of these intervals. RP-HPLC analysis showed that cinnamaldehyde was stable in the absence of bacteria for 4 h and in their presence for at least 2 h. The transcriptional profile at 2 h showed that cinnamaldehyde induced oxidative stress, as indicated by overexpression of many oxidative stress-related genes, reduced DNA replication, and the synthesis of protein, as well as O-antigens and fimbriae by downregulation of the respective functional genes. E. coli O157:H7 was able to detoxify cinnamaldehyde by its conversion to cinnamic alcohol, probably through use of the dehydrogenases YqhD and DkgA. This is the first study to characterize the transformation of cinnamaldehyde to cinnamic alcohol by E. coli O157:H7, and it suggested that the antimicrobial activity of cinnamaldehyde was mainly attributable to its carbonyl aldehyde group. Evidence was obtained at the molecular level suggesting that cinnamaldehyde challenge increases resistance to antibiotic treatment. Because of cinnamaldehyde degradation by 4 h, many repressive effects on E. coli O157:H7 gene expression were reversed, whereupon cells became more motile and grew at a slightly higher rate.
Supplementary Material
ACKNOWLEDGMENTS
We acknowledge the late D. O. Krause, Department of Animal Science, University of Manitoba, Canada, for his valuable advice on microarray gene expression experiments. We also thank Yang Qiu for providing training and assistance with RP-HPLC analysis, as well as Namita Goswami and Kavitha Palaniappan for providing laboratory assistance.
The study was conducted with financial support through a discovery grant from the Natural Sciences and Engineering Research Council of Canada.
Footnotes
Published ahead of print 26 November 2012
Supplemental material for this article may be found at http://dx.doi.org/10.1128/AEM.02767-12.
REFERENCES
- 1. Rahman MH. 2007. Food preservation: overview, p 3–18 In Rahman MS. (ed), Handbook of food preservation, 2nd ed CRC Press, Boca Raton, FL [Google Scholar]
- 2. Mattick KL, Rowbury RJ, Humphrey TJ. 2003. Morphological changes to Escherichia coli O157:H7, commensal E. coli and Salmonella spp in response to marginal growth conditions, with special reference to mildly stressing temperatures. Sci. Prog. 86:103–113 [DOI] [PMC free article] [PubMed] [Google Scholar]
- 3. Visvalingam J, Gill CO, Holley RA. 2012. The viabilities of cells in cultures of Escherichia coli growing with formation of filaments at 6°C. Int. J. Food Microbiol. 153:129–134 [DOI] [PubMed] [Google Scholar]
- 4. den Besten H, Mols M, Moezelaar R, Zwietering MH, Abee T. 2009. Phenotypic and transcriptomic analysis of mildly and severely salt-stressed Bacillus cereus ATCC 14579 cells. Appl. Environ. Microbiol. 75:4111–4119 [DOI] [PMC free article] [PubMed] [Google Scholar]
- 5. Bereksi N, Gavini F, Benezech T, Faille C. 2002. Growth, morphology and surface properties of Listeria monocytogenes Scott A and LO28 under saline and acid environments. J. Appl. Microbiol. 92:556–565 [DOI] [PubMed] [Google Scholar]
- 6. Nilsson L, Chen Y, Chikindas ML, Huss HH, Gram L, Montville TJ. 2000. Carbon dioxide and nisin act synergistically on Listeria monocytogenes. Appl. Environ. Microbiol. 66:769–774 [DOI] [PMC free article] [PubMed] [Google Scholar]
- 7. Kawarai T, Wachi M, Ogino H, Furukawa S, Suzuki K, Ogihara H, Yamasaki M. 2004. SulA-independent filamentation of Escherichia coli during growth after release from high hydrostatic pressure treatment. Appl. Microbiol. Biotechnol. 64:255–262 [DOI] [PubMed] [Google Scholar]
- 8. Mattick KL, Jorgensen F, Legan JD, Cole MB, Porter J, Lappin-Scott HM, Humphrey TJ. 2000. Survival and filamentation of Salmonella enterica serovar Enteritidis PT4 and Salmonella enterica serovar Typhimurium DT104 at low water activity. Appl. Environ. Microbiol. 66:1274–1279 [DOI] [PMC free article] [PubMed] [Google Scholar]
- 9. Phillips LE, Humphery TJ, Lappin-Scott HM. 1998. Chilling invokes different morphologies in two Salmonella enteritidis PT4 strains. J. Appl. Microbiol. 84:820–826 [DOI] [PubMed] [Google Scholar]
- 10. Jones T, Gill CO, McMullen LM. 2002. The behaviour of log phase Escherichia coli at temperatures below the minimum for sustained growth. Food Microbiol. 19:83–90 [DOI] [PubMed] [Google Scholar]
- 11. Smid EJ, Gorris LGM. 2007. Natural antimicrobials for food preservation, p 237–254 In Rahman MS. (ed), Handbook of food preservation, 2nd ed CRC Press, Boca Raton, FL [Google Scholar]
- 12. Holley RA, Patel D. 2005. Improvement in shelf-life and safety of perishable foods by plant essential oils and smoke antimicrobials. Food Microbiol. 22:273–292 [Google Scholar]
- 13. Pennington H. 2010. Escherichia coli O157. Lancet 376:1428–1435 [DOI] [PubMed] [Google Scholar]
- 14. Buzby JC, Roberts T. 2009. The economics of enteric infections: human foodborne disease costs. Gastroenterology 136:1851–1862 [DOI] [PubMed] [Google Scholar]
- 15. Henson SJ, Majowicz SE, Masakure O, Sockett PN, MacDougall L, Edge VL, Thomas MK, Fyfe M, Kovacs SJ, Jones AQ. 2008. Estimation of costs of acute gastrointestinal illness in British Columbia, Canada. Int. J. Food Microbiol. 127:43–52 [DOI] [PubMed] [Google Scholar]
- 16. Amalaradjou MA, Baskaran SA, Ramanathan R, Johny AK, Charles AS, Valipe SR, Mattson T, Schreiber D, Juneja VK, Mancini R, Venkitanarayanan K. 2010. Enhancing the thermal destruction of Escherichia coli O157:H7 in ground beef patties by trans-cinnamaldehyde. Food Microbiol. 27:841–844 [DOI] [PubMed] [Google Scholar]
- 17. Ayari S, Dussault D, Jerbi T, Hamdi M, Lacroix M. 2012. Radiosensitization of Bacillus cereus spores in minced meat treated with cinnamaldehyde. Radiat. Phys. Chem. 81:1173–1176 [Google Scholar]
- 18. Baskaran SA, Amalaradjou MA, Hoagland T, Venkitanarayanan K. 2010. Inactivation of Escherichia coli O157:H7 in apple juice and apple cider by trans-cinnamaldehyde. Int. J. Food Microbiol. 141:126–129 [DOI] [PubMed] [Google Scholar]
- 19. Juneja VK, Friedman M. 2008. Carvacrol and cinnamaldehyde facilitate thermal destruction of Escherichia coli O157:H7 in raw ground beef. J. Food Prot. 71:1604–1611 [DOI] [PubMed] [Google Scholar]
- 20. Obaidat MM, Frank JF. 2009. Inactivation of Escherichia coli O157:H7 on the intact and damaged portions of lettuce and spinach leaves by using allyl isothiocyanate, carvacrol, and cinnamaldehyde in vapor phase. J. Food Prot. 72:2046–2055 [DOI] [PubMed] [Google Scholar]
- 21. Yossa N, Patel J, Millner P, Lo YM. 2012. Essential oils reduce Escherichia coli O157:H7 and Salmonella on spinach leaves. J. Food Prot. 75:488–496 [DOI] [PubMed] [Google Scholar]
- 22. Visvalingam J, Holley RA. 2012. Temperature-dependent effect of sublethal levels of cinnamaldehyde on viability and morphology of Escherichia coli. J. Appl. Microbiol. 113:591–600 [DOI] [PubMed] [Google Scholar]
- 23. House B, Kus JV, Prayitno N, Mair R, Que L, Chingcuanco F, Gannon V, Cvitkovitch DG, Barnett Foster D. 2009. Acid-stress-induced changes in enterohaemorrhagic Escherichia coli O157: H7 virulence. Microbiology 155:2907–2918 [DOI] [PubMed] [Google Scholar]
- 24. Vidovic S, Mangalappalli-Illathu AK, Korber DR. 2011. Prolonged cold stress response of Escherichia coli O157 and the role of rpoS. Int. J. Food Microbiol. 146:163–169 [DOI] [PubMed] [Google Scholar]
- 25. Smith CK, Moore CA, Elahi EN, Smart AT, Hotchkiss SA. 2000. Human skin absorption and metabolism of the contact allergens, cinnamic aldehyde, and cinnamic alcohol. Toxicol. Appl. Pharmacol. 168:189–199 [DOI] [PubMed] [Google Scholar]
- 26. Atsumi S, Wu TY, Eckl EM, Hawkins SD, Buelter T, Liao JC. 2010. Engineering the isobutanol biosynthetic pathway in Escherichia coli by comparison of three aldehyde reductase/alcohol dehydrogenase genes. Appl. Microbiol. Biotechnol. 85:651–657 [DOI] [PMC free article] [PubMed] [Google Scholar]
- 27. Holley RA, Jeyachchandran V. 2010. Cinnamaldehyde induces cell elongation in Escherichia coli O157:H7. Abstr. 2010 Int. Assoc. Food Prot. Annu. Meet., abstr T3-05 [Google Scholar]
- 28. Blazejczyk M, Miron M, Nadon R. 2007. FlexArray: a statistical data analysis software for gene expression microarrays. Genome Quebec, Montreal, Canada: http://genomequebec.mcgill.ca/FlexArray [Google Scholar]
- 29. Irizarry RA, Hobbs B, Collin F, Beazer-Barclay YD, Antonellis KJ, Scherf U, Speed TP. 2003. Exploration, normalization, and summaries of high density oligonucleotide array probe level data. Biostatistics 4:249–264 [DOI] [PubMed] [Google Scholar]
- 30. Irizarry RA, Bolstad BM, Collin F, Cope LM, Hobbs B, Speed TP. 2003. Summaries of Affymetrix GeneChip probe level data. Nucleic Acids Res. 31:e15. [DOI] [PMC free article] [PubMed] [Google Scholar]
- 31. Huang DW, Sherman BT, Lempicki RA. 2009. Bioinformatics enrichment tools: paths toward the comprehensive functional analysis of large gene lists. Nucleic Acids Res. 37:1–13 [DOI] [PMC free article] [PubMed] [Google Scholar]
- 32. Huang DW, Sherman BT, Lempicki RA. 2009. Systematic and integrative analysis of large gene lists using DAVID Bioinformatics Resources. Nat. Protoc. 4:44–57 [DOI] [PubMed] [Google Scholar]
- 33. Johansson F, Leufven A. 1994. Food packaging polymer films as aroma vapor barriers at different relative humidities. J. Food Sci. 59:1328–1331 [Google Scholar]
- 34. Lane MC, Lockatell V, Monterosso G, Lamphier D, Weinert J, Hebel JR, Johnson DE, Mobley HLT. 2005. Role of motility in the colonization of uropathogenic Escherichia coli in the urinary tract. Infect. Immun. 73:7644–7656 [DOI] [PMC free article] [PubMed] [Google Scholar]
- 35. Affymetrix 2005. GeneChip E. coli genome 2.0 array. Affymetrix, Santa Clara, CA: http://media.affymetrix.com/support/technical/datasheets/ecoli2_datasheet.pdf [Google Scholar]
- 36. Barbosa TM, Levy SB. 2000. Differential expression of over 60 chromosomal genes in Escherichia coli by constitutive expression of MarA. J. Bacteriol. 182:3467–3474 [DOI] [PMC free article] [PubMed] [Google Scholar]
- 37. Ruiz C, McMurry LM, Levy SB. 2008. Role of the multidrug resistance regulator MarA in global regulation of the hdeAB acid resistance operon in Escherichia coli. J. Bacteriol. 190:1290–1297 [DOI] [PMC free article] [PubMed] [Google Scholar]
- 38. Hopkin KA, Papazian MA, Steinman HM. 1992. Functional differences between manganese and iron superoxide dismutases in Escherichia coli K-12. J. Biol. Chem. 267:24253–24258 [PubMed] [Google Scholar]
- 39. Lee J, Hiibel SR, Reardon KF, Wood TK. 2010. Identification of stress-related proteins in Escherichia coli using pollutant cis-dichloroethylene. J. Appl. Microbiol. 108:2088–2098 [DOI] [PubMed] [Google Scholar]
- 40. Reference deleted.
- 41. Wang S, Deng K, Zaremba S, Deng X, Lin C, Wang Q, Tortorello ML, Zhang W. 2009. Transcriptomic response of Escherichia coli O157:H7 to oxidative stress. Appl. Environ. Microbiol. 75:6110–6123 [DOI] [PMC free article] [PubMed] [Google Scholar]
- 42. Schaefer L, Auchtung TA, Hermans KE, Whitehead D, Borhan B, Britton RA. 2010. The antimicrobial compound reuterin (3-hydroxypropionaldehyde) induces oxidative stress via interaction with thiol groups. Microbiology 156:1589–1599 [DOI] [PMC free article] [PubMed] [Google Scholar]
- 43. Domadia P, Swarup S, Bhunia A, Sivaraman J, Dasgupta D. 2007. Inhibition of cell division protein FtsZ by cinnamaldehyde. Biochem. Pharmacol. 74:831–840 [DOI] [PubMed] [Google Scholar]
- 44. Mohammadi T, Ploeger GE, Verheul J, Comvalius AD, Martos A, Alfonso C, van Marle J, Rivas G, den Blaauwen T. 2009. The GTPase activity of Escherichia coli FtsZ determines the magnitude of the FtsZ polymer bundling by ZapA in vitro. Biochemistry 48:11056–11066 [DOI] [PMC free article] [PubMed] [Google Scholar]
- 45. Alekshun MN, Levy SB. 1999. The mar regulon: multiple resistance to antibiotics and other toxic chemicals. Trends Microbiol. 7:410–413 [DOI] [PubMed] [Google Scholar]
- 46. Pomposiello PJ, Bennik MH, Demple B. 2001. Genome-wide transcriptional profiling of the Escherichia coli responses to superoxide stress and sodium salicylate. J. Bacteriol. 183:3890–3902 [DOI] [PMC free article] [PubMed] [Google Scholar]
- 47. Carmel-Harel O, Storz G. 2000. Roles of the glutathione- and thioredoxin-dependent reduction systems in the Escherichia coli and Saccharomyces cerevisiae responses to oxidative stress. Annu. Rev. Microbiol. 54:439–461 [DOI] [PubMed] [Google Scholar]
- 48. Martinez A, Kolter R. 1997. Protection of DNA during oxidative stress by the nonspecific DNA-binding protein Dps. J. Bacteriol. 179:5188–5194 [DOI] [PMC free article] [PubMed] [Google Scholar]
- 49. Ceci P, Cellai S, Falvo E, Rivetti C, Rossi GL, Chiancone E. 2004. DNA condensation and self-aggregation of Escherichia coli Dps are coupled phenomena related to the properties of the N-terminus. Nucleic Acids Res. 32:5935–5944 [DOI] [PMC free article] [PubMed] [Google Scholar]
- 50. Cabiscol E, Tamarit J, Ros J. 2000. Oxidative stress in bacteria and protein damage by reactive oxygen species. Int. Microbiol. 3:3–8 [PubMed] [Google Scholar]
- 51. Krapp AR, Humbert MV, Carrillo N. 2011. The soxRS response of Escherichia coli can be induced in the absence of oxidative stress and oxygen by modulation of NADPH content. Microbiology 157:957–965 [DOI] [PubMed] [Google Scholar]
- 52. Miller EN, Jarboe LR, Turner PC, Pharkya P, Yomano LP, York SW, Nunn D, Shanmugam KT, Ingram LO. 2009. Furfural inhibits growth by limiting sulfur assimilation in ethanologenic Escherichia coli strain LY180. Appl. Environ. Microbiol. 75:6132–6141 [DOI] [PMC free article] [PubMed] [Google Scholar]
- 53. Boyer RR, Sumner SS, Williams RC, Kniel KE, McKinney JM. 2011. Role of O-antigen on the Escherichia coli O157:H7 cells hydrophobicity, charge and ability to attach to lettuce. Int. J. Food Microbiol. 147:228–232 [DOI] [PubMed] [Google Scholar]
- 54. Sheng H, Lim JY, Watkins MK, Minnich SA, Hovde CJ. 2008. Characterization of an Escherichia coli O157:H7 O-antigen deletion mutant and effect of the deletion on bacterial persistence in the mouse intestine and colonization at the bovine terminal rectal mucosa. Appl. Environ. Microbiol. 74:5015–5022 [DOI] [PMC free article] [PubMed] [Google Scholar]
- 55. Storz G, Zheng M. 2000. Oxidative stress, p 47–59 In Storz G, Hengge-Aronis R. (ed), Bacterial stress responses. ASM Press, Washington, DC [Google Scholar]
- 56. Gunasekera TS, Csonka LN, Paliy O. 2008. Genome-wide transcriptional responses of Escherichia coli K-12 to continuous osmotic and heat stresses. J. Bacteriol. 190:3712–3720 [DOI] [PMC free article] [PubMed] [Google Scholar]
- 57. Lee C, Kim I, Lee J, Lee KL, Min B, Park C. 2010. Transcriptional activation of the aldehyde reductase YqhD by YqhC and its implication in glyoxal metabolism of Escherichia coli K-12. J. Bacteriol. 192:4205–4214 [DOI] [PMC free article] [PubMed] [Google Scholar]
- 58. Pérez JM, Arenas FA, Pradenas GA, Sandoval JM, Vásquez CC. 2008. Escherichia coli YqhD exhibits aldehyde reductase activity and protects from the harmful effect of lipid peroxidation-derived aldehydes. J. Biol. Chem. 283:7346–7353 [DOI] [PubMed] [Google Scholar]
- 59. Turner PC, Miller EN, Jarboe LR, Baggett CL, Shanmugam KT, Ingram LO. 2011. YqhC regulates transcription of the adjacent Escherichia coli genes yqhD and dkgA that are involved in furfural tolerance. J. Ind. Microbiol. Biotechnol. 8:431–439 [DOI] [PubMed] [Google Scholar]
- 60. Jeudy S, Monchois V, Maza C, Claverie JM, Abergel C. 2006. Crystal structure of Escherichia coli DkgA, a broad-specificity aldo-keto reductase. Proteins 62:302–307 [DOI] [PubMed] [Google Scholar]
- 61. Diaz E, Ferrandez A, Prieto MA, Garcia JL. 2001. Biodegradation of aromatic compounds by Escherichia coli. Microbiol. Mol. Biol. Rev. 65:523–569 [DOI] [PMC free article] [PubMed] [Google Scholar]
- 62. Bradley MD, Beach MB, de Koning AP, Pratt TS, Osuna R. 2007. Effects of Fis on Escherichia coli gene expression during different growth stages. Microbiology 153:2922–2940 [DOI] [PubMed] [Google Scholar]
- 63. Unden G, Bongaerts J. 1997. Alternative respiratory pathways of Escherichia coli: energetics and transcriptional regulation in response to electron acceptors. Biochim. Biophys. Acta 1320:217–234 [DOI] [PubMed] [Google Scholar]
Associated Data
This section collects any data citations, data availability statements, or supplementary materials included in this article.