Abstract
Full 3D beam profiling and quality assurance (QA) of therapeutic megavoltage linear accelerator (LINAC) x-ray photon beams is not routinely performed due to the slow point-by-point measurement nature of conventional scanning ionization chamber systems. In this study we explore a novel optical-based dose imaging approach using a standard commercial camera, water tank, and fluorescent dye, which when excited by the Čerenkov emission induced by the radiation beam, allows 2D projection imaging in a fast timeframe, potentially leading towards 3D tomographic beam profiling. Detailed analysis was done to optimize the imaging parameters in the experimental setup. The results demonstrate that the captured images are linear with delivered dose, independent of dose rate, and comparison of experimentally captured images to a reference dose distribution for a 4×4 cm 6 MV x-ray photon beam yielded results with improved accuracy over a previous study which used direct imaging and Monte Carlo calibration of the Čerenkov emission itself. The agreement with the reference dose distribution was within 1-2% in the lateral direction, and ± 3 % in the depth direction. The study was restricted to single 2D image projection, with the eventual goal of creating full 3D profiles after tomographic reconstruction from multiple projections. Given the increasingly complex advances in radiation therapy, and the increased emphasis on patient-specific treatment plans, further refinement of the technique could prove to be an important tool for fast and robust QA of x-ray photon LINAC beams.
I. Introduction
Radiotherapy has become increasingly complex with the advent of technologies such as intensity-modulated radiation therapy (IMRT), volumetric-modulation, arc therapies, and image guidance methods. Verification of the prescribed patient-specific treatment plan is an important practice and non-trivial task, with the extent of dosimetry measurements limited largely by the nature of the chosen dosimetry technology (Podgorsak, 2005). In the context of profiling static megavoltage linear accelerator (LINAC) beams for routine quality assurance (QA), typically only a small subset of the full volumetric dose is directly measured by virtue of an ionization chamber measurement in water. Several methods have been proposed to move towards 2D and/or full 3D beam profiling without the use of ionization chambers, including techniques that use plastic or liquid scintillators, as well as gel-based dosimetry (Beddar et al., 1992a; Beddar et al., 1992b; Frelin et al., 2008; Collomb-Patton et al., 2009; Guillot et al., 2011; Kirov et al., 2000; Ponisch et al., 2009; Beddar et al., 2009; Archambault et al., 2012; Maryanski et al., 1994; Maryanski et al., 1996; Kelly et al., 1998; McJury et al., 2000). However, both methods have limitations in that they are not truly water equivalent. Gel dosimetry also requires an external readout method such as magnetic resonance imaging (MRI) or optical computed tomography and is time-sensitive due to post irradiation diffusion of ions (Fricke and Morse, 1927; Schreiner, 2004). In addition, simple LINAC system commissioning is a very time-intensive task, which could be significantly simplified if a fast volumetric beam imaging approach were established. In this study, the initial characterization of such a system is investigated.
Although the existence of Čerenkov effect (optical photons generated as an energetic electron travels faster than the local speed of light in a dielectric medium) during radiation therapy was initially documented two decades ago, historically the phenomenon was only considered a source of noise in scintillation optical dosimetry (Beddar et al., 1992c; Frelin et al., 2008; Liu et al., 2011; Therriault-Proulx et al., 2011). However, a recent study into an optical-based dose imaging modality investigated the direct use of the induced Čerenkov emission in an irradiated water volume as an indirect surrogate for the imparted dose (Glaser et al., 2012a; Čerenkov, 1934; Frank and Tamm, 1937). By capturing images of the resulting light volume from a 6 MV photon beam, a 2D dose profile was obtained for a 4 × 4 cm field size. The method stems from the fact that the net energy loss due to Čerenkov emission per unit path length into all directions is directly proportional to the electron collisional losses per unit path length until a minimum threshold energy, after which Čerenkov emission ceases. In water where the refractive index can be assumed to 1.33, this Čerenkov light is emitted in a 41° thin directional cone along the path of traveling electrons (Ross, 1969). Given the complex distribution of electron trajectories throughout the irradiated medium, there then exists a highly complex and anisotropic phase function describing the angular emission of Čerenkov photons at each spatial location.
A camera detection system placed at some distance from the irradiated medium may only capture a small solid angle of this anisotropic light production, which in turn depends on the spatial location of the point in the object being imaged. Therefore the captured images in the initial study were found to not directly correspond to the imparted dose along the full length of the beam, and a Monte Carlo derived correction factor for the angular dependence of the emission relative to a camera detection system was proposed (Glaser et al., 2012a). An optical system that facilitates the capture of light emitted isotropically from the irradiated water volume would represent a significant improvement to this approach.
In this study, a novel method to eliminate the effects of anisotropic emission is investigated through the introduction of a dilute fluorophore into the water tank, an interaction previously investigated for molecular imaging applications (Dothager et al., 2010). Fluorescence emission from a dissolved fluorophore is known to be isotropic, and thus measuring the light emitted from a fluorophore excited by the Cerenkov light is expected to be representative of the imparted dose distribution without the Monte Carlo calibration factor proposed previously (Glaser et al., 2012a). The proposed design would utilize the fact that Čerenkov light absorbed by the fluorophore is given off isotropically, such that a camera from any angle would receive a substantially similar image of the light. The optical images of Čerenkov-stimulated fluorescence would then be proportional to the electron energy loss resulting in local energy deposition, which are in turn proportional to the deposited dose throughout most of the useful therapeutic energy range of LINACs.
This study examines the key factors in the selection of a fluorophore and gives a thorough analysis to the optimal imaging geometry for the proposed system. The recorded data is compared to pre-measured percent depth dose (PDD) curves and lateral profiles obtained from a clinical treatment planning system (TPS) and serves as a first demonstration of the concept for using Čerenkov-stimulated fluorescence to rapidly image x-ray photon LINAC beams in a water tank using a standard commercial optical camera.
2. Materials and methods
2.1.1. Experimental setup
All experiments were conducted using a clinical LINAC (Varian 2100CD, Varian Medical Systems, Palo Alto, CA). The LINAC was calibrated such that 1 monitor unit (MU) was equivalent to 1 cGy of dose at z = dmax for a 10 × 10 cm 6 MV beam. In addition, an output factor for field sizes other than the 10 × 10 cm beam used in this calibration is required (i.e. for the 4 × 4 cm beam used in the majority of the experiments in this study, 1 MU is equivalent to 0.925 cGy at z = dmax).
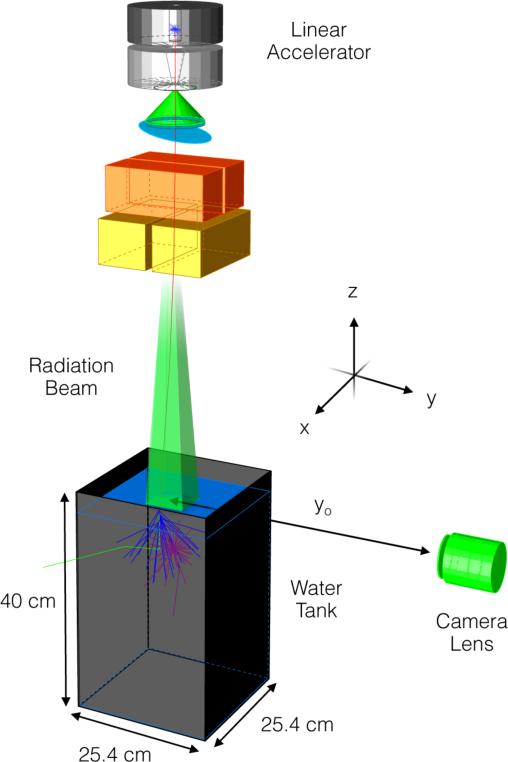
The experimental setup was comprised of a water tank (25.4 × 25.4 × 40 cm) filled with tap water to a height of 32 cm, and a peripherally placed camera (Canon EOS Rebel T3i, Canon U.S.A., Lake Success, NY) shown in figure 1. The commercial CMOS camera, capable of capturing 16-bit high-resolution 18 Megapixel images (5184 × 3456) with red, green, and blue (RGB) channels, was coupled to a variable focal length telephoto zoom lens (Canon EF-S 55-250 mm f/4-5.6 IS, Canon U.S.A., Lake Success, NY) with a minimum working distance of 1.1 m. The camera was remotely controlled via a computer placed outside of the treatment room using the camera-specific drivers and the supplied EOS Utility software (Canon U.S.A., Lake Success, NY). Images were captured in the Canon-specific raw format (.CR2) and converted to a lossless image format (.TIF) using the Canon Digital Photo Professional software (Canon U.S.A., Lake Success, NY). In the process, the gamma correction typically applied during image conversion was disabled to allow for a linear mapping of recorded raw intensities to image pixel values. In addition, during conversion pre-existing data available within the software on image aberrations for the particular camera and lens combination used in this study was applied to correct for vignetting and radial distortion.
Figure 1.
Experimental setup consisting of a glass tank filled with water placed under a medical LINAC (SSD = 100 cm) with a CMOS camera and lens placed at a distance yo from beam center. A single x-ray (red) generated at the target travels downward into the water tank and Compton scatters out of the tank (green). The secondary electron emits Cerenkov photons (blue), which are absorbed by a fluorescent dye and emitted isotropically (purple). Note that the dimensions are for illustration purposes and not to scale and the global coordinate axes referenced throughout the text is as shown.
For all experiments, the camera line of sight was aligned to the water surface (SSD = 100 cm) to avoid surface reflection artifacts and all lights in the treatment room were turned off to avoid a high level of undesirable background counts. The orientation of the axes with the z-axis representing the depth direction, the x-axis the lateral direction, and the y-axis the length direction relative to the camera is consistent with all axes references made throughout this study.
2.1.2. Imaging parameters
When imaging a 3D object in the form of a 2D image, the resulting projection will exhibit perspective error, or parallax (i.e., the parts of the object closest to the lens will appear larger than those farthest from the lens). In the context of capturing a 2D projection of a rectangular LINAC beam, the horizontal distance, Δx over which the front and back end of the beam appear separated can be determined geometrically as
| (1) |
where yo is the distance from the lens to the center of the object being imaged, wx is the physical width of the beam in the lateral x-direction, and wy is the width of the beam in the direction parallel to the camera viewing direction. In deriving (1), the rectangular beam projection is assumed symmetric and horizontally centered within the camera FOV.
The depth of field (DOF) for a camera lens system can be similarly characterized by the proximal, dp and distal, dd, distances of the DOF
| (2) |
where f is the focal length of the lens, F is the f-number of the lens, and c is assumed to be the size of a pixel on the CMOS sensor (4.3 μm for the camera used in this study) (Beddar et al., 2009). When considering quantitatively accurate optical beam profiling, both the parallax error and DOF should be optimized such that Δx is smaller than the desired dose grid and the DOF is greater than wy to avoid out-of-focus imaging of the beam.
For all images captured in this study (unless otherwise noted), yo was chosen to be 1.7 m, f was set to 55 mm, and a F5.6 aperture was used, resulting in a DOF of 4.5 cm and FOV of approximately 60 × 40 cm (0.115 mm per pixel). This imaging geometry would therefore be adequate for imaging a 4 × 4 cm beam with a parallax error of 0.47 mm to a depth of 20 cm (the usable portion of the vertical FOV is halved due to centering of the lens at the water surface). In addition, all images in this study were acquired at 6400 ISO with a 10 sec. exposure time and subject to a dark frame subtraction of identical imaging parameters. Unless otherwise noted, only the blue channel of each RGB image was used for analysis.
2.2.1. Fluorophore selection
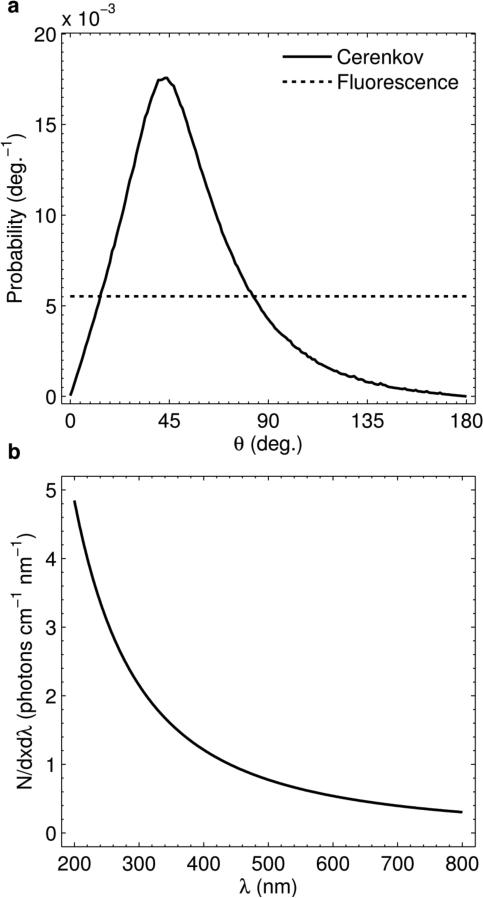
In order to capture spatially accurate 2D images of the imparted dose in a medium, a fluorophore was used in this study to convert the anisotropic Čerenkov emission to isotropic fluorescent light. The polar angle phase function of Čerenkov emission for a 4 × 4 cm 6 MV LINAC beam (calculated using Monte Carlo simulations in a previous study and measured relative to the z-axis in figure 1) is compared to isotropic fluorescence in figure 2(a). The cumulative probability in both curves is normalized to 1. The critical factors in choosing a suitable fluorophore for this application are:
- The absorption spectrum of the fluorophore should ideally match the Čerenkov emission spectrum to provide an efficient means of converting the anisotropic Čerenkov emission to isotropic fluorescent light. The excitation spectrum in this case is given by the Frank-Tamm formula, which describes N, the number of Čerenkov photons generated per unit length, dx, per unit wavelength, dλ, as
where α is the fine structure constant, β is the phase velocity of the electron, n is the refractive index of the medium, and λ is the wavelength of emitted light (Frank and Tamm, 1937; Čerenkov, 1937). (3) is plotted in figure 2(b) for a 3 MeV electron traveling through water between 200 – 800 nm in which the refractive index has been assumed to be a spectrally constant 1.33. The spectrum is inversely proportional to the square of the emission wavelength and therefore an ideal fluorophore would contain large peaks in the ultraviolet (UV) and/or blue visible wavebands.(3) - The peak absorption coefficient of the added fluorophore must be large enough to ensure that the imaged fluorescent light distribution does not blur with respect to the initial distribution of Čerenkov light. In the absence of scattering, light transport in the presence of an absorber is described by Beer's law, which gives the intensity of transmitted light as a function of distance traveled as
where Io is the initial light intensity, and It is the transmitted light intensity after a distance l, and μa is the absorption coefficient of the absorber given as the product of ε, the molar extinction coefficient of the fluorophore (cm-1·M-1), and C, the concentration of the fluorophore (Wang and Wu, 2007). Therefore the absorption coefficient is directly proportional to and limited by the concentration of the fluorophore, which is itself limited in these experiments by the fluorophore water solubility. For a chosen fluorophore concentration, the photon mean free path is given as the inverse of the absorption coefficient and may serve as an estimate for the blurring of the fluorescence relative to a point source of Čerenkov emission.(4) The Stokes shift between the fluorophore absorption and emission peaks should ideally be large, to avoid re-absorption of fluorescent light by the fluorophore itself, which would result in multiple fluorescent events for a single photon, thereby blurring the beam edge. Few dyes have a large Stokes shift, as it is much more common to have overlapping excitation and emission spectra, unless the dye becomes more polar when excited, or if there are multiple singlet excitation resonance bands across the spectrum. However, there are several dyes that do have near complete separation of their excitation in the UV/blue and emission at longer wavelengths.
The quantum yield of the fluorophore must be high in order to reduce loss in the already weak Čerenkov emission (on the order of pW to nW per cm2) (Axelsson et al., 2011; Glaser et al., 2012b). Fluorescent yields above 10-20% are typically considered very strong.
Figure. 2.
(a) Polar angle phase function for light emission of Čerenkov and fluorescence photons. Both curves are normalized to a cumulative probability of unity. (b) Theoretical spectrum per cm traveled per nm of emission for Čerenkov light in the 200 – 800 nm range for a 3 MeV electron traveling through water.
2.2.2. Fluorescence experiments
Given the above criterion two common fluorophores, Fluorescein (Fluorescein sodium salt, Sigma-Aldrich, St. Louis, MO) and Quinine Sulfate (Quinine hemisulfate monohydrate, Alfa Aesar, Ward Hill, MA) were investigated. Basic characteristics of both are given in Table I. The extinction coefficient of each in water was measured using a spectrophotometer (Varian Cary 50 Bio UV/Visible Spectrophotometer, Varian Medical Systems, Australia) using 1 cm path length UV compatible quartz cuvettes (Spectrecology, Jasper, GA). Absorption measurements were made from 200 – 800 nm with a 1 nm spectral resolution. Fluorescence spectra in water were measured similarly in the 200 – 800 nm waveband using a fluorometer (SPEX FluoroMax3, Horiba Scientific, Edison, NJ) with 180 nm excitation. In addition, white light images were obtained of a 4 × 4 cm 6 MV beam operating at 600 MU/min for a delivered dose of 100 MU for fluorophore dilutions of 0.001, 0.01, 0.1, and 1.0 g/L for Fluorescein, and 0, 0.01, 0.1, and 1.0 g/L for Quinine Sulfate to qualitatively evaluate the relationship between concentration and the spatial distribution of imaged light.
Table 1.
Fluorophore properties
| Fluorescein | Quinine Sulfate | |
|---|---|---|
| Chemical Formula | C20H10Na2O5 | C20H24N2O2 • 0.5 H2SO4 • H2O |
| Molecular Weight (g/mol) | 376.27 | 391.47 |
| Water Solubility (g/L) | 1.0 | 1.2 |
| Quantum Yield | 0.79a | 0.55b |
Kellog et al. (1964)
Eaton et al. (1988)
Note that the chemical composition of both fluorescent dyes does not include high atomic number elements and is therefore not expected to significantly change the attenuation properties of the water. Furthermore, even at the highest concentration of 1.0 g/L, the mass fraction of the dilute fluorophore relative to the water is 1:1000.
2.3.1. Noise characteristics
One limitation in the imaging of therapeutic LINAC beams is noise induced in the CCD or CMOS sensor due to stray radiation (Archambault et al., 2008). Unlike photons in the eV energy range which result in intensity counts which are localized to a single pixel and independent of the photon energy, excess x-rays photons from the LINAC which strike the sensor result in a non-localized bloom of counts which are directly proportional to the x-ray energy (Janesick, 2001). Therefore, megavoltage x-rays photons, which are most likely to penetrate the camera exterior result in hotspots in the recorded image, which are non-trivial to remove due to their non-localized nature. Several methods have been explored, with the optimal being temporal median filtering (Archambault et al., 2008; Glaser et al, 2012a). The disadvantage in temporal filtering is increased imaging times, which degrade the main advantage of optical imaging over other beam profiling modalities.
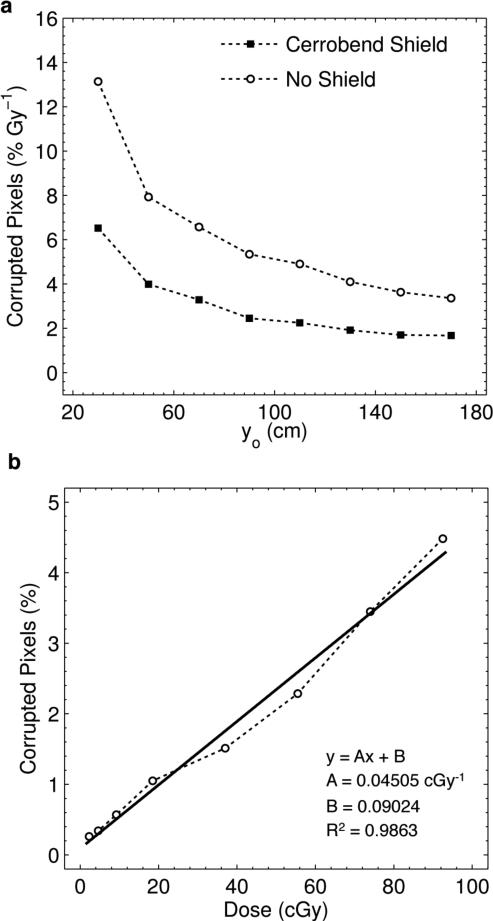
An alternative method for noise reduction would be to shield the camera and or increase the distance between the camera and the LINAC beam (x-ray photon generation can be approximated as a point source at the LINAC target and therefore noise should fall off inversely with the square of the imaging distance). To explore both of these possibilities, measurements were made of a 4 × 4 cm 6 MV beam operating at 600 MU/min for a total delivered dose of 100 MU with and without a 1.9 cm thick shield casted with a commercial shielding alloy (Cerrobend, Med-Tec, Orange City, IA) placed around the camera in which yo was varied from 0.3 – 1.7 m in 0.2 m increments. In all images the lens cap was affixed to prevent recording optical light and isolate counts due only to stray radiation. The percent noise was quantified in each case by first fitting a histogram (32 counts per bin) of the read noise intensity in a beam of dark frame to a Gaussian distribution to approximate the range of expected background counts. Using a six-sigma criterion, the mean number of counts plus three standard deviations of the corresponding Gaussian fit was used as a threshold, such that the percentage of the total number of pixels in each beam on image above this value was considered corrupted by the stray radiation.
2.3.2. Noise linearity
To explore the linearity of the calculated noise with delivered dose, the percent noise was calculated using the same procedure as described in Sec. 2.3.1. for delivered doses of 2.5, 5, 10, 20, 40, 80, and 100 MU at a distance of 1.7 m with no shielding.
2.4.1. Dose linearity
Any viable beam profiling modality should respond linearly with dose. For this study, the relationship between pixel intensity and delivered dose was evaluated by capturing images of a 4 × 4 cm 6 MV beam in water with 1.0 g/L of Quinine Sulfate with no camera shielding, and evaluating the mean pixel value in a 1 × 500 pixel region of interest (ROI) centered at z = dmax, assumed to be 1.5 cm (Podgorsak, 2005). The dose rate was set to 600 MU/min for delivered doses of 2.5, 5, 10, 20, 40, 60, 80, and 100 MU.
2.4.2. Signal to noise ratio
Using the same images and ROI as in Sec. 2.4.1. the signal to noise ratio (S/N) was evaluated as the ratio of the mean and standard deviation intensity for the given ROI.
2.4.3. Dose rate dependence
The dose rate dependence of the proposed modality was tested using a similar experimental setup as Sec. 2.4.1-2. by evaluating the standard deviation and maximum difference of the given ROI. However, in this case a constant dose of 50 MU was delivered and the dose rate was set to 100, 200, 300, 400, 500, and 600 MU/min. In order to image the full dose at lower dose rates, the exposure time of the camera in these experiments was increased to 30 seconds.
2.5.1. Field size dependence
To explore the effect of field size on the captured images, measurements were made by varying both dimensions of the beam field size from 4 – 10 cm in 2 cm increments for a 6 MV beam operating at 600 MU/min for a delivered dose of 100 MU incident on water with a concentration of 1.0 g/L Quinine Sulfate and no camera shielding.
2.5.2. Dose profile comparison
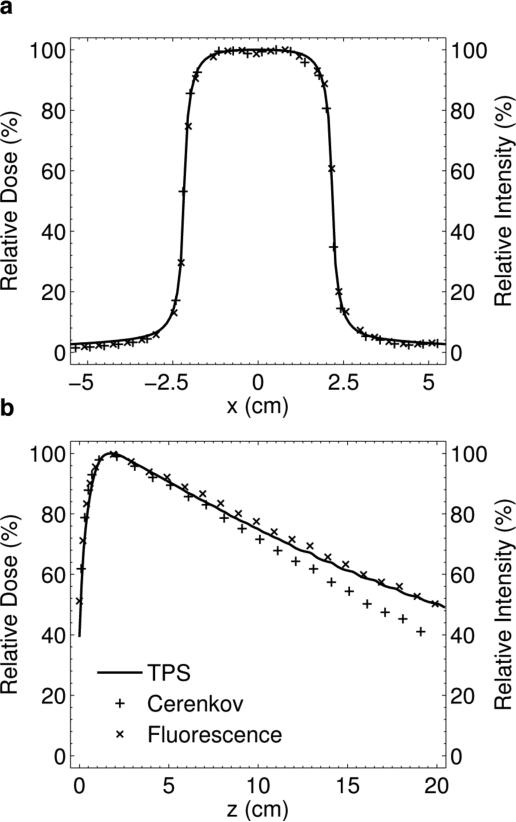
To examine the accuracy of the proposed method, a horizontal line profile through the beam at z = dmax for the 4 × 4 cm 6 MV beam measured in Sec. 2.5.1. was compared to a commensurate dose distribution obtained from the Eclipse (Varian Medical Systems, Palo Alto, CA) TPS on a 1 mm dose grid. To imitate the projection captured by the camera, the resulting dose distribution from the TPS was linearly summed in the y-direction, a valid simplification given the DOF and perspective error calculated from (1) and (2) for the chosen imaging parameters and beam size. In addition, the PDD profile was compared to the TPS and a commensurate image acquired in the absence of a fluorophore for depths of 0 – 20 cm.
2.6. Image-processing
All images in Sec. 2.5. were subject to a multi-step image-processing scheme. In order to remove the stray radiation noise from the acquired images, a 7 × 7 pixel median filter was applied to each single image at full resolution. Images were then cropped to a 20 × 20 cm FOV (to provide data with a lateral range of -10 to 10 cm, and vertical range of 0 to 20 cm) and then down sampled to a resolution of 1 mm per pixel using bicubic interpolation. Note the 7 × 7 pixel median filter was chosen such that the spatial extent of the filter at the full camera resolution (0.8 × 0.8 mm) would be less than the resolution of the final 1 mm per pixel down sampled image to avoid any systematic blurring induced by the spatial median filter.
Images were then processed using a bilateral filter, an edge-preserving smoothing operation that replaces the intensity at the pixel of interest with a weighted average of intensity values from neighboring pixels within a given kernel (Tomasi and Manduchi, 1988). The weighted average depends on a Gaussian distribution in both the spatial and intensity domains (distance and relative counts between pixels under consideration) and is controlled through two set standard deviation values, σs and σi. The bilateral filter kernel size was set to 7 × 7 pixels and the phase space of σs and σi was explored to find the optimal values of σs and σi for the given experimental setup (3.4 pixels and 1000 counts respectively).
3. Results
3.1. Fluorescence experiments
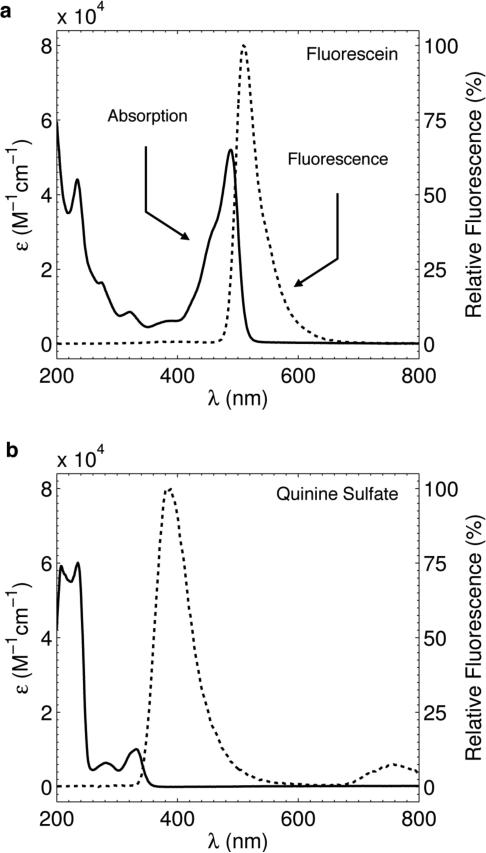
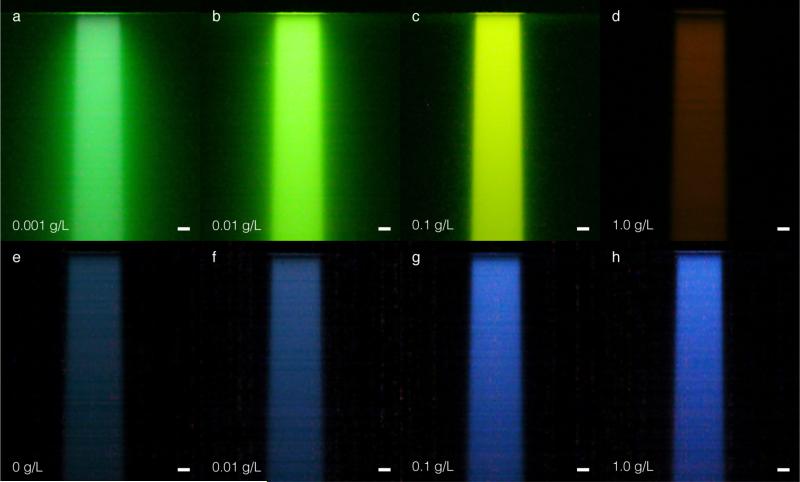
The measured absorption and fluorescence spectral profiles for both Fluorescein and Quinine Sulfate are shown in figures 3(a) and 3(b) respectively. Both fluorophores contain large absorption peaks in the UV – blue, consistent with the first requirement for a suitable fluorophore given the Čerenkov emission excitation profile in figure 2(b). In addition, both fluorophores have high reported quantum yields as is shown in Table I (Note the quantum yield stated for Quinine Sulfate is in acidic solution and some minor differences may exist in water due to a pH difference) (Kellogg and Bennett, 1964; Eaton, 1988). However, Fluorescein also contains a large absorption peak in the 400 – 500 nm range, which exhibits a small Stoke's shift with respect to the fluorescence emission in the 480 – 600 nm range. The 20 nm band of overlap between absorption and fluorescence, combined with Fluorescein's high quantum yield and therefore ability to propagate multiply fluoresced photons makes it a poor candidate for fluorescence mediated Čerenkov beam profiling. On the other hand, Quinine Sulfate does not exhibit a large secondary absorption peak and the primary absorption occurs at a large Stoke's shift from the fluorescent peak at 400 nm. These observations are consistent with the raw white light images in figure 4.
Figure 3.
(a) Measured absorption (solid) and fluorescence emission (dashed) profiles for Fluorescein in water. (b) Corresponding profiles for Quinine Sulfate in water.
Figure 4.
In (a) – (d) raw white light images captured with a commercial CMOS camera for Fluorescein at the indicated increasing concentrations. In (e) the captured raw white light image of Čerenkov emission induced in the water tank in the absence of a fluorescent dye. In (f)– (h) raw white light images for increasing concentrations of Quinine Sulfate. The bars in (a) – (h) represent 1 cm.
As the Fluorescein concentration is increased, the extent of beam blurring decreases. However, the color of the captured light also shifts from green, to yellow, to red. This is an indication that the Fluorescein is reabsorbing its emitted fluorescence, and the fluorescence emerging from the irradiated water volume is increasingly red-shifted within the Fluorescein fluorescence emission profile. Unlike Fluorescein, the beam profiles obtained for Quinine Sulfate do no exhibit blurring due to self-absorption and appear to get brighter and sharper as the absorption coefficient in (4) increases. The profiles appear brighter due to more efficient conversion of the anisotropic phase function to isotropic fluorescence emission towards the camera (the probability for fluorescence emission is approximately two times greater than Čerenkov emission near 90° camera capture angle, see figure 2). In addition, the profile appears sharpest at the 1.0 g/L concentration, where the mean free path for photons in the 200 – 250 nm range is approximately 0.07 mm.
3.2. Noise measurements
The calculated values for noise as a function of distance from beam center are shown in figure 5(a) for both the unshielded and shielded cases. The mean and standard deviation of the acquired dark frame background were found to be approximately 100 and 300 counts respectively, resulting in a threshold of 600 counts for noise calculations. As expected, the percent noise decreases with increasing distances from the beam center. At all distances, the shield effectively halves the amount of stray radiation noise. However, due to the inverse square nature of the noise with increasing distance, the benefits of the shield diminish with distance.
Figure 5.
(a) Calculated percent noise per Gy of delivered dose as a function of camera distance yo for the shielded and unshielded camera. Note, the relationship with yo does not exactly follow the invese square law, as yo is measured from camera lens to beam center, yet the true point source of stray radiation is located a distance SSD = 100 cm above the beam center. (b) Results and linear regression analysis for the percent noise as a function of delivered dose at a camera distance of 1.7 m.
For example, the noise present at 1.7 m with no shield is equivalent to the shielded case at 0.7 m, and even at 1.7 m the shield only provides a 1.7% reduction in noise. Therefore, given the chosen imaging distance of 1.7 m, the shielding was removed from the camera. In addition, in figure 5(b) linear regression indicates a strong linear relationship between the noise and delivered dose. The stray radiation noise increases at a rate of 0.045 % per cGy at a distance of 1.7 m, and the expected near zero intercept reinforces the validity and accuracy of the noise calculation method used in this study.
3.3.1. Dose linearity and signal to noise ratio
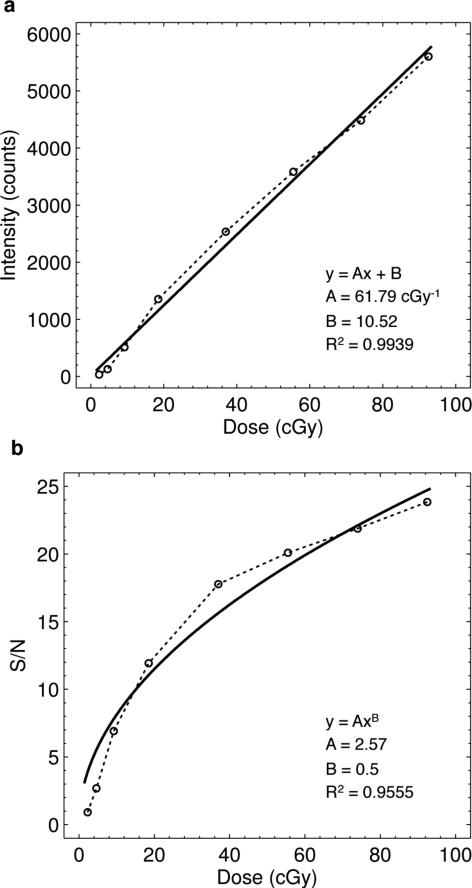
Figure 6(a) shows the results for the mean pixel intensity versus delivered dose for the 1 × 500 pixel ROI centered at z = dmax. Linear regression analysis indicates a strong relationship between the intensity of detected light and delivered dose, although a slight non-linearity exists. The slope shows a collection efficiency of 62 counts per cGy of delivered dose. The efficiency of this parameter is specific to the given imaging setup, parameters and geometry (i.e., ISO setting, object distance, camera lens, and fluorophore). The intercept of 10.5 counts is within the range of dark frame background counts calculated in Sec. 3.2. Given the 16-bit dynamic range of the sensor, the regression indicates that the sensor intensity would saturate at approximately 10 Gy.
Figure 6.
(a) Results and linear regression analysis for the relationship between captured intensity and delivered dose for a ROI centered at z = dmax. (b) Calculated S/N for the same ROI as a function of delivered dose. A fit to the expected square root trend is shown.
Results for the signal-to-noise ratio measurements are plotted in figure 6(b). As the mean intensity of the chosen ROI increases linearly with dose, the signal-to-noise ratio increases as a square root function per Poisson photon counting statistics. This is confirmed by regression analysis in which the parameter B was fixed to 0.5 to represent the theoretically expected signal-to-noise relationship as a function of delivered dose. The results indicate that below 5 cGy, the S/N of the given experimental setup is low (i.e., less than 5), but surpasses 10 at a delivered dose of just 20 cGy, approaching 25 at 100 cGy.
3.3.2. Dose rate dependence
The mean and standard deviation in intensity for the given ROI during a 30 sec. exposure for a delivered dose of 50 MU at various dose rates were found to be 5512 and 104 counts respectively, indicating a minor 2% change for dose rates varying from 100 – 600 MU/min. In addition, the maximum difference between any two dose rate measurements was 198 counts. The scatter in recorded intensity values is primarily due to inter-pixel noise and variation on the camera sensor (see S/N results in Sec. 3.3.1.), although minor differences within 1% for successive irradiations are expected in the actual delivered dose of the LINAC.
3.4.1. Field size dependence
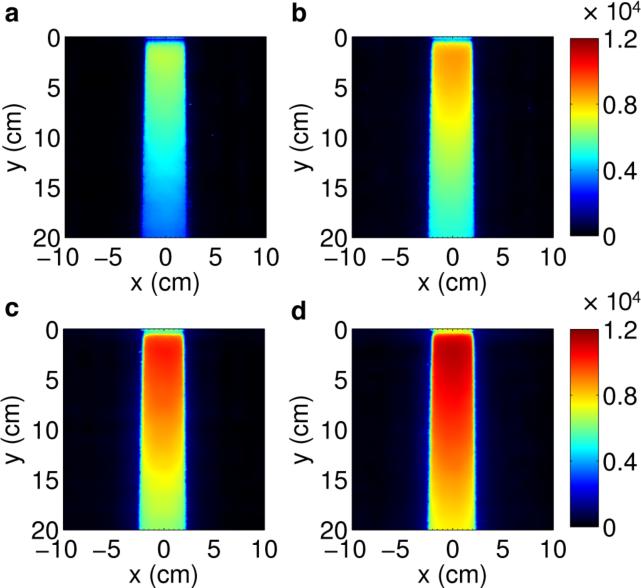
Due to the fact that optical imaging of the fluorescent light from a radiation beam is effectively a projection or summation of the light produced in the beam in the direction parallel to the viewing direction of the camera (in this case the y-direction, see figure 1), an increase in the beam length indicates an increased length over which the projection is summed. Figure 7 shows this trend in the captured projections for a 4 cm wide 6MV beam with 4 – 10 cm lengths. With increasing length, the intensity at all regions in the beam increases linearly and demonstrates the ability of optical imaging to profile beams of varying length.
Figure 7.
Projection images for a (a) 4 × 4 cm, (b) 4 × 6 cm, (c) 4 × 8 cm, and (d) 4 × 10 cm 6 MV beam. All images are shown on the same color scale.
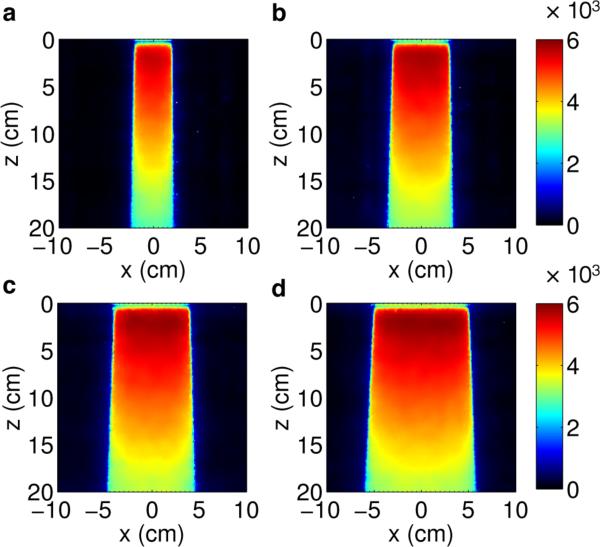
Similarly, figure 8 shows the results for a beam 4 cm in length with widths of 4 – 10 cm. In this case, the constant 4 cm length results in projections, which are similar in intensity. However, the increasing width of the beam in the x-direction can clearly be seen in captured images. These changes are proportional to and agree with the prescribed field widths and are symmetric with respect to the central axis of the beam.
Figure 8.
Projection images for a (a) 4 × 4 cm, (b) 6 × 4 cm, (c) 8 × 4 cm, and (d) 10 × 4 cm 6 MV beam. All images are shown on the same color scale.
3.4.2. Dose Profile Comparison
Given the imaging parameter optimization in Sec. 2.1.2. the 4 × 4 cm 6 MV beam was chosen for analysis. The dimensions of this beam are such that the expected parallax error from (1) is within the chosen 1 mm imaging resolution, and the beam length is within the DOF of the lens calculated from (2). The results for a horizontal profile comparison between the Čerenkov emission with and without 1.0 g/L of Quinine Sulfate, and the TPS for a commensurate beam at z = dmax are shown in figure 9(a). The two profiles are in very good agreement as they differ by less than 1% within 2 cm from the central axis, and by less than 2% in the penumbra.
Figure 9.
(a) Lateral profile comparison between the intrinsic Čerenkov emission, fluorescent optical light, and TPS at z = dmax. (b) Vertical PDD profile comparison of the TPS, fluorescent light, and Čerenkov emission in the absence of a fluorophore.
Results for the PDD comparison between the TPS, fluorescence light, and Čerenkov light in the absence of a fluorophore are shown in figure 9(b). Errors exist in the buildup region, for both optical profiles, and the intensity of light in the first 1 mm is artificially high due to the presence of a meniscus at the water surface and the glass tank wall. At depths beyond dmax the raw Čerenkov light profile underestimates the dose due to the anisotropic light emission. Addition of the fluorophore effectively corrects this error by redistributing the Čerenkov photons isotropically. At all depths beyond dmax, the dose difference is within ± 3 %.
4. Discussion
The results in this study offer several improvements over a previous proof of concept study into the use of Čerenkov emission for 2D beam profiling of megavoltage x-ray photon LINAC beams (Glaser et al., 2012a). Our initial study suggested that the net energy loss due to Čerenkov radiation was directly proportional to the secondary electron collisional losses in high-energy x-ray photon beams above the threshold energy for the Čerenkov effect. However, images captured with a conventional lens effectively sample different solid angles of emission from each spatial location within the irradiated medium. The high directionality of the Čerenkov emission along a particular polar angle relative to the scattered electron direction of propagation leads to a distorted image of the imparted dose, which was previously corrected using a Monte Carlo derived correction factor. In addition, significant spatial dose discrepancies existed due to neglect of the lens DOF and parallax, and the FOV in previous measurements limited the range of measurable depths to 10 cm.
Here, a novel method for correcting the angular distribution of Čerenkov light using a fluorophore is demonstrated for the first time. Based on the absorption spectrum, peak absorption coefficient, stokes shift, and quantum yield, Quinine Sulfate was selected as the optimal fluorophore for Čerenkov-excited fluorescence due to its absorption in the UV where the majority of Čerenkov photons are emitted, large peak absorption coefficient to reduce blurring of the light distribution, wide stokes shift to avoid re-absorption of the fluorophore by itself, and high quantum yield to reduce losses in the already weak Čerenkov signal. In addition, the previously observed spatial errors in the lateral dose profile comparison due to the lens DOF and parallax were reduced to within 1% in the present study through careful selection of the imaging parameters and geometry.
Furthermore, previous measurements relied on a high cost gated intensified CCD system to rapidly acquire frames and remove noise through temporal median filtering (Glaser et al., 2012a). In this current study, a moderate cost commercial CMOS camera was used and a spatial median filter on a single image was found to be adequate in removing stray radiation noise due to the high pixel resolution of the captured images (i.e., a larger median filtering kernel was feasible). In addition, continued indirect irradiation of the camera results in degradation of the CMOS sensor quality (i.e., irradiated pixels may become corrupted and stuck in that they read out the same intensity regardless of imaging conditions), and therefore prolonged use of the proposed dosimetry system would eventually require replacement of the camera itself. Therefore, a moderate cost commercial CMOS camera is more desirable than a high cost scientific grade CCD system. Furthermore, although shielding reduced the noise level by a factor of two, only a 1.7% reduction in noise was observed at the chosen camera distance of 1.7 m. Therefore, due to the potentially heavy weight of a shield in a future system design and the ability to effectively remove image noise in the absence of shielding, an external camera shield is likely unnecessary.
Baseline measurements were made to characterize the performance of the system for beam profiling. The captured fluorescent light intensity was found to be near linear with dose up to 100 cGy. The slight non-linearity observed in this study is likely due to the fact that in general, commercial CMOS cameras exhibit non-linear response functions. Therefore, the near-linear results in figure 6 represent only a small portion of the 16-bit dynamic range of the camera and the dose linearity across the entire dynamic range cannot be directly inferred. This will be investigated and potentially calibrated for in future studies by experimentally measuring the entire camera response function. In addition for the given experimental setup, the system-specific relationship between counts and cGy was calculated to be 62, indicating that for the 16-bit camera used a maximum dose of 10 Gy could be imaged before saturating the sensor, although this could be raised by reducing the ISO sensitivity of the camera.
The S/N was also evaluated and found to surpass 10 at 20 cGy, increasing with the square root of delivered dose per Poisson photon counting statistics. The dose rate independence of the system was confirmed and found to be within 2% agreement (limited by the camera sensor's S/N for a given delivered dose) for dose rates between 100 – 600 MU/min.
To demonstrate the accuracy and viability of the proposed dosimetry modality, a 4 × 4 cm 6 MV x-ray photon beam was analyzed, both for its relevance in radiotherapy and direct comparison to results from the previous study. Comparison of a horizontal profile at dmax to the TPS showed results within a 1% dose discrepancy within 2 cm of the central axis, and within 2% in the penumbra. Analysis of the PDD for the optical methods with and without a fluorophore to the TPS showed comparable accuracy in the absence of a Monte Carlo correction factor (i.e., the fluorophore effectively altered the angular distribution of Čerenkov light yielding a profile more indicative of the true PDD). However, the ± 3% error observed in the PDD is still higher than a desired accuracy of within 1%.
One explanation for the discrepancy could be in the light transport governing the conversion of initial Čerenkov light into fluorescent photons. Given the predominately forward directed Čerenkov emission, (see figure 2), the Beer's law probability for absorption of Čerenkov light by the fluorophore is most prevalent in the forward depth direction. Similar to a conventional point spread function of a camera, which is typically radially symmetric, this would result in a secondary non-symmetric point spread function peaked in the forward direction relative to the direction of the beam. Convolution of this point-spread function with the expected dose distribution would lead to errors in the observed PDD.
Additional sources of error could include reflection and or refraction at the water, glass, air interface, as well as background contamination from Čerenkov emission at wavelengths outside the absorption peak of the Quinine Sulfate, which still reach the CMOS sensor and contribute to the spatial distribution of captured light. In a sense, this portion of the Čerenkov light becomes a source of contamination, analogous to the stem effect in plastic scintillation dosimetry and could be reduced by using an optical filter centered on the fluorescent emission peak, or fully removed using spectral or temporal methods (Frelin et al., 2008; Liu et al., 2011; Therriault-Proulx et al., 2011). All three potential sources of error will be investigated in a future study.
5. Conclusions
In this follow-up study to previous work we have used a commercial CMOS camera to capture 2D projection images of isotropically-emitted fluorescent light excited by Čerenkov emission in a water tank to indirectly image the imparted dose in the medium. Through careful consideration and optimization of the experiment geometry and imaging parameters, dose differences of 1-2% in the lateral direction, and ± 3% in the depth were obtained. Performance characteristics of the proposed modality were evaluated, and the system was found to be linear with dose, dose rate independent, and able to effectively remove stray radiation noise in the absence of shielding at a distance of 1.7 m. Further refinement of the system and extension to full 3D tomographic reconstructions may provide a fast and flexible method for LINAC beam QA.
Acknowledgements
This work has been financially supported by NIH grant R01CA109558.
References
- Archambault L, Briere TM, Beddar S. Transient noise characterization and filtration in CCD cameras exposed to stray radiation from a medical linear accelerator. Med Phys. 2008;35:4342–51. doi: 10.1118/1.2975147. [DOI] [PMC free article] [PubMed] [Google Scholar]
- Archambault L, Poenisch F, Sahoo N, Robertson D, Lee A, Gillin MT, Mohan R, Beddar S. Verification of proton range, position, and intensity in IMPT with a 3D liquid scintillator detector system. Med Phys. 2012;39:1239–46. doi: 10.1118/1.3681948. [DOI] [PMC free article] [PubMed] [Google Scholar]
- Axelsson J, Davis SC, Gladstone DJ, Pogue BW. Cerenkov emission induced by external beam radiation stimulates molecular fluorescence. Med Phys. 2011;38:4127–32. doi: 10.1118/1.3592646. [DOI] [PMC free article] [PubMed] [Google Scholar]
- Beddar AS, Mackie TR, Attix FH. Water-equivalent plastic scintillation detectors for high-energy beam dosimetry: I. Physical characteristics and theoretical considerations. Phys Med Biol. 1992a;37:1883–900. doi: 10.1088/0031-9155/37/10/006. [DOI] [PubMed] [Google Scholar]
- Beddar AS, Mackie TR, Attix FH. Water-equivalent plastic scintillation detectors for high-energy beam dosimetry: II. Properties and measurements. Phys Med Biol. 1992b;37:1901–13. doi: 10.1088/0031-9155/37/10/007. [DOI] [PubMed] [Google Scholar]
- Beddar AS, Mackie TR, Attix FH. Cerenkov Light Generated in Optical Fibers and Other Light Pipes Irradiated by Electron-Beams. Phys Med Biol. 1992c;37:925–35. [Google Scholar]
- Beddar S, Archambault L, Sahoo N, Poenisch F, Chen GT, Gillin MT, Mohan R. Exploration of the potential of liquid scintillators for real-time 3D dosimetry of intensity modulated proton beams. Med Phys. 2009;36:1736–43. doi: 10.1118/1.3117583. [DOI] [PMC free article] [PubMed] [Google Scholar]
- Čerenkov PA. Visible light from pure liquids under the impact of γ-rays. Cr Acad Sci Urss. 1934;2:451–7. [Google Scholar]
- Čerenkov PA. Visible Radiation Produced by Electrons Moving in a Medium with Velocities Exceeding that of Light. Physical Review. 1937;52:378–9. [Google Scholar]
- Collomb-Patton V, Boher P, Leroux T, Fontbonne JM, Vela A, Batalla A. The DOSIMAP, a high spatial resolution tissue equivalent 2D dosimeter for LINAC QA and IMRT verification. Med Phys. 2009;36:317–28. doi: 10.1118/1.3013703. [DOI] [PubMed] [Google Scholar]
- Dothager RS, Goiffon RJ, Jackson E, Harpstrite S, Piwnica-Worms D. Cerenkov radiation energy transfer (CRET) imaging: a novel method for optical imaging of PET isotopes in biological systems. PloS one. 2010;5 doi: 10.1371/journal.pone.0013300. [DOI] [PMC free article] [PubMed] [Google Scholar]
- Eaton DF. International Union of Pure and Applied Chemistry Organic Chemistry Division Commission on Photochemistry. Reference materials for fluorescence measurement. Journal of photochemistry and photobiology. B, Biology. 1988;2:523–31. doi: 10.1016/1011-1344(88)85081-4. [DOI] [PubMed] [Google Scholar]
- Frank I, Tamm I. Coherent visible radiation of fast electrons passing through matter. Cr Acad Sci Urss. 1937;14:109–14. [Google Scholar]
- Frelin AM, Fontbonne JM, Ban G, Colin J, Labalme M, Batalla A, Vela A, Boher P, Braud M, Leroux T. The DosiMap, a new 2D scintillating dosimeter for IMRT quality assurance: characterization of two Cerenkov discrimination methods. Med Phys. 2008;35:1651–62. doi: 10.1118/1.2897966. [DOI] [PubMed] [Google Scholar]
- Fricke H, Morse S. The chemical action of roentgen rays on dilute ferrosulphate solutions as a measure of dose. Am J Roentgenol Radi. 1927;18:430–2. [Google Scholar]
- Glaser AK, Zhang R, Davis SC, Gladstone DJ, Pogue BW. Time-gated Cherenkov emission spectroscopy from linear accelerator irradiation of tissue phantoms. Opt Lett. 2012a;37:1193–5. doi: 10.1364/OL.37.001193. [DOI] [PMC free article] [PubMed] [Google Scholar]
- Glaser AK, Davis SC, McClatchy DM, Zhang R, Pogue BW, Gladstone DJ. Projection imaging of photon beams by Čerenkov emission imaging. Med Phys. 2012b doi: 10.1118/1.4770286. (in the press) [DOI] [PMC free article] [PubMed] [Google Scholar]
- Guillot M, Beaulieu L, Archambault L, Beddar S, Gingras L. A new water-equivalent 2D plastic scintillation detectors array for the dosimetry of megavoltage energy photon beams in radiation therapy. Med Phys. 2011;38:6763–74. doi: 10.1118/1.3664007. [DOI] [PubMed] [Google Scholar]
- Janesick JR. Scientific charge-coupled devices. SPIE - The International Society for Optical Engineering; 2001. [Google Scholar]
- Kellogg RE, Bennett RG. Radiationless Intermolecular Energy Transfer III. Determination of Phosphorescence Efficiencies. J Chem Phys. 1964;41:3042. [Google Scholar]
- Kelly RG, Jordan KJ, Battista JJ. Optical CT reconstruction of 3D dose distributions using the ferrous-benzoic-xylenol (FBX) gel dosimeter. Med Phys. 1998;25:1741–50. doi: 10.1118/1.598356. [DOI] [PubMed] [Google Scholar]
- Kirov AS, Shrinivas S, Hurlbut C, Dempsey JF, Binns WR, Poblete JL. New water equivalent liquid scintillation solutions for 3D dosimetry. Med Phys. 2000;27:1156–64. doi: 10.1118/1.598993. [DOI] [PubMed] [Google Scholar]
- Liu PZ, Suchowerska N, Lambert J, Abolfathi P, McKenzie DR. Plastic scintillation dosimetry: comparison of three solutions for the Cerenkov challenge. Phys Med Biol. 2011;56:5805–21. doi: 10.1088/0031-9155/56/18/003. [DOI] [PubMed] [Google Scholar]
- Maryanski MJ, Schulz RJ, Ibbott GS, Gatenby JC, Xie J, Horton D, Gore JC. Magnetic-Resonance-Imaging of Radiation-Dose Distributions Using a Polymer-Gel Dosimeter. Phys Med Biol. 1994;39:1437–55. doi: 10.1088/0031-9155/39/9/010. [DOI] [PubMed] [Google Scholar]
- Maryanski MJ, Ibbott GS, Eastman P, Schulz RJ, Gore JC. Radiation therapy dosimetry using magnetic resonance imaging of polymer gels. Med Phys. 1996;23:699–705. doi: 10.1118/1.597717. [DOI] [PubMed] [Google Scholar]
- McJury M, Oldham M, Cosgrove VP, Murphy PS, Doran S, Leach MO, Webb S. Radiation dosimetry using polymer gels: methods and applications. Brit J Radiol. 2000;73:919–29. doi: 10.1259/bjr.73.873.11064643. [DOI] [PubMed] [Google Scholar]
- Podgorsak EB. Radiation Oncology Physics: A Handbook for Teachers and Students. International Atomic Energy Agency; Vienna: 2005. [Google Scholar]
- Ponisch F, Archambault L, Briere TM, Sahoo N, Mohan R, Beddar S, Gillin MT. Liquid scintillator for 2D dosimetry for high-energy photon beams. Med Phys. 2009;36:1478–85. doi: 10.1118/1.3106390. [DOI] [PMC free article] [PubMed] [Google Scholar]
- Ross HH. Measurement of β-Emitting Nuclides Using Cerenkov Radiation. Analytical Chemistry. 1969;41 [Google Scholar]
- Schreiner LJ. Review of Fricke gel dosimeters. Journal of Physics: Conference Series. 2004;3:9–21. [Google Scholar]
- Therriault-Proulx F, Beddar S, Briere TM, Archambault L, Beaulieu L. Technical Note: Removing the stem effect when performing Ir-192 HDR brachytherapy in vivo dosimetry using plastic scintillation detectors: A relevant and necessary step. Medical Physics. 2011;38:2176–9. doi: 10.1118/1.3562902. [DOI] [PMC free article] [PubMed] [Google Scholar]
- Tomasi C, Manduchi R. Bilateral Filtering for Gray and Color Images.. IEEE International Conference on Computer Vision; Bombay, India. 1988. [Google Scholar]
- Wang HV, Wu H. Biomedical Optics: Principles and Imaging. John Wiley & Sons, Inc.; 2007. [Google Scholar]


