SUMMARY
Chromium (Cr3+) supplementation facilitate normal protein, fat and carbohydrate metabolism, and is widely used by public in many countries. This study examined the effect of chromium niacinate (Cr-N) or chromium picolinate (Cr-P) supplementation on lipid peroxidation (LP), TNF-α, IL-6, CRP, glycosylated hemoglobin (HbA1), cholesterol and triglycerides (TG) in diabetic rats. Diabetes (D) was induced in Sprague Dawley rats by streptozotocin (STZ) (ip, 65 mg/kg BW). Control buffer, Cr-N or Cr-P (400 µg Cr/Kg BW) was administered by gavages daily for 7 wks. Blood was collected by heart puncture using light anesthesia. Diabetes caused a significant increase in blood levels of TNF-α, IL-6, glucose, HbA1, cholesterol, TG and LP. Compared with D, Cr-N supplementation lowered the blood levels of TNF-α (p=0.04), IL-6 (p=0.02), CRP (p=0.02) LP (p=0.01), HbA1 (p=0.02), TG (p=0.04) and cholesterol (p=0.04). Compared with D, Cr-P supplementation showed a decrease in TNF-α (p=0.02), IL-6 (p=0.02) and LP (p=0.01). Chromium niacinate lowers blood levels of pro-inflammatory cytokines (TNF-α, IL-6, CRP), oxidative stress and lipids levels in diabetic rats, and appears to be more effective form of Cr3+-supplementation. This study suggests that Cr3+-supplementation can lower risk of vascular inflammation in diabetes.
Keywords: Chromium, pro-inflammatory cytokines, glycemia, oxidative stress, vascular inflammation, diabetes
INTRODUCTION
Vascular inflammation and cardiovascular disease (CVD) are the leading causes of morbidity and mortality in the diabetic population and remain major public health issues. The pro-inflammatory cytokines tumor necrosis factor-alpha (TNF-α) and interleukin-6 (IL-6) and oxidative stress are widely recognized markers of vascular inflammation (1–6). The levels of these cytokines and oxidative stress are elevated in the blood of many diabetic patients (2, 7–10). An increase in circulating levels of TNF-α and IL-6 is known to decrease insulin sensitivity and increase vascular inflammation and the development of CVD (2–6, 11, 12). Previous studies with diabetic patients and diabetic animals have reported decreased blood glucose, decreased blood cholesterol and triglyceride or decreased insulin requirements after Cr3+-supplementation (13–36). It has been proposed that chromium supplementation increases a chromium-containing oligopeptide present in insulin-sensitive cells that binds to the insulin receptor, markedly increasing the activity of the insulin-stimulated tyrosine kinase and phosphorylation of insulin receptor substrate-1 and glucose transporter GLUT4 (37–40).
The molecular mechanism by which chromium supplementation may increase insulin sensitivity and lower vascular inflammation in diabetes is not known. Previous studies demonstrate that chromium supplementation inhibits the increase in TNF-α and oxidative stress levels in cultured monocytes exposed to high glucose levels (41, 42). The inhibitory effect of chromium on TNF-α secretion in monocytes has also been observed in H2O2-treated monocytes and appears to be associated with the antioxidative effect of chromium (41). However, no previous study has examined the effect of trivalent chromium supplementation on the blood levels of TNF-α, IL-6 and CRP in diabetic patients or in animal models of diabetes.
The present study examined the hypothesis that trivalent chromium supplementation lowers pro-inflammatory cytokines and oxidative stress levels in diabetes. To examine this hypothesis, we studied the effect of chromium and placebo supplementation in a streptozotocin-treated diabetic rat model. We determined the effect of supplementation with commercially available forms of chromium, chromium niacinate (Cr-N) and chromium picolinate (Cr-P) on blood levels of TNF-α, IL-6, CRP, glycosylated hemoglobin, total cholesterol, triglycerides, and oxidative stress in diabetic rats. We also examined the effects of chromium and placebo on liver function markers and red cell indices in the blood of diabetic rats.
RESEARCH DESIGN AND METHODS
All the procedures followed were in accordance with the ethical standards of the institution and that approval was obtained from the animal welfare committee of the institution. Male Sprague Dawley rats were purchased at 49–52 days of age (200–220 gm) from Harlan (Indianapolis, IN) and allowed 2 days for environmental and trainer handling acclimation. The rats were weighed then fasted overnight before intraperitoneal injection of 65 mg/kg streptozotocin in citrate buffer (pH=4.5). Control rats were injected with citrate buffer alone to serve as a normal control group # 1. The rats were tested for hyperglycemia by measuring their blood glucose concentration at 3 and 7 days following the streptozotocin injections. Blood for the blood glucose was obtained via tail incision and measured using an advantage Accu-chek glucometer (Boehringer Mannheim Corp., Indianapolis, IN). The rats that became hyperglycemic (blood glucose>300 mg/dl) were randomly divided into 3 groups (n=6): group #2: diabetic controls; group # 3: 400 µg Cr (Cr-N)/kg body weight; group #4: 400 µg Cr (CrP)/kg body weight. Each rat was supplemented the appropriate dose of chromium daily for 7 weeks by oral gavage using 20G feeding needles (Popper and Sons, New Hyde Park, NY). The diabetic controls were supplemented with a 0.03M NaOH buffer. Chromium niacinate (ChromeMate, lot #0410013) was obtained from InterHealth Nutraceutical (Benicia, CA) and chromium picolinate (Chromax, lot #00225720) was obtained from Nutrition 21 (Purchase, NY). Chromium niacinate (Cr-N) or Chromium Picolinate (Cr-P) was mixed in 0.03M NaOH buffer. Chromium niacinate and chromium picolinate were obtained pure and each group of rats had same dose chromium supplementation and was calculated based on the molecular weight and chromium content supplied on the label by the manufacturer. Weight and blood glucose concentrations were monitored weekly. The chromium supplementation dose was adjusted every week according to any change in body weight to maintain similar chromium dose per Kg BW of rat over the entire period of study for each group. The rats were maintained under standard housing conditions at 22 ± 2°C with 12:12-h light/dark cycles with a standard 8640 lab chow diet (Harlan, Indianapolis, IN). At the end of 7 weeks the rats were fasted overnight then euthanized for analysis by exposure to halothane (2-bromo-2-chloro-1,1,1-trifluoroethane). Blood was collected via heart puncture with a 19½ gauge needle into EDTA vacutainer tubes. Plasma was isolated after centrifuging blood in a cold centrifuge at 1500 rpm for 10 minutes.
Cytokines assay
TNF-α, IL-6, and CRP levels in the plasma were determined by the sandwich ELISA method using a commercially available kit from Pierce-Endogen (Rockford, IL). All appropriate controls and standards as specified by the manufacturer’s kit were used; the data are expressed as pg per ml plasma. In the cytokine assay, control samples were analyzed each time to check the variation from plate to plate on different days of analyses.
Lipid peroxidation
Oxidative stress was determined by measuring malondialdehyde (an end product of lipid peroxidation) by its reaction with thiobarbituric acid (43, 44). For this purpose, 0.2 ml plasma were suspended in 0.8 ml phosphate-buffered saline and 0.025 ml butylated hydroxytoluene (88 mg/10 ml absolute alcohol). Thirty percent trichloroacetic acid (0.5 ml) was then added. The tubes were vortexed and allowed to stand on ice for at least 2 hours, then centrifuged at 2000 rpm for 15 min. For each sample, 1 ml supernatant was transferred to a new tube. To each of these was added 0.25 ml 1% TBA in 0.05 N NaOH. The tubes were then mixed and kept in a boiling water bath for 15 min. The concentration of the MDA-TBA complex was assessed using HPLC after its separation with ion exclusion and a reverse-phase Shodex KC-811 column (Waters) with the UV/Vis detector set at 532nm (43, 44).
Measurement of glycosylated hemoglobin (HbA1) and glucose
The human erythrocyte is freely permeable to glucose, and within each erythrocyte, glycosylated hemoglobin is formed continuously from hemoglobin A at a rate dependent on the ambient glucose concentration. Glycosylated hemoglobin was determined using Glyco-Tek Affinity column kits and reagents (cat # 5351) purchased from Helena Laboratories (Beaumont, Texas). Glucose levels were determined using glucose oxidase by Accu-check Advantage glucometer (Boehringer Manheim Corporation, Indianapolis, IN).
Liver function tests, blood cell count and blood chemistry profile
A portion of blood from rats in each group was sent to the clinical laboratory of LSUHSC-Shreveport (located in the same building) for clinical tests to determine liver function, red blood cell counts, and chemistry profiles (triglycerides; total- , LDL- and HDL- cholesterol; glucose).
All chemicals were purchased from Sigma Chemical Co. (St. Louis, MO) unless otherwise mentioned. Data were analyzed statistically using unpaired Student’s ’t’ tests between different groups using Sigma Plot statistical software (Jandel Scientific, San Rafael, CA). A p value of less than 0.05 was considered significant.
RESULTS
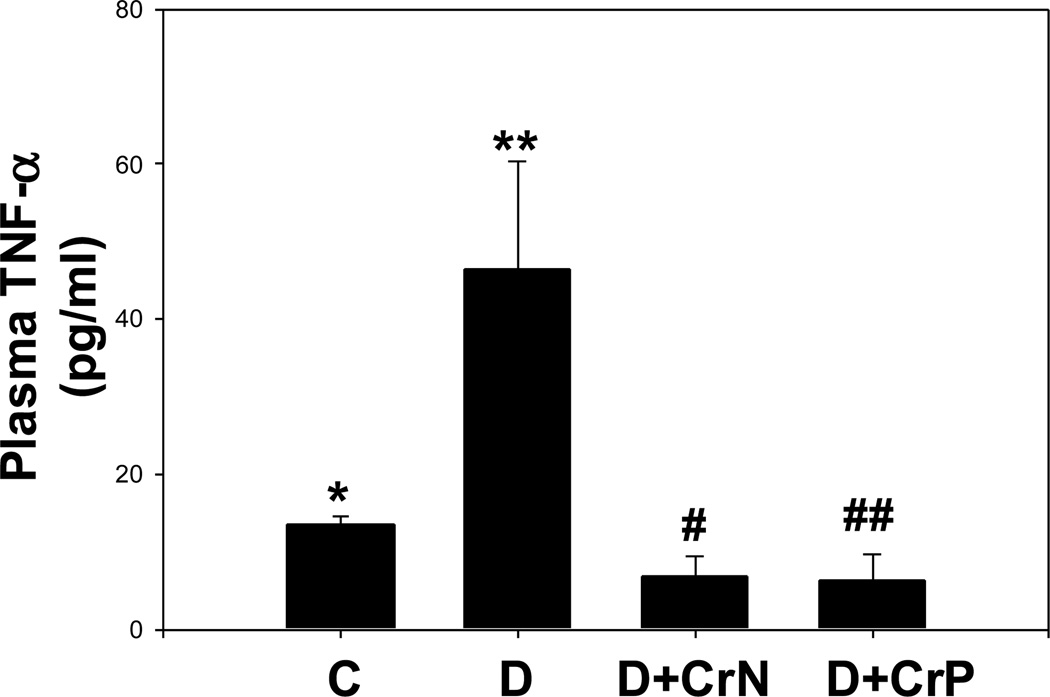
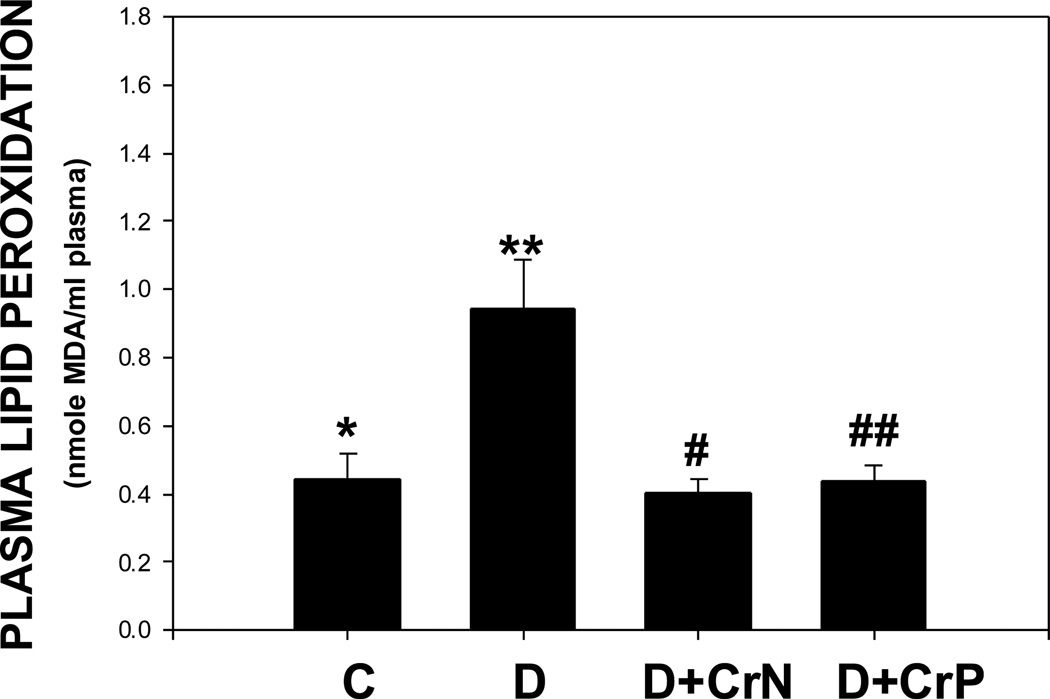
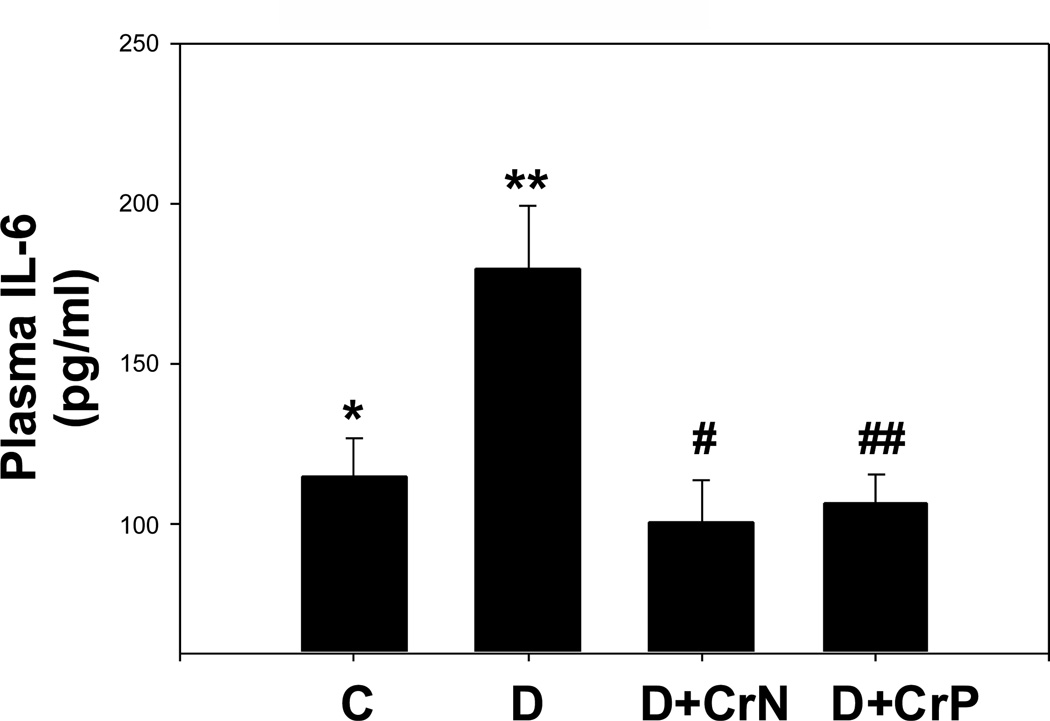
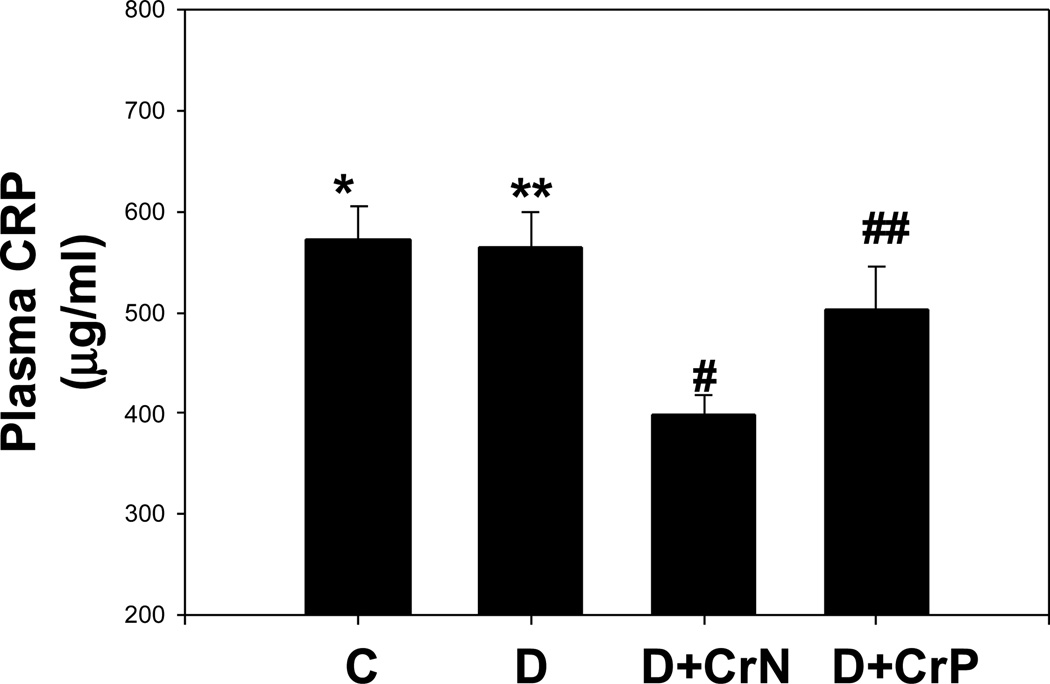
Figures 1–4 illustrate the effect of diabetes and chromium niacinate and chromium picolinate supplementation on TNF-α (Figure 1), IL-6 (Figure 2), CRP (Figure 3) and lipid peroxidation (Figure 4) levels in the blood of diabetic rats. There was a significant increase in TNF-α, IL-6 and lipid peroxidation levels in blood of diabetic rats compared with that of control rats. However, this was prevented in diabetic rats supplemented with chromium niacinate and chromium picolinate. This suggests that chromium supplementation can lower circulating level of markers of vascular inflammation in diabetes. The blood levels of CRP were not elevated in diabetic rats compared with those of controls (Figure 3). However, while chromium niacinate supplementation significantly lowered the CRP level in diabetic rats (Figure 3), this effect was not observed in diabetic rats supplemented with chromium picolinate.
Figure 1.
Effect of chromium niacinate and chromium picolinate supplementation on plasma TNF-α levels in STZ-treated diabetic rats. Values are Mean±SE. C, control; D, diabetic, D+CrN: Cr-N-treated D; D+Cr-P, Cr-P-treated diabetic rats. Rats were supplemented with control-buffer, Cr-N (400 µg Cr/kg BW) or Cr-P (400 µg Cr/Kg BW) by gavages daily for 7 wks. Differences between values marked * versus** (p<0.02), **versus# (p<0.04), **versus## (p<0.04) are significant.
Figure 4.
Effect of chromium niacinate and chromium picolinate supplementation on plasma lipid peroxidation levels in STZ-treated diabetic rats. Values are Mean±SE. C, control; D, diabetic, D+CrN: Cr-N-treated D; D+Cr-P, Cr-P-treated diabetic rats. Rats were supplemented with control-buffer, Cr-N (400 µg Cr/kg BW) or Cr-P (400 µg Cr/Kg BW) by gavages daily for 7 wks. Differences between values marked * versus** (p<0.02), **versus# (p<0.02), **versus## (p<0.02) are significant.
Figure 2.
Effect of chromium niacinate and chromium picolinate supplementation on plasma IL-6 levels in STZ-treated diabetic rats. Values are Mean±SE. C, control; D, diabetic, D+CrN: Cr-N-treated D; D+Cr-P, Cr-P-treated diabetic rats. Rats were supplemented with control-buffer, Cr-N (400 µg Cr/kg BW) or Cr-P (400 µg Cr/Kg BW) by gavages daily for 7 wks. Differences between values marked * versus** (p<0.02), **versus# (p<0.02), **versus## (p<0.02) are significant.
Figure 3.
Effect of chromium niacinate and chromium picolinate supplementation on plasma CRP levels in STZ-treated diabetic rats. Values are Mean±SE; C, control; D, diabetic, D+CrN: Cr-N-treated D; D+Cr-P, Cr-P-treated diabetic rats. Rats were supplemented with control-buffer, Cr-N (400 µg Cr/kg BW) or Cr-P (400 µg Cr/Kg BW) by gavages daily for 7 wks. Differences between values marked **versus# (p<0.02) are significant.
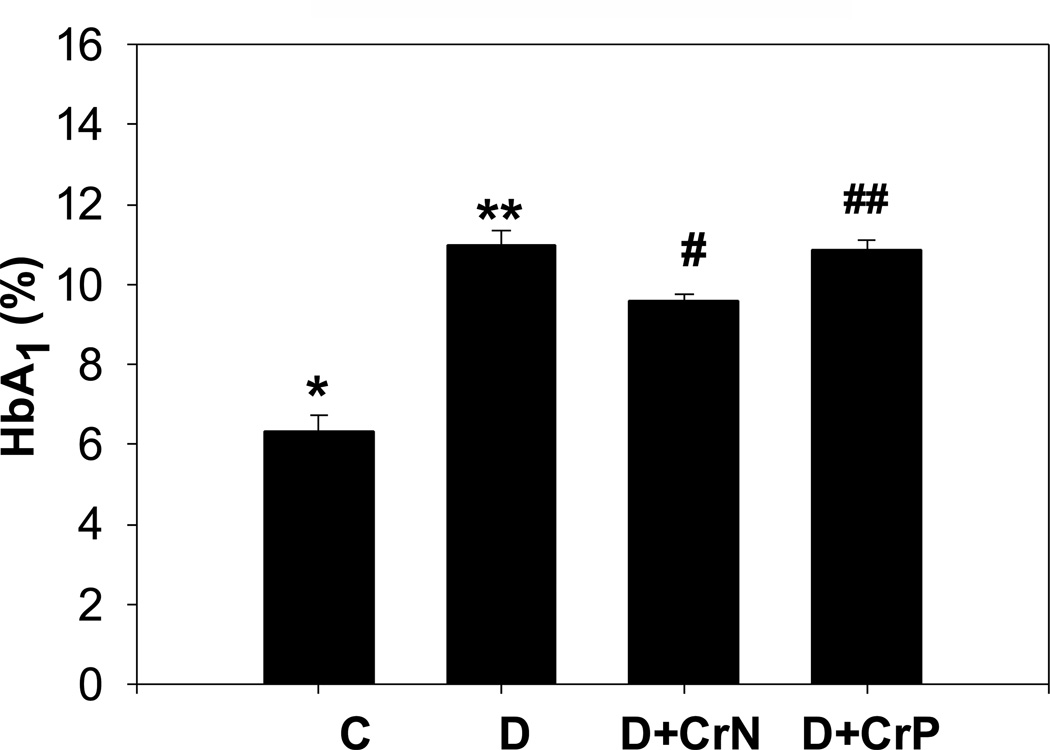
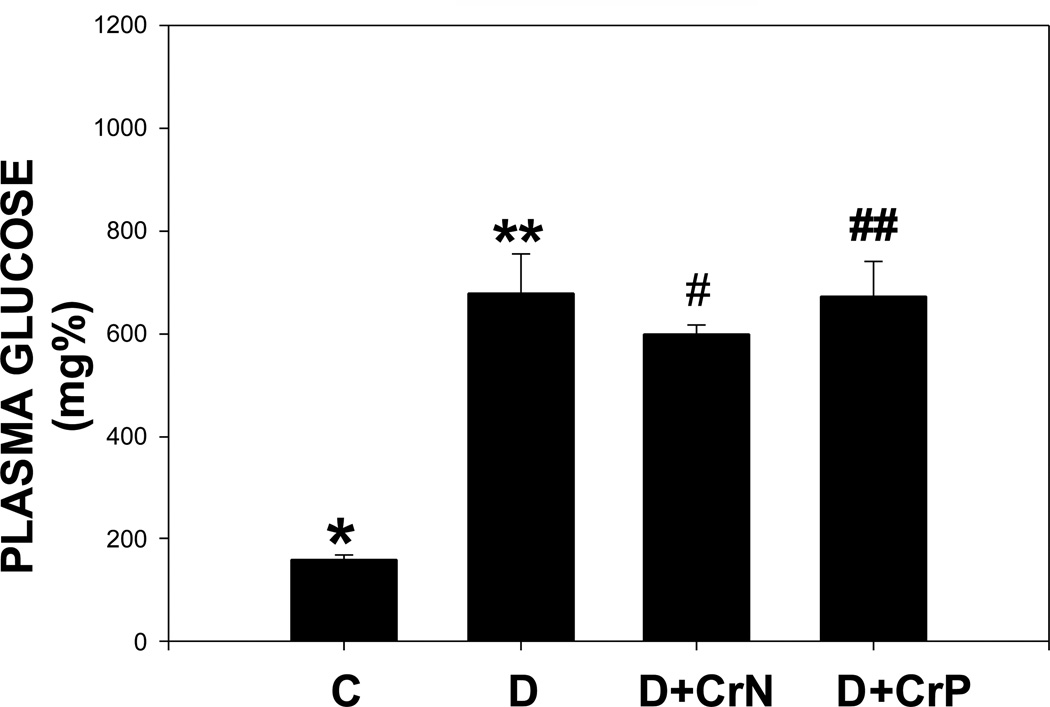
The effect of chromium niacinate and chromium picolinate supplementation on glycated hemoglobin and blood glucose levels is shown in Figures 5 and 6. Figure 5 shows that there was a modest but significant decrease in glycated hemoglobin level in chromium niacinate supplemented compared with placebo supplemented diabetic rats. Chromium picolinate supplementation did not have any effect on the glycated hemoglobin levels of diabetic rats. Neither chromium niacinate nor chromium picolinate had any significant effect on blood glucose levels in diabetic rats (Figure 6).
Figure 5.
Effect of chromium niacinate and chromium picolinate supplementation on blood HbA1 levels in STZ-treated diabetic rats. Values are Mean±SE. C: control; D: diabetic; D+CrN, Cr-N-treated D; D+Cr-P, Cr-P treated diabetic rats. Rats were supplemented with control-buffer, Cr-N (400 µg Cr/kg BW) or Cr-P (400 µg Cr/Kg BW) by gavages daily for 7 wks. Differences between values marked *versus** (p<0.001), and **versus# (p<0.05) are significant.
Figure 6.
Effect of chromium niacinate and chromium picolinate supplementation on plasma glucose levels in STZ-treated diabetic rats. Values are Mean±SE. C: control; D: diabetic; D+CrN, Cr-N-treated D; D+Cr-P, Cr-P treated diabetic rats. Rats were supplemented with control-buffer, Cr-N (400 µg Cr/kg BW) or Cr-P (400 µg Cr/Kg BW) by gavages daily for 7 wks. Differences between values marked *versus** (p<0.01) are significant.
Table I shows that neither form of chromium affected hemoglobin, hematocrit or RBC counts in diabetic rats, which rules out any role of altered red cell survival on lower glycosylated hemoglobin levels in chromium niacinate supplemented diabetic rats.
Table 1.
Effect of Chromium Supplementation on Blood he moglobin, hematocrit and red blood cell counts in STZ-treated Diabetic Rats
| Control | Diabetic (D) | D+400µg/day Cr-N |
D+400µg/day Cr-P |
|
|---|---|---|---|---|
| N | 6 | 6 | 5 | 5 |
| RBC (106/µL) | 8.27±0.40 | 8.23±0.41 | 8.30±0.43 | 8.31±0.30 |
| Hemoglobin (g/dL) | 15.81±0.31 | 15.03±0.72 | 15.18±0.80 | 15.17±0.43 |
| Hematocrit (%) | 44.59±2.34 | 43.92±2.29 | 43.17±2.61 | 44.94±1.26 |
Values are Mean±SE. There were no differences in values between different groups.
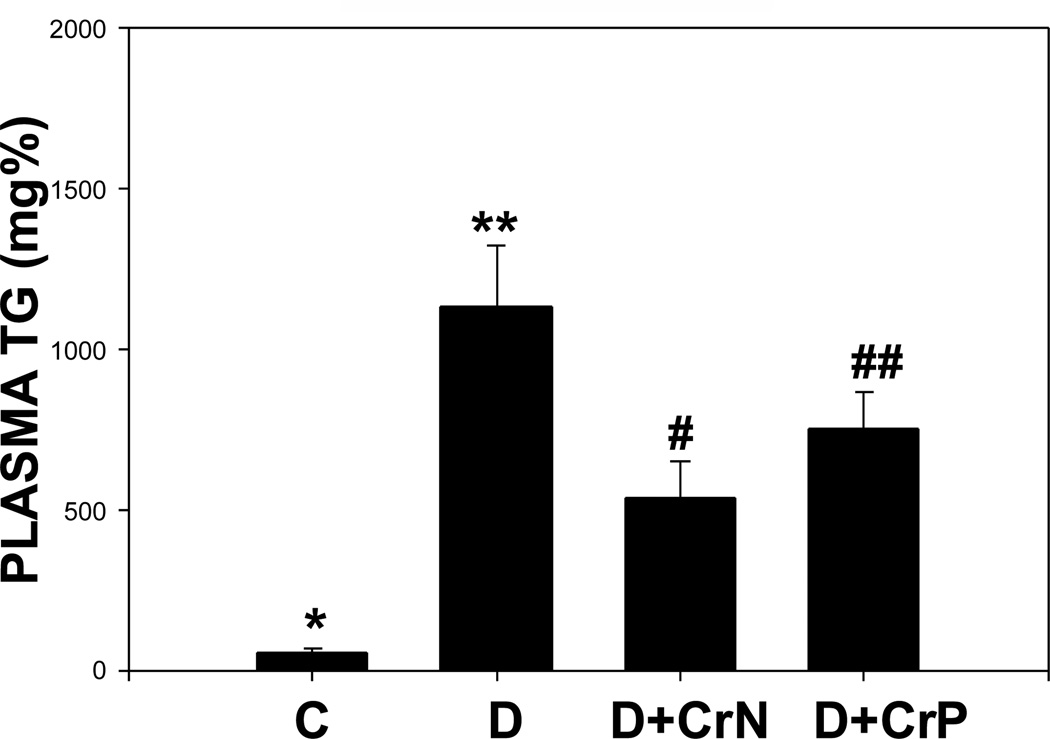
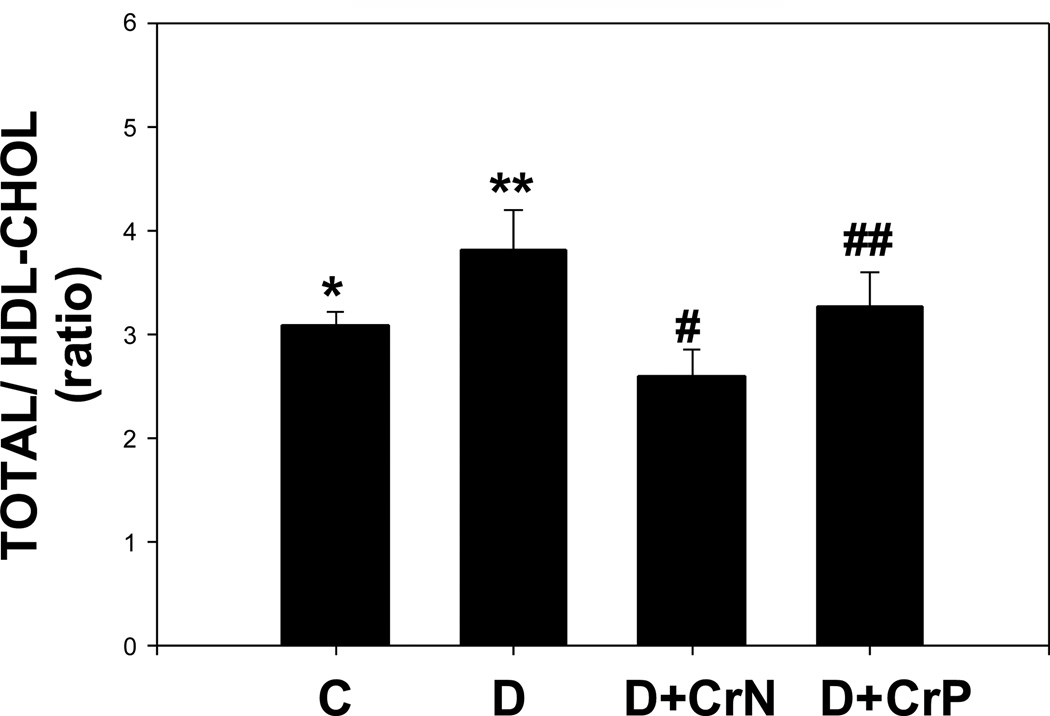
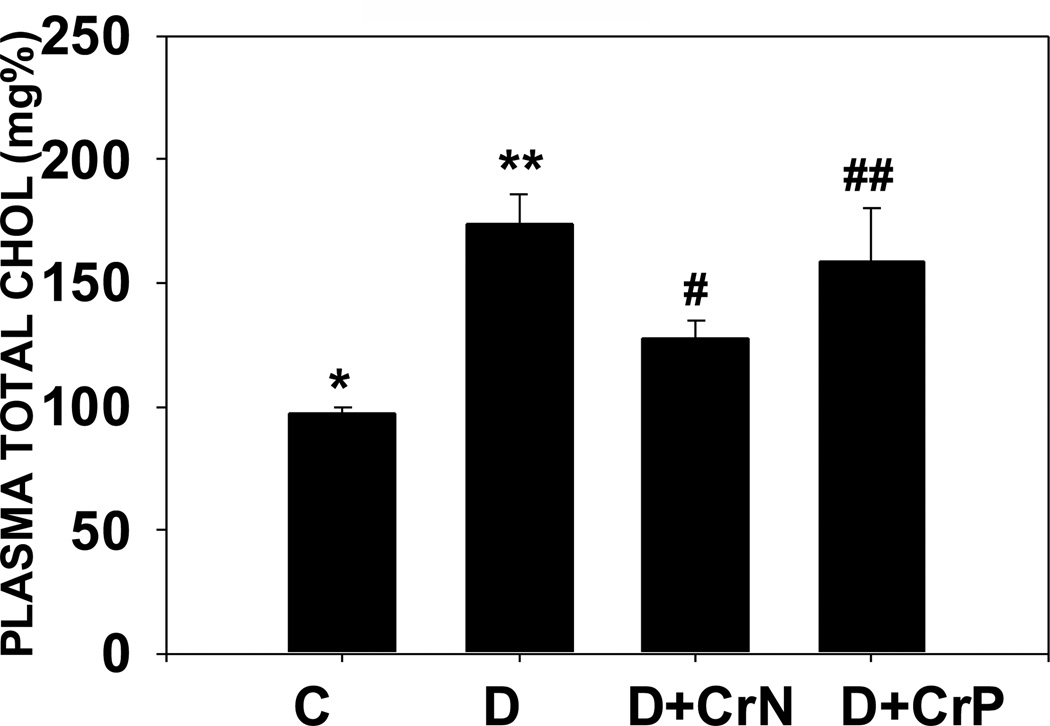
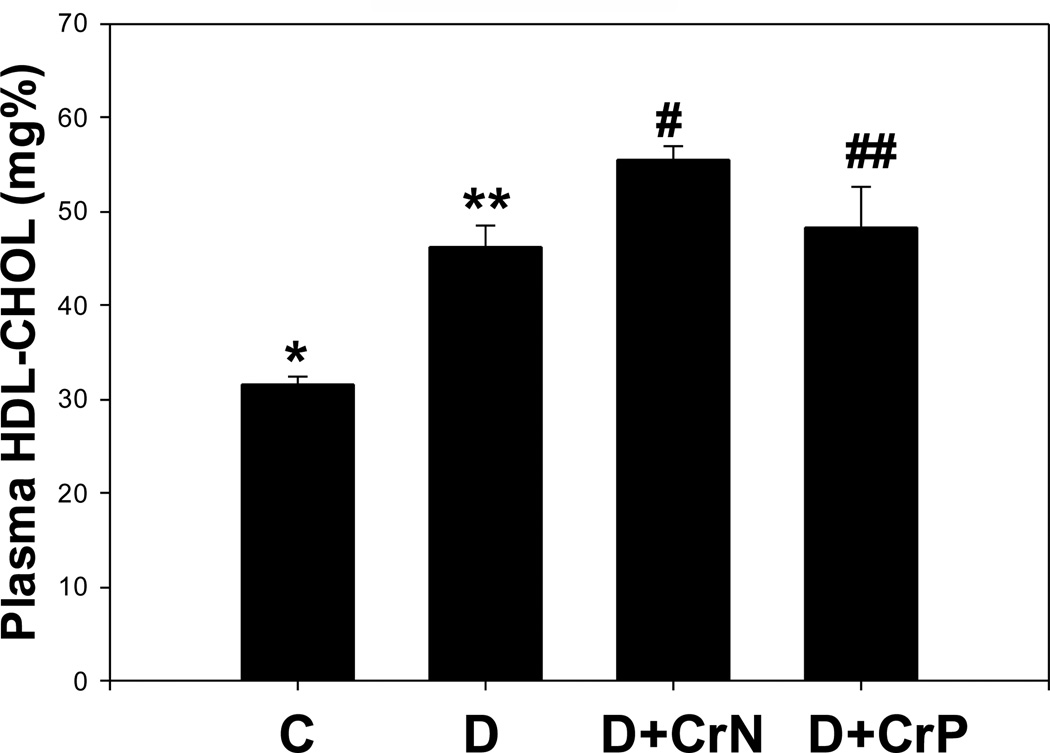
Figures 7–10 illustrate the plasma lipid levels in control, diabetic and Cr-N, and Cr-P-treated diabetic rats. Figure 7 shows that chromium niacinate had a significant effect on lowering of triglyceride levels in diabetic rats. Chromium picolinate also lowered TG levels in diabetic rats, but the decrease was not statistically significant. Similarly, diabetic rats supplemented with chromium niacinate showed significant decreases in total cholesterol (Figure 8) and total cholesterol/HDL ratio (Figure 10), as well as elevated levels of HDL cholesterol (Figure 9). However, the effect of chromium picolinate was not statistically significant, which suggests that chromium niacinate is more effective in reducing cholesterol and triglyceride levels in this animal model of diabetes.
Figure 7.
Effect of chromium niacinate and chromium picolinate supplementation on t otal cholesterol levels in blood of STZ-treated diabetic rats. Values are Mean±SE; C: control; D: diabetic, D+CrN: Cr-N-treated D; D+Cr-P: Cr-P treated diabetic rats. Rats were supplemented with control-buffer, Cr-N (400 µg Cr/kg BW) or Cr-P (400 µg Cr/Kg BW) by gavages daily for 7 wks. Differences between values marked * versus** (p<0.01), **versus# (p<0.04) are significant.
Figure 10.
Effect of chromium niacinate and chromium picolinate supplementation on total/HDL cholesterol ratio in blood of STZ-treated diabetic rats. Values are Mean±SE. C: control; D: diabetic, D+CrN: Cr-N-treated D; D+Cr-P: Cr-P treated diabetic rats. Rats were supplemented with control-buffer, Cr-N (400 µg Cr/kg BW) or Cr-P (400 µg Cr/Kg BW) by gavages daily for 7 wks. Differences between values marked **versus# (p<0.05) are significant.
Figure 8.
Effect of chromium niacinate and chromium picolinate supplementation on triglycerides levels in blood of STZ-treated diabetic rats. Values are Mean±SE; C: control; D: diabetic, D+CrN: Cr-N-treated D; D+Cr-P: Cr-P treated diabetic rats. Rats were supplemented with control-buffer, Cr-N (400 µg Cr/kg BW) or Cr-P (400 µg Cr/Kg BW) by gavages daily for 7 wks. Differences between values marked * versus** (p<0.01), and **versus# (p<0.04) are significant.
Figure 9.
Effect of chromium niacinate and chromium picolinate supplementation on HDL cholesterol levels in blood of STZ-treated diabetic rats. Values are Mean±SE; C: control; D: diabetic, D+CrN: Cr-N-treated D; D+Cr-P: Cr-P treated diabetic rats. Rats were supplemented with control-buffer, Cr-N (400 µg Cr/kg BW) or Cr-P (400 µg Cr/Kg BW) by gavages daily for 7 wks. Differences between values marked * versus** (p<0.001), **versus# (p<0.01) are significant.
Table II gives data on body weight, alanine aminotraferase (ALT), alkaline phosphatase (AP), aspartate aminotransferase (AST), and total and conjugated bilirubin levels in the blood of control, diabetic, and chromium niacinate or chromium picolinate supplemented diabetic rats. The data show that neither chromium niacinate nor chromium picolinate supplementation seems to cause any toxicity as assessed by liver function tests. Similarly, body weight did not change between different diabetic rats groups.
Table II.
Effect of Chromium Supplementation on liver function tests in STZ-treated Diabetic Rats
| Control | Diabetic (D) | D+ 400µg/day CrN |
D+ 400µg/day CrP |
|
|---|---|---|---|---|
| N | 6 | 6 | 5 | 5 |
| Body Weight (g) | 368±14 | 157±11 | 159±14 | 163±15 |
| Total Bilirubin (mg/dL) | 0.37±0.03 | 0.37±0.07 | 0.30±0.06 | 0.32±0.05 |
| Conjugated Bili rubin (mg/dL) | 0.10±.001 | 0.13±0.03 | 0.13±0.03 | 0.10±0.00 |
| AST (U/L) | 187.67±76.26 | 270.20±61.98 | 440.00±117.58 | 383.50±82.82 |
| ALT (U/L) | 63.67±3.60 | 222.83±93.51 | 222.50±34.66 | 220.75±60.27 |
| AP (U/L) | 14.83±2.75 | 41.33±3.80 | 61.25±25.56 | 52.60±14.91 |
Values are Mean±SE. There were no differences in values between D versus D+Cr-N or between D versus D+Cr-P groups. AST: aspartate aminotransferase; ALT: alanine aminotransferase; AP: alkaline phosphatase.
DISCUSSION
Trivalent chromium is an essential nutrient required for glucose and lipid metabolism (13–16). Epidemiological studies suggest an inverse association between chromium levels in toenails and the risk of myocardial infarction in the general population (45). The Health Professionals Follow-up Study has found lower levels of toenail chromium among men with diabetes and CVD compared with those of healthy control subjects (46). Concentrations of chromium in the blood, lenses and toenails are lower in diabetes compared with those of the normal population (14, 16, 46). These studies indicate that sub clinical chromium deficiency may be a contributor to insulin resistance and CVD, particularly in aging and diabetic populations (46). A number of studies both in diabetic animals and diabetic patients report that chromium supplementation may be beneficial, as evidenced by decreased blood glucose, glycosylated hemoglobin and cholesterol values or decreased insulin requirements after chromium supplementation (13–38, 47, 48). However, clinical trials of chromium supplementation in diabetes have not been definitive. More studies are needed to fully assess the mechanism of action and the efficacy of Cr3+ supplementation as an adjuvant therapy for diabetic patients. No studies exist in the literature on the effect of chromium on any of the pro-inflammatory cytokines in diabetic patients or in experimental models of diabetes.
TNF-α is predominantly produced in macrophages. TNF-α affects intracellular insulin signaling in fat, skeletal muscle, endothelial cells, and other insulin-responsive tissues by inhibiting kinase activities in the insulin-signaling pathway (4). The possible involvement of TNF-a in insulin resistance has been suggested in a number of studies (4, 49). TNF-a has been shown to increase plasma TG and concentrations of very low density lipoproteins (50), as well as lipolysis in mouse, rat and human fat cells (51). TNF-α reduces insulin stimulated receptor tyrosine kinase activity at low concentrations and can also decrease the expression of the insulin receptor IRS-1 and Glut-4 at higher concentrations as well as increases the phosphorylation of serine 307 in IRS-1, thus impairing its ability to bind to the insulin receptor and initiate down stream signaling (4). Circulating IL-6 levels are also increased in insulin resistant states such as obesity, impaired glucose tolerance, and type 1 and 2 diabetes (1, 3, 6–9). Thus, TNF-α, IL-6 and CRP play an important role in insulin resistance and the vascular inflammation process through its multiple actions (11, 12, 52–54).
This study demonstrates that diabetic rats have elevated blood levels of TNF-α and IL-6, similar to those observed in diabetic patients. The effect of diabetes on elevated TNF-α and IL-6 levels was abolished in diabetic rats maintained on daily supplementation with chromium niacinate or chromium picolinate but not in those maintained on placebo supplementation. This is a novel finding. Diabetic rats supplemented with chromium niacinate also had modest but significantly lower glycated hemoglobin levels. This suggests an overall improvement in glycemia in Cr3+-supplemented diabetic rats compared with diabetic rats not supplemented with Cr3+. The improvement in blood glucose levels was not significant in Cr3+-supplemented rats compared with placebo-supplemented diabetic rats. The glycated hemoglobin reflects mean glucose concentration over the preceeding 1–2 months, in contrast one time glucose level may be influenced by anesthesia or stress of bleeding at the time of sacrifice, which may have led to why glycated hemoglobin values are significantly lower but not fasting glucose in Cr3+-N group compared with D group. There were no differences between the blood levels of hemoglobin or the RBC counts or hematocrits in diabetic rats receiving placebo or chromium niacinate supplementation, which suggests that lower glycated hemoglobin levels in chromium niacinate-s upplemented rats is not due to any change in life span of RBC.
This study also demonstrates that chromium niacinate supplementation lowered total cholesterol and triglyceride levels, and improved HDL to total cholesterol ratio in diabetic rats. The effect of chromium niacinate in lowering the cholesterol and triglyceride levels was more pronounced than that of chromium picolinate. TNF-α has been shown to increase plasma TG and concentrations of very low density lipoproteins (51, 53) This suggests that improvements in blood cholesterol and triglyceride levels could be due to reduced glycemia or/and TNF-α levels in chromium niacinate supplemented diabetic rats. Our study shows that, compared with chromium picolinate, chromium niacinate was more effective at lowering triglycerides, total cholesterol, and ratio of total to HDL cholesterol. An effect of supplementation of chromium chloride or chromium picolinate on lowering of blood cholesterol and triglycerides has been reported in previous studies (14, 16–19, 21). The present finding that Cr3+-N decreases ratio of total to HDL-cholestrol in STZ-treated diabetic rats is consistent with a previous study in obese type 2 diabetic mice (34), which suggests that Cr3+-N supplementation can increase good cholesterol in diabetes. Chromium niacinate is a complex of chromium and essential B-vitamin niacin, whereas chromium picolinate is a complex of Cr3+ bound to picolinic acid. Both these compounds of Cr3+ are commercially available, widely consumed and are considered to be better absorbed than chromium chloride (16). We do not know whether better absorption of chromium niacinate compared with chromium picolinate contribute to its greater efficacy in diabetic rats. It is also not known whether Cr3+-N and Cr3+-P have difference in stability or have different metabolic pathway in the body. Niacin supplementation by itself has been shown to lower blood cholesterol and triglycerides (55, 56). However, those studies used grams or milligrams doses of niacin, which is much higher dose than the dose of niacin in chromium-niacinate being used in this study. Consistent with previous reports (16), there was no change in liver function tests in chromium niacinate or chromium picolinate supplemented compared with placebo supplemented diabetic rats, which suggests that neither chromium niacinate nor chromium picolinate supplementation led to any toxicity in this study. A recent report suggest that Cr-P supplementation lower the blood levels of ALT and AST in STZ-treated diabetic rats (23). The data in the present study on ALT and AST values in STZ-treated diabetic rats showed large variation and did not show any differences among the different diabetic rats groups.
This study also found that elevated lipid peroxidation levels in the blood of diabetic rats were abolished in diabetic rats supplemented with chromium picolinate and chromium niacinate. The streptozotocin treated diabetic rat is a model of type 1 diabetes and is associated with elevated levels of both hyperglycemia and ketosis. High blood levels of glucose and the ketone body acetoacetate can result in excessive oxygen radical production, which can lead to increased oxidative stress in diabetes (57–65). Oxidative stress can also influence the expression of multiple genes in vascular cells, including signaling molecules such as PKC, NFkB and ERK (66); overexpression of these genes stimulates the secretion of pro-inflammatory cytokines. Oxidative stress plays a key role in the regulatory pathway that progresses from elevated glucose to monocyte and endothelial cell activation in the enhanced vascular inflammation of diabetes (65, 66).
Our study demonstrates that chromium supplementation results in a significant inhibition of oxidative stress and pro-inflammatory cytokines in diabetic rats. The precise mechanism by which chromium inhibits pro-inflammatory cytokines is not known. The inhibitory effect of chromium on pro-inflammatory cytokine inhibition may be mediated partly by oxidative stress pathways (62, 66). Whether or not Cr3+ supplementation prevents the overexpression of regulatory genes in vascular cells, including signaling molecules such as PKC, NFkB and ERK, thereby preventing vascular inflammation in diabetes, is not known and needs to be investigated. Nevertheless, inhibition of circulating levels of TNF-α and IL-6 can explain the observed lowering of blood triglyceride and total cholesterol levels, potentially mediated at least in part by the increased glucose sensitivity and glucose metabolism in chromium niacinate-supplemented diabetic rats. C-reactive protein (CRP) is another known marker of vascular inflammation (52). Studies in literature have reported both no change (67) and an increase (68) in CRP levels in STZ-treated diabetic rats in comparison to normal rats. The present study did not observe an increase in blood levels of CRP in STZ-treated diabetic rats. However, chromium niacinate compared with placebo supplementation significantly lowered the CRP levels in diabetic rats.
The recommended estimated adequate dietary intake range for Cr3+ for adults is 50–200µg/day (69). Human studies have mostly used 1000 µg Cr3+ per day (15, 35, 36). Assuming an average 70 kg body weight, this would relate to an intake of nearly 15 µg Cr3+/kg body weight. The dose of chromium niacinate or chromium picolinate used in this study is 400 µg Cr3+/kg body weight of rat. This chromium dose used in the present study is similar to that has been previously used by other investigators in chromium supplementation studies with diabetic rats or mice (25, 28, 34). Thus, Cr3+ supplementation dose used per body weight in the present rat study is much higher than that has been used in human clinical trials. Whether or not there are any differences in the absorption of Cr3+ between humans and rats is not known. The level of Cr3+ supplementation dose in the present study can be considered pharmacological in comparison to chromium supplementation dose used in literature for human studies (15, 35, 36).
In conclusion, trivalent chromium supplementation has the potential to decrease cellular oxidative stress, lower the blood levels of pro-inflammatory cytokines and lipids. The evidence that chromium can inhibit markers of vascular inflammation needs to be explored at the clinical level to see whether widely used supplements such as chromium picolinate or chromium niacinate can lower levels of pro-inflammatory cytokines in the diabetic patient population. If so, then chromium supplementation may be used as an adjuvant therapy for reduction of vascular inflammation and CVD in diabetes.
Acknowledgements
The author is supported by a grant from NIDDK and the Office of Dietary Supplements of the National Institutes of Health (RO1 DK064797), and by InterHealth Nutraceuticals Inc. (Benicia, CA). The authors thank Ms Georgia Morgan for excellent editing of this manuscript.
Footnotes
Publisher's Disclaimer: This is a PDF file of an unedited manuscript that has been accepted for publication. As a service to our customers we are providing this early version of the manuscript. The manuscript will undergo copyediting, typesetting, and review of the resulting proof before it is published in its final citable form. Please note that during the production process errors may be discovered which could affect the content, and all legal disclaimers that apply to the journal pertain.
References
- 1.Rader DJ. Inflammatory markers of coronary risk. New Engl J Med. 2000;343:1179–1182. doi: 10.1056/NEJM200010193431609. [DOI] [PubMed] [Google Scholar]
- 2.Kern PA, Ranganathan S, Li C, et al. Adipose tissue tumor necrosis factor and interleukin-6 expression in human obesity and insulin resistance. Amer J Physiol Endocrinol Metabolism. 2001;280:E745–E751. doi: 10.1152/ajpendo.2001.280.5.E745. [DOI] [PubMed] [Google Scholar]
- 3.Andreozzi F, Laratta E, Cardellini M, et al. Plasma interleukin-6 levels are independently associated with insulin secretion in a cohort of Italian-Caucasian nondiabetic subjects. 2006;55:2021–2024. doi: 10.2337/db06-0063. [DOI] [PubMed] [Google Scholar]
- 4.Rui L, Aguirre V, Kim JK, Shulman GI, Lee A, Corbould A, Dunaif A, White MF. Insulin/IGF-1 and TNF-α stimulate phosphorylation of IRS-1 at inhibitory Ser307 via distinct pathways. J. Clin. Invest. 2001;107:181–189. doi: 10.1172/JCI10934. [DOI] [PMC free article] [PubMed] [Google Scholar]
- 5.Devaraj S, Jialal I. Antioxidants and vitamins to reduce cardiovascular disease. Curr Atheroscler Rep. 2000;2:342–351. doi: 10.1007/s11883-000-0069-1. [DOI] [PubMed] [Google Scholar]
- 6.Singh U, Devraj S, Jialal I. Vitamin E, oxidative stress and inflammation. Ann Rev Nutr. 2005;25:151–174. doi: 10.1146/annurev.nutr.24.012003.132446. [DOI] [PubMed] [Google Scholar]
- 7.Cavallo MG, Pozzilli P, Bird C, Wadhwa M, Meager A, Visalli N, Gearing AJ, Andreani D, Thorpe R. Cytokines in sera from insulin-dependent diabetic patients at diagnosis. Clin Exp Immunol. 1991;86:256–259. doi: 10.1111/j.1365-2249.1991.tb05806.x. [DOI] [PMC free article] [PubMed] [Google Scholar]
- 8.Jain SK, Kannan K, Lim G, Matthew-Greer J, McVie R, Bocchini JA. Elevated blood interleukin-6 levels in hyperketonemic type 1 diabetic patients and secretion by acetoacetate-treated cultured U937 monocytes. Diab Care. 2003;26:2139–2143. doi: 10.2337/diacare.26.7.2139. [DOI] [PubMed] [Google Scholar]
- 9.Hussain MF, Peakman M, Gallati H, Lo SSS, Hawa M, Viberti GC, Watkins PJ, Leslie RDG, Vergani D. Elevated serum levels of macrophage-derived cytokines precede and accompany the onset of IDDM. Diabetologia. 1996;39:60–69. doi: 10.1007/BF00400414. [DOI] [PubMed] [Google Scholar]
- 10.Jain SK, Kannan K, Lim G, McVie R, Bocchini JA. Hyperketonemia increases TNF-α secretion in cultured U937 monocytes and type-1 diabetic patients. Diabetes. 2002;51:2287–2293. doi: 10.2337/diabetes.51.7.2287. [DOI] [PubMed] [Google Scholar]
- 11.Halse R, Pearson SL, McCormack JG, Yeaman SJ, Taylor R. Effects of tumor necrosis factor-a on insulin action in cultured human muscle cells. Diabetes. 2001;50:1102–1109. doi: 10.2337/diabetes.50.5.1102. [DOI] [PubMed] [Google Scholar]
- 12.Saghizadesh M, Ong JM, Garvey WT, Henry RR, Kern PA. The expression of TNF-a by human muscle. Relationship to insulin resistance. J Clin Invest. 1996;97:1111–1116. doi: 10.1172/JCI118504. [DOI] [PMC free article] [PubMed] [Google Scholar]
- 13.Vincent JB. Mechanisms of chromium action: low-molecular weight chromium-binding substance. J Am Col Nutr. 1999;18:6–12. doi: 10.1080/07315724.1999.10718821. [DOI] [PubMed] [Google Scholar]
- 14.Cefalu WT, Hu FB. Role of chromium in human health and in diabetes. Diabetes Care. 2004;27:2741–2751. doi: 10.2337/diacare.27.11.2741. [DOI] [PubMed] [Google Scholar]
- 15.Anderson RA, Cheng N, Bryden NA, Polansky MM, Cheng N, Chi J, Feng J. Elevated intakes of supplemental chromium improve glucose and insulin variables in individuals with type 2 diabetes. Diabetes. 1997;46:1786–1791. doi: 10.2337/diab.46.11.1786. [DOI] [PubMed] [Google Scholar]
- 16.Lamson DM, Plaza SM. The safety and efficacy of high-dose chromium. Alternative Medicine review. 2002;7:218–235. [PubMed] [Google Scholar]
- 17.Lee NA, Reasner CA. Beneficial effect of chromium supplementation on serum triglyceride levels in NIDDM. Diabetes Care. 1994;17:1449–1452. doi: 10.2337/diacare.17.12.1449. [DOI] [PubMed] [Google Scholar]
- 18.Offenbacher EG, Pi-Sunyer FX. Beneficial effect of chromium-rich yeast on glucose tolerance and blood lipids in elderly subjects. Diabetes. 1980;29:919–925. doi: 10.2337/diab.29.11.919. [DOI] [PubMed] [Google Scholar]
- 19.Mossop RT. Effects of chromium III on fasting blood glucose, cholesterol and cholesterol HDL levels in diabetics. Cent Afr J Med. 1983;29:80–82. [PubMed] [Google Scholar]
- 20.Cheng N, Zhu X, Shi H, Wu W, Chi J, Cheng J, Anderson RA. Follow-up survey of people in china with type 2 diabetes mellitus consuming supplemental chromium. J Trace Elem Exp Med. 1999;12:55–60. [Google Scholar]
- 21.Abraham AS, Brooks BA, Eylath U. Chromium and cholesterol-induced atherosclerosis in rabbits. Ann Nutr Metab. 1991;35:203–207. doi: 10.1159/000177646. [DOI] [PubMed] [Google Scholar]
- 22.Jeejeebhoy KN, Chu RC, Marliss EB, Greenberg GR, Bruce-Robertson A. Chromium deficiency, glucose intolerance, and neuropathy reversed by chromium supplementation in a patient receiving long-term total parenteral nutrition. Am. J.Clin. Nutr. 1977;30:531–538. doi: 10.1093/ajcn/30.4.531. [DOI] [PubMed] [Google Scholar]
- 23.Machalinski B, Walczak M, Syrenicz A, Machalinska A, Grymula K, Stecewicz I, Wiszniewska B, Dabkowska E. Hypoglycemic potency of novel trivalent chromium in hyperglycemic insulin-deficient rats. J Trace Elem Med Biol. 2006;20:33–39. doi: 10.1016/j.jtemb.2006.01.002. [DOI] [PubMed] [Google Scholar]
- 24.Nakhoul F, Abassi Z, Morgan M, Sussan S, Mirsky N. Inhibition of diabetic nephrophathy in rats by an oral antidiabetic material extracted from yeast. J Am Soc Nephrol. 2006;17:S127–S131. doi: 10.1681/ASN.2005121333. [DOI] [PubMed] [Google Scholar]
- 25.Clodfelder BJ, Gullick BM, Lukaski HC, Neggers Y, Vincent JB. Oral administration of the biomimetic [Cr3O(O2CCH2CH3)6(H2O)3]+ increases insulin sensitivity and improves blood plasma variables in healthy and type 2 diabetic rats. Biol Inorg Chem. 2005;10:119–130. doi: 10.1007/s00775-004-0618-0. [DOI] [PubMed] [Google Scholar]
- 26.Shinde UA, Sharma G, Xu YJ, Dhalla NS, Goyal RK. Insulin sensitizing action of chromium picolinate in various experimental models of diabetes mellitus. J Trace Elem Med Biol. 2004;18:23–32. doi: 10.1016/j.jtemb.2004.03.002. [DOI] [PubMed] [Google Scholar]
- 27.Shinde UA, Sharma G, Xu YJ, Dhalla NS, Goyal RK. Anti-diabetic activity and mechanism of action of chromium chloride. Exp Clin Endocrinol Diabetes. 2004;112:248–252. doi: 10.1055/s-2004-817971. [DOI] [PubMed] [Google Scholar]
- 28.Kim DS, Kim TW, Kang JS. Chromium picolinate supplementation improves insulin sensitivity in Goto-Kakizaki diabetic rats. J Trace Elem Med Biol. 2004;17:243–247. doi: 10.1016/S0946-672X(04)80025-7. [DOI] [PubMed] [Google Scholar]
- 29.Cefalu WT, Wang ZQ, Zhang XH, Baldor LC, Russell JC. Oral chromium picolinate improves carbohydrate and lipid metabolism and enhances skeletal muscle Glut-4 translocation in obese, hyperinsulinemic (JCR-LA corpulent) rats. J Nutr. 2002;132:1107–1114. doi: 10.1093/jn/132.6.1107. [DOI] [PubMed] [Google Scholar]
- 30.Yoshimoto S, Sakamoto K, Wakabayashi I, Masui H. Effect of chromium administration on glucose tolerance in stroke-prone spontaneously hypertensive rats with streptozotocin-induced diabetes. Metabolism. 1992;41:636–642. doi: 10.1016/0026-0495(92)90056-g. [DOI] [PubMed] [Google Scholar]
- 31.Racek J, Trefil L, Rajdl D, Mudrova V, Hunter D, Senft V. Influence of chromium-enriched yeast on blood glucose and insulin variables, blood lipids, and markers of oxidative stress in subjects with type 2 diabetes mellitus. Biol Trace Elem Res. 2006;109:215–230. doi: 10.1385/BTER:109:3:215. [DOI] [PubMed] [Google Scholar]
- 32.Mita Y, Ishihara K, Fukuchi Y, Fukuva Y, Yasumoto K. Supplementation with chromium picolinate recovers renal Cr concentration and improves carbohydrate metabolism and renal function in type 2 diabetic mice. Biol Trace Elem Res. 2005;105:229–248. doi: 10.1385/BTER:105:1-3:229. [DOI] [PubMed] [Google Scholar]
- 33.Vinson JA, Mandarano MA, Shuta DL, Bagchi M, Bachi D. Beneficial effects of a novel IH636 grape seed proanthocyanidin extract and a niacin-bound chromium in a hamster atherosclerosis model. Mol Cell Biochem. 2002;240:99–103. doi: 10.1023/a:1020611925819. [DOI] [PubMed] [Google Scholar]
- 34.Rink C, Roy S, Khanna S, Rink T, Bagchi D, Sen CK. Transcriptome of the subcutaneous adipose tissue in response to oral supplementation of type 2 Leprdb obese diabetic mice with niacin-bound chromium. Physiol Genomics. 2007;27:370–279. doi: 10.1152/physiolgenomics.00071.2006. [DOI] [PubMed] [Google Scholar]
- 35.Martin J, Wang ZQ, Zhang XH, Wachtel D, Volaufova J, Matthews DE, Cefalu WT. Chromium picolinate supplementation attenuates body weight gain and increases insulin sensitivity in subjects with type 2 diabetes. Diab Care. 2006;29:1826–1832. doi: 10.2337/dc06-0254. [DOI] [PubMed] [Google Scholar]
- 36.Vrtovic M, Vertovec B, Briski A, Kocijancic A, Anderson RA, Radovancevic B. Chromium supplementation shortenes QTc interval duration in patients with type 2 diabetes mellitus. Amer Heart J. 2005;149:632–636. doi: 10.1016/j.ahj.2004.07.021. [DOI] [PubMed] [Google Scholar]
- 37.Yang X, Palanichamy K, Ontko AC, Rao MNA, Fang CX, Ren J, Sreejayan N. A newly synthetic chromium complex – chromium (phenylalanine)3 improves insulin responsiveness and reduces whole body glucose tolerance. FEBS Letters. 2005;579:1458–1464. doi: 10.1016/j.febslet.2005.01.049. [DOI] [PubMed] [Google Scholar]
- 38.Wang ZQ, Zhang XH, Russel JC, Hulver M, Cefalu WT. Chromium picolinate enhances skeletal muscle cellular insulin siganaling in vivo in obese, insulin-resistant JCR:LA-cp Rats. J Nutr. 2006;136:415–420. doi: 10.1093/jn/136.2.415. [DOI] [PubMed] [Google Scholar]
- 39.Chen G, Liu P, Pattar GR, Tackett L, Bhonagiri P, Strawbridge AB, Elmendorf JS. Chromium activates glucose transporter 4 trafficking and enhances insulin-stimulated glucose transport in 3T3-L1 adipocytes via a cholesterol-dependent mechanism. Mol Endocrinol. 2006;20:857–870. doi: 10.1210/me.2005-0255. [DOI] [PubMed] [Google Scholar]
- 40.Pattar GR, Tackett L, Liu P, Elmendorf JS. Chromium picolinate positively influences the glucose transporter system via affecting cholesterol homeostasis in adipocytes cultured under hyperglycemic diabetic conditions. Mutation Res. 2006;610:93–100. doi: 10.1016/j.mrgentox.2006.06.018. [DOI] [PMC free article] [PubMed] [Google Scholar]
- 41.Jain SK, Kannan K. Chromium chloride inhibits oxidative stress and TNF-α secretion caused by exposure to high glucose in cultured monocytes. Biochem Biophys Res Commun. 2001;289:687–691. doi: 10.1006/bbrc.2001.6026. [DOI] [PubMed] [Google Scholar]
- 42.Jain SK, Lim G. Chromium chloride inhibits TNF-α and IL-6 secretion in isolated human blood monoclear cells exposed to high glucose. Horm Metabolic Res. 2006;38:60–62. doi: 10.1055/s-2006-924981. [DOI] [PubMed] [Google Scholar]
- 43.Jain SK, McVie R, Duett J, Herbst JJ. Erythrocyte membrane lipid peroxidation and glycosylated hemoglobin in diabetes. Diabetes. 1989;38:1539–1543. doi: 10.2337/diab.38.12.1539. [DOI] [PubMed] [Google Scholar]
- 44.Esterbauer H, Lang J, Zadravec S, Slater T. Detection of malonaldehyde by high-performance liquid chromatography. Methods Enzymol. 1984;105:319–328. doi: 10.1016/s0076-6879(84)05041-2. [DOI] [PubMed] [Google Scholar]
- 45.Guallar EJF, van’t Veer P, Bode P, Riemersma R, Gomez-Aracena J, Kark J, Arab L, Kok F, Martin-Moreno JM. Teonail chromium and risk of myocardial infarction. Am J Epidemiol. 2005;162:157–164. doi: 10.1093/aje/kwi180. [DOI] [PubMed] [Google Scholar]
- 46.Rajpathak S, Rimm EB, Li T, Morris JS, Stampfer MJ, Willett WC, Hu FB. Lower toenail chromium in men with diabetes and cardiovascular disease compared with healthy men. Diabetes Care. 2004;27:2211–2216. doi: 10.2337/diacare.27.9.2211. [DOI] [PubMed] [Google Scholar]
- 47.Jain SK, Patel P, Rogier K, Jain SK. Trivalent chromium inhibits protein glycation and lipid peroxidation in high glucose treated erythrocytes. Antioxidant Redox Signaling. 2006;8:238–241. doi: 10.1089/ars.2006.8.238. [DOI] [PubMed] [Google Scholar]
- 48.Yang X, Li S, Dong F, Ren J, Sreejayan N. Insulin-sensitizing and cholesterol-lowering effects of chromium (D-phenylalanine)3. J Inorg Biochem. 2006:1187–1193. doi: 10.1016/j.jinorgbio.2006.01.039. [DOI] [PubMed] [Google Scholar]
- 49.Baud V, Karin M. Signal transduction by tumor necrosis factor and its relatives. Trends Cell Biol. 2001;11:372–377. doi: 10.1016/s0962-8924(01)02064-5. [DOI] [PubMed] [Google Scholar]
- 50.Yudkin JS, Stehouwer CD, Emeis JJ. C-reactive protein in healthy subjects: associations with obesity, insulin resistance, and endothelial dysfunction: a potential role for cytokines originating from adipose tissue? Arterioscler Thromb Vascul Biol. 1999;19:972–978. doi: 10.1161/01.atv.19.4.972. [DOI] [PubMed] [Google Scholar]
- 51.Rosenstock M, Greenberg AS, Rudich A. Distinct long-term regulation of glycerol and non-esterified fatty acid release by insulin and TNF-alpha in 3T3-L1 adipocytes. Diabetologia. 2001;44:55–62. doi: 10.1007/s001250051580. [DOI] [PubMed] [Google Scholar]
- 52.Jialal I, Devraj S, Venugopal SK. C-reactive protein: risk marker or mediator in atherothrombosis. Hypertension. 2004;44:6–11. doi: 10.1161/01.HYP.0000130484.20501.df. [DOI] [PubMed] [Google Scholar]
- 53.Peraldi P, Spiegelman B. TNF-alpha and insulin resistance: summary and future prospects. Mol. Cell. Biochem. 1998;182:169–175. [PubMed] [Google Scholar]
- 54.Wellen KE, Hotamisligil GS. Inflammation, stress, and oxidative stress. J Clin Invest. 2005;115:1111–1119. doi: 10.1172/JCI25102. [DOI] [PMC free article] [PubMed] [Google Scholar]
- 55.Carlson LA. Nicotinic acid: the broad-spectrum lipid drug. A 50th anniversary review. J Intern Med. 2005;258:97–114. doi: 10.1111/j.1365-2796.2005.01528.x. [DOI] [PubMed] [Google Scholar]
- 56.Kolovou GD, Mikhalidis DP, Adamopoulou EN, Salpea KD, Kafaltis N, Bilianou HG, Malakos J, Pilatis ND, Mykoniatis M, Cokkinos DV. The effect of nicotinic acid and alcohol co-administration in Wistar rats. Methods Find Exp Clin Pharmacol. 2005;27:17–23. doi: 10.1358/mf.2005.27.1.875432. [DOI] [PubMed] [Google Scholar]
- 57.King GL, Loeken MR. Hyperglycemia-induced oxidative stress in diabetic complications. Histochem Cell Biol. 2004;122:333–338. doi: 10.1007/s00418-004-0678-9. [DOI] [PubMed] [Google Scholar]
- 58.Jay D, Hitomi H, Griendling KK. Oxidative stress and diabetic cardiovascular complications. Fr Rad Biol & Med. 2006;40:183–192. doi: 10.1016/j.freeradbiomed.2005.06.018. [DOI] [PubMed] [Google Scholar]
- 59.Jain SK, Kannan K, Lim G. Ketosis (acetoacetate) can generate oxygen radicals and cause increased lipid peroxidation and growth inhibition in human endothelial cells. Free Rad Biol Med. 1998;25:1083–1088. doi: 10.1016/s0891-5849(98)00140-3. [DOI] [PubMed] [Google Scholar]
- 60.Jain SK, McVie R. Hyperketonemia can increase lipid peroxidation and lower glutathione levels in human erythrocytes in vitro and in type 1 diabetic patients. Diabetes. 1999;48:1850–1555. doi: 10.2337/diabetes.48.9.1850. [DOI] [PubMed] [Google Scholar]
- 61.Jain SK. Hyperglycemia can cause membrane lipid peroxidation and osmotic fragility in human red blood cells. J Biol Chem. 1989;264:21340–21345. [PubMed] [Google Scholar]
- 62.Guha M, Bai W, Nadler JL, Natarajan R. Molecular mechanisms of tumor necrosis factor a gene expression in monocytic cells via hyperglycemia-induced oxidant stress-dependent and -independent pathways. J Biol Chem. 2000;275:17728–17739. doi: 10.1074/jbc.275.23.17728. [DOI] [PubMed] [Google Scholar]
- 63.Yerneni KK, Bai W, Khan BV, Medford RM, Natarajan R. Hyperglycemia-induced activation of nuclear transcription factor kappaB in vascular smooth muscle cells. Diabetes. 1999;48:855–864. doi: 10.2337/diabetes.48.4.855. [DOI] [PubMed] [Google Scholar]
- 64.Jain SK, McVie R, Jackson R, Levine SN, Lim G. Effect of hyperketonemia on lipid peroxidation levels of plasma in diabetic patients. Diabetes Care. 1999;22:171–1175. doi: 10.2337/diacare.22.7.1171. [DOI] [PubMed] [Google Scholar]
- 65.Brownlee M. The pathogenesis of diabetic complications: a unifying mechanism. Diabetes. 2005;54:1615–1625. doi: 10.2337/diabetes.54.6.1615. [DOI] [PubMed] [Google Scholar]
- 66.Kaneto H, Matsuoka T, Nakatani Y, Kawamori D, Matsuhisa M, Yamasaki Y. Oxidative stress and the JNK pathway in diabetes. Cur Diab Rev. 2005;1:65–72. doi: 10.2174/1573399052952613. [DOI] [PubMed] [Google Scholar]
- 67.Lei Y-C, Hwang J-S, Chan C-C, Lee C-T, Cheng T-J. Enhanced oxidative stress and endothelial dysfunction in streptozotocin-diabetic rats exposed to fine particles. Environ Res. 2005;99:335–343. doi: 10.1016/j.envres.2005.03.011. [DOI] [PubMed] [Google Scholar]
- 68.Cho WC, Yip T-T, Chung W-S, Leung AW, Cheng CH, Yue KK. Differential expression of proteins in kidney, eye, aorta, and serum of diabetic and non-diabetic rats. J Cell Biochem. 2006;99:256–268. doi: 10.1002/jcb.20923. [DOI] [PubMed] [Google Scholar]
- 69.National Research Council, Food and Nutrition Board. Recommended Dietary Allowances. 10th Edition. Washington DC: National Academy Press; 1989. [Google Scholar]


