Abstract
BACKGROUND: Prostate cancer (PCa) is a leading cause of cancer death, and distinguishing aggressive from indolent tumors is a major challenge. Identification and characterization of genomic alterations associated with advanced disease can provide new markers of progression and better therapeutic approaches. METHODS: We performed fluorescence in situ hybridization to detect the copy number gain of chromosome 16p13.3 in 75 PCa samples including 10 lymph node (LN) metastases and their matched primary tumors, 9 samples of castration-resistant prostate cancer (CRPC), and 46 additional primary PCa specimens with clinicopathologic parameters. RESULTS: We detected the gain in 5 of 10 LN metastases and 3 of 5 matched primary tumors, 3 of 9 CRPC samples, and 9 of 46 (20%) primary tumors where the 16p13.3 alteration was associated with high Gleason score and elevated preoperative prostate-specific antigen levels. The level of 16p13.3 gain was higher in LN metastasis and CRPC specimens compared to primary PCa. Chromosome mapping revealed the gain spans PDPK1 encoding the 3-phosphoinositide-dependent protein kinase-1 (PDK1). Knockdown of PDK1 in three PCa cell lines reduced migration without affecting growth and re-expressing PDK1 rescued motility. CONCLUSION: Our findings support a prognostic value of the 16p13.3 gain and a role of PDK1 in PCa progression through migration.
Introduction
Prostate cancer (PCa) is the most common cancer diagnosed in North America and, respectively, the third and second leading cause of cancer death among men in Canada and in USA [1,2]. PCa is heterogeneous in its clinical outcome ranging from relatively indolent to aggressive metastatic disease. Key issues in the management of PCa are to distinguish latent from clinically significant tumors to primarily treat patients with life-threatening disease and to identify molecules contributing to risks of metastatic progression and resistance to treatment. The current prognostic tools such as preoperative prostate-specific antigen (PSA) levels, clinical tumor, node, metastasis (TNM) staging, and Gleason grading of biopsy specimens cannot accurately predict individual clinical outcome. Most advanced cancers will respond to androgen deprivation therapy but will invariably relapse and become castration-resistant prostate cancer (CRPC) [3]. There is currently no cure for metastatic PCa.
The identification and characterization of genomic alterations associated with advanced PCa may lead to developing new progression markers and more efficient therapeutic approaches. DNA copy number alterations (CNAs), gains, and losses, have been described in PCa and include known or candidate tumor suppressors such as NKX3-1 (8p21), PTEN (10q23), RB1 (13q14), and TP53 (17p13), oncogenes such as MYC (8q24), and the AR (Xq12) in CRPC [4]. Studies using a genome-wide approach such as array-comparative genomic hybridization (CGH) to detect and map CNAs in PCa have confirmed earlier findings implicating losses at 8p and 10q and gains at 8q in disease progression [5–8]. The 10q23 deletion has been shown to predict PCa recurrence [9] and earlier prostate cancer-specific death [10]. PTEN is a negative regulator of the phosphatidylinositol 3-kinase/AKT survival pathway known to be upregulated in several types of cancer [11]. 3-Phosphoinositide-dependent protein kinase-1 (PDK1) phosphorylates and activates the AGC kinase members regulated by phosphatidylinositol 3-kinase, including AKT that is activated by phosphorylation at Thr308 [12].
Lapointe et al. found that the 16p13.3 gain was among the most frequent genomic alterations in LN PCa metastases [13], a gain not yet characterized. In this study, we have mapped the focal 16p13.3 genomic gain and identified PDPK1 encoding PDK1 as the likely driver of the gain with consequences on PCa cell migration.
Materials and Methods
Ethics Statement
This study was conducted with the written informed consent of the participants and approval from the Research Ethics Board of the McGill University Health Centre (study BMD-10-115).
Tissue Samples
Formalin-fixed paraffin-embedded prostate tissue specimens included 10 LN metastases and their matched primary tumors, 9 trans-urethral resections of prostate tissue samples of CRPC (defined by a rising serum PSA during androgen ablation therapy despite testosterone at castrate levels), and 46 primary tumors and adjacent benign tissues from radical prostatectomy. Gleason score, surgical stage, and preoperative PSA were available for the latter 46 specimens: 14 cases of Gleason ;≤ 6, 25 cases of Gleason = 7, and 7 cases of Gleason ≥ 8. The specimens included 17 tumors of stage ≤ pT2 and 29 tumors of stage ≥ pT3. Duplicate tissue cores (1-mm diameter) were assembled into tissue microarrays (TMAs). Hematoxylin and eosin-stained TMA sections were reviewed to map representative tumor and benign areas for scoring.
Fluorescence In Situ Hybridization
Dual-color fluorescence in situ hybridization (FISH) was carried out on TMA sections using the BAC clone RP11-20I23 (BACPAC Resources Center, Oakland, CA) mapping to PDPK1 locus on chromosome 16p13.3 region and the recombinant DNA clone pHuR-195 (ATCC, Manassas, VA), which maps to the 16qh centromeric region [14], as probes. RP11-20I23 and pHuR-195 DNA were, respectively, labeled with SpectrumOrange-dUTP and SpectrumGreen-dUTP (Enzo Life Sciences, Farmingdale, NY) using the Nick Translation Reagent Kit (Abbott Molecular, Abbott Park, IL). Mapping the regions flanking 16p13.3 was done using six additional BAC probes: RP11243K18, RP11-31I10, RP11-846C9, RP11-698H1, RP11-66H6, and RP11-548B6. The 5-µm TMA sections were deparaffinized in six changes of xylene before immersion in 95% ethanol. The slides were then placed in 0.2 N HCl solution at room temperature for 20 minutes followed by a 2-hour incubation at 80°C in 10 mM citric acid buffer (pH 6) for pretreatment. Specimens were digested in 0.1 mg/ml protease I (Abbott Molecular) and then fixed for 10 minutes in formalin before dehydration in ethanol series. The two probes and target DNA were codenatured at 73°C for 6 minutes and left to hybridize O/N at 37°C using the ThermoBrite System (Abbott Molecular). Post-hybridization washes were performed in 2x SSC and 0.3% NP-40/0.4x SSC at 73°C for 2 minutes and 1 minute, respectively, followed by a 30-second incubation at room temperature in 2x SSC.
FISH Data Analysis
To evaluate the 16p13.3 copy number, we counted fluorescent signals in 100 nonoverlapping interphase nuclei for each sample (as identified on corresponding hematoxylin and eosin) counterstained with 4′,6-diamidino-2-phenylindole (DAPI III; Abbott Molecular) to delineate nuclei. On the basis of hybridization in 30 benign prostate cores, the 16p13.3 gain was defined as present at a threshold of ≥15% (mean + 3 standard deviation in controls) of tumor nuclei containing three or more 16p13.3 locus signals and by the presence of two pHuR-195 signals. Images were acquired with an Olympus IX-81 inverted microscope at x96 magnification using Image-Pro Plus 7.0 software (Media Cybernetics, Rockville, MD).
Cell Lines
The metastatic human PCa cell lines PC-3, DU145, and LNCaP (ATCC) were cultured in RPMI 1640 medium with 10% fetal bovine serum (HyClone, Logan, UT), 1% L-glutamine, and 1% penicillin-streptomycin (Invitrogen, Grand Island, NY) at 37°C and 5% CO2.
siRNA Transfection
Nontargeting and two specific siRNA (Ctrl, siPDK1-1, and siPDK1-2) were used in PDK1 silencing experiments. Targeted sequences were 5′-CACGCCUAACAGGACGUAUUA-3′ (siPDK1-1) obtained from Qiagen (Valencia, CA) and 5′-CAAGAGACCUCGUGGAGAA-3′ (siPDK1-2) as reported in [15], and nontargeting (Ctrl) sequence was 5′-ACGUGACACGUUCGGAGAA-3′ from Qiagen. Twenty-four hours post-plating, 10 nM siRNA was transfected using HiPerfect reagent diluted 1:200 according to the manufacturer's instructions (Qiagen). Experiments were started 72 hours post-transfection.
Plasmid Construction and Transfection
PDK1 cDNA (GenBank: AF017995.1) was polymerase chain reaction-amplified from reverse-transcribed RNA extracted from RWPE-1 prostate cells, sequence-verified, and inserted into the EcoRI and NotI sites of pcDNA6/V5-HisA (Invitrogen) in-frame with sequences encoding the V5 epitope. PDK1 reverse transcription-polymerase chain reaction primers were PDK1-Left with the EcoRI restriction site: 5′-GATGTGAATTCATGGCCAGGACCACCAGCCAG-3′ and PDK1-Right with the NotI restriction site: 5′-CAGTATGCGGCCGCTGCACAGCGGCGTCCGG-3′. The pcDNA6- PDK1-V5 construct was rendered resistant to siRNA by synonymous nucleotide changes (AACAGGACGTATto AATCGTACATAC) into the targeted sequence of siRNA PDK1-1 by site-directed mutagenesis (QuikChange Lightning Kit; Stratagene, La Jolla, CA). After deletion of the DNA region to be mutated, the changed sequences were reinserted in two steps using the following primers: 5′-CTTTGTCCACACGCCTAATATCTGATGGACCCCAG-3′ and 5′-CTGGGGTCCATCAGATATTAGGCGTGTGGACAAAG-3′ (for deletion), 5′-AAACTTTC-TTTGTCCACACGCCTAATCGTATATCTGATGGACCCCAGCGGGAAC-3′ and 5′-GTTCCCGCTGGGGTCCATCAGATATACGATTAGGCGTGTGGACAAAGAAAGTTT-3′ (for reinsertion of first part), and 5′-AAACTTTCTTTGTCCACACGCCTAACATACTATCTGATGGACCCCAGCGGGAAC-3′ and 5′-GTTCCCGCTGGGGTCCATCAGATAGTATGTTAGGCGTGTGGACAAAGAAAGTTT-3′ (for reinsertion of second part). After rendering the pcDNA6-PDK1-V5 construct resistant to siPDK1-1, siRNA-treated cells were co-transfected with pcDNA6-PDK1-V5 or empty vector (2 or 1.25 µg per well in 6-well and 24-well plates, respectively) using HiPerfect as described above.
Protein Extraction and Western Blot Analysis
Whole-PCa cell protein extracts were prepared using RIPA buffer [50 mM Hepes (pH 7.2), 150 mM NaCl, 2 mM EDTA (pH 8.0), 1% NP-40, 0.5% deoxycholate, 1 mM Na3VO4, 10 mM Na4P2O7, 100 mM NaF, and Complete Protease Inhibitor Cocktail by Roche (Madison, WI)]. Briefly, cell culture medium was removed and cells were washed thrice with ice-cold phosphate-buffered saline before adding RIPA buffer and scraping the cells off. Cell lysate was then collected and left to shake on ice for an hour. After overnight freezing, lysates were centrifuged at 17,000g for 10 minutes and supernatants were transferred to new tubes. Protein concentration was determined using Bio-Rad RC DC Protein Assay. Twenty-five micrograms of protein were loaded on sodium dodecyl sulfate-polyacrylamide gel electrophoresis, transferred to nitrocellulose membrane, and probed with primary antibodies: mouse anti-PDK1 at 1:5000 (ECM Biosciences, Versailles, KY; Cat. No. PM1461), mouse anti-actin at 1:100,000 CHEMICON, Temecula, CA; Cat. No. MAB1501R0), rabbit anti-AKT at 1:10,000 (Cell Signaling Technology, Danvers, MA; Cat. No. 9272), rabbit anti-phospho(p)-AKT (Thr308) at 1:1000 (Cell Signaling Technology; Cat. No. 4056), mouse anti-V5 at 1:5000 (Invitrogen; Cat. No. R96025), rabbit anti-PTEN at 1:2000 (Cell Signaling Technology; Cat. No. 9559), mouse anti-AR at 1:1000 (NeoMarker, Fremont, CA; Cat No. AR441), and rabbit anti-PSA at 1:2000 (DakoCytomation, Carpinteria, CA; Cat. No. A0562). Antibodies were diluted in 5% nonfat dry milk or 5% BSA (for anti-p-AKT) in a solution of TBS/0.1% Tween-20. Secondary anti-mouse or anti-rabbit HRP-conjugated antibody (Jackson ImmunoResearch, West Grove, PA; Cat. Nos 715-035-150 and 711-035-152, respectively) was used at 1:20,000, and results were revealed using the SuperSignal West Femto Maximum Sensitivity Substrate (Thermo Scientific, Waltham, MA).
Growth Assay
Survival/proliferation was measured using 3-(4,5-dimethylthiazol2-yl)-2,5-diphenyltetrazolium bromide (MTT) assay in 24-well plates in triplicates. Cells were plated at 2.5 x 10⁴ cells per well for PC-3, 2.2x10⁴ for DU145, and 5.5 x 10⁴ for LNCaP cells. MTT (5 mg/ml) in phosphate-buffered saline was added to each well at a final concentration of 0.5 mg/ml, and plates were incubated at 37°C for 4 hours in a 5% CO2 environment. The medium was then carefully removed, and DMSO was added to cells and left to incubate for 10 minutes at 37°C and 5% CO2. Readings were done at wavelengths of 595 nm for MTT reagent and 690 nm for the background (Victor3V 1420 Multilabel Counter Plate Reader; PerkinElmer, Waltham, MA)
Migration Assay (Wound Healing Assay)
Cells were plated in six-well plates at 1.2 x 10⁵ cells per well for PC-3 and DU145 and at 3 x 10⁵ for LNCaP cells. Seventy-two hours after transfection, a linear scratch was performed using a pipette tip. Motility was assessed in duplicates at 3, 6, and 12 hours by computing the percentage of wound closure relative to initial surface area (0 hour). At each time point, images were captured with Image-Pro Plus 7.0 software on an Olympus IX-81 inverted microscope at x10 magnification. For each experiment, MTT assay was done in parallel as described above.
Statistical Analysis
Growth and migration assays were done in triplicate and duplicate, respectively, and each experiment was replicated at least twice. Significance of PDK1 knockdown response on growth and motility was determined using two-sample t test and P < .05 was considered to be significant. Clinicopathologic tumor characteristics and their association with the 16p13.3 gain were assessed using Fisher exact test. Levels of gain were compared between specimen categories with the U test (Mann-Whitney).
Results
FISH Analysis of the 16p13.3 Genomic Gain in PCa Tissue Samples
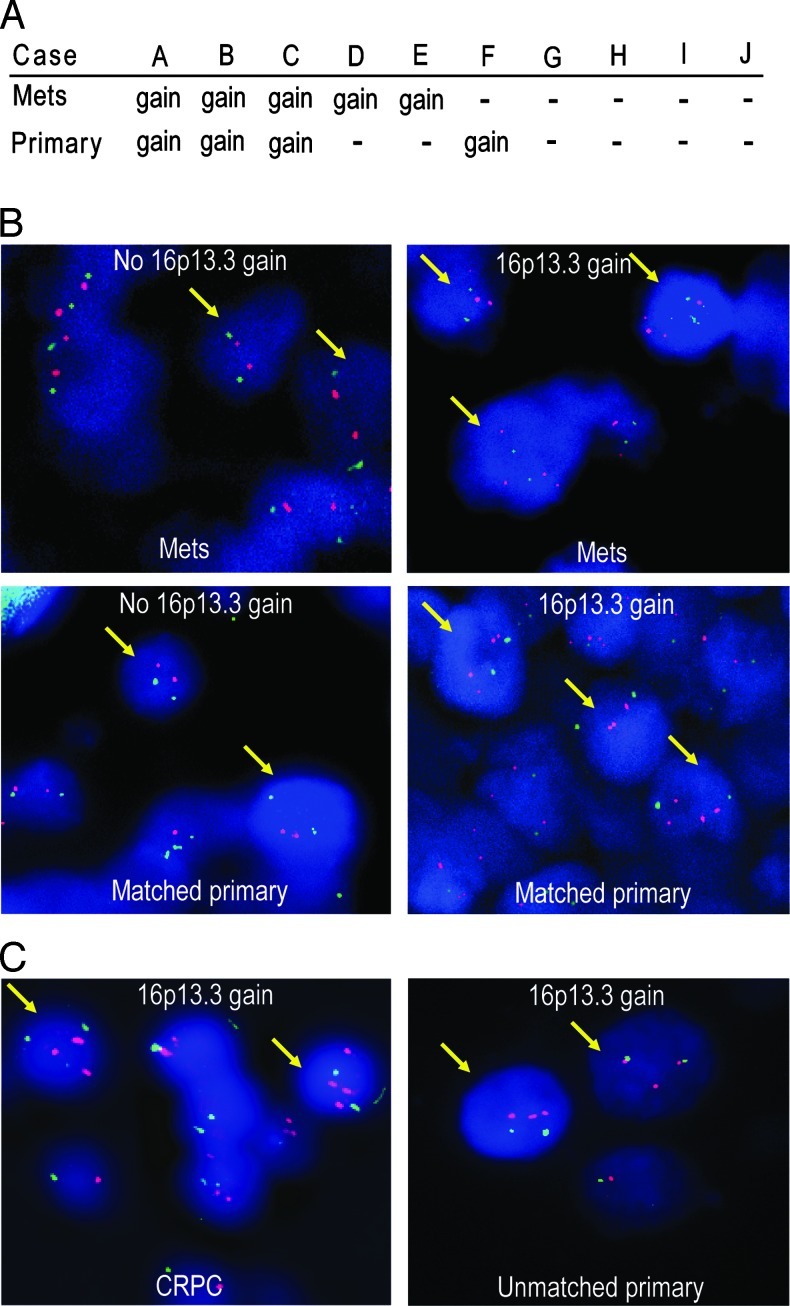
We used FISH to assess CNAs at the 16p13.3 region on 10 PCa samples of LN metastases and their matched primary tumors and 9 CRPC samples from transurethral resections of prostate. We found that 5 of 10 LN metastasis samples harbored the 16p13.3 copy number gain and 3 of these 5 LN cases showed the gain in their matched primary samples (Figure 1, A and B). One of the five LN metastases with no 16p13.3 gain showed the gain in its respective primary specimen (case F), while four cases did not harbor the gain in their primary or metastatic samples. The gain was also detected in three of nine CRPC samples (Figure 1C, left panel).
Figure 1.
Dual-color FISH analysis of 16p13.3 gain in formalin-fixed paraffin-embedded PCa samples. (A) Results of interphase FISH for chromosome 16p13.3 on 10 LN metastases (A–J) and their matched primary tumors. (B) On the left panel, representative FISH images of LN metastases without gain and their matched primaries show two red signals (16p13.3 locus) and two green signals (centromere 16) in most of the nuclei. On the right panel, FISH images show greater than or equal to three red signals (16p13.3 locus) and two green signals per nucleus, indicating a 16p13.3 gain. (C) Representative images of the 16p13.3 gain in a CRPC sample (left panel) and in a sample from the 46 unmatched primary tumors (right panel).
We surveyed an additional set of 46 primary tumors from radical prostatectomy for which the clinicopathologic parameters were available. Found in 9 of these 46 radical prostatectomy specimens (Figure 1C, right panel), the 16p13.3 gain was significantly associated with Gleason score ≥ 8 (P = .002, Table 1) and preoperative PSA levels (P = .047) but not with surgical stage (P =.258).
Table 1.
16p13.3 Gain, Clinicopathologic Parameters, and Levels of Gain.
| Clinicopathologic Parameters (n = 46) | Number of Cases | 16p13.3 Status | |||
| No Gain | Gain | ||||
| Mean Percentage of Nuclei with Three Copies | Mean Percentage of Nuclei with More than Three Copies | ||||
| Gleason score | |||||
| ≤6 | 14 (30%) | 13 (93%) | 1 (7%) | ||
| =7 | 25 (55%) | 22 (88%) | 3 (12%) | ||
| ≥8 | 7 (15%) | 2 (29%) | 5 (71%) P = .002* | ||
| Surgical stage | |||||
| ≤T2 | 29 (63%) | 25 (86%) | 4 (14%) | ||
| ≥T3 | 17 (37%) | 12 (71%) | 5 (29%) P = .238* | ||
| Preoperative PSA (ng/ml) | |||||
| ≤10 | 30 (64%) | 27 (90%) | 3 (10%) | ||
| ≥10 | 16 (36%) | 10 (62.5%) | 6 (37.5%) P = .047* | ||
| Tumor type | |||||
| Primary PCa | 46 | 37 (80%) | 9 (20%) | 20.0 | 3.4 |
| 10 (matched) | 6 (60%) | 4 (40%) | 19.0 | 13.75 | |
| LN metastases | 10 | 5 (50%) | 5 (50%) | 21.2 | 19.4; P < .05†,‡ |
| CRPC | 9 | 6 (67%) | 3 (33%) | 20.7 | 15.0; P < .05†,§ |
Fisher exact test.
Mann-Whitney U test.
LN metastases (n = 10) versus primary PCa (n = 56).
CRPC (n = 9) versus primary PCa (n = 56).
We compared the level of gain in primary radical prostatectomy samples with CRPC and metastatic samples and more specifically evaluated the average percentage of nuclei with more than three copies of 16p13.3 across the specimens with gain. CRPC (n = 9)and LN metastasis samples (n = 10) harbored higher percentages of nuclei with more than three copies than the primary (n = 56, P < .05, Table 1).
Mapping of Chromosome 16p13.3 Gain
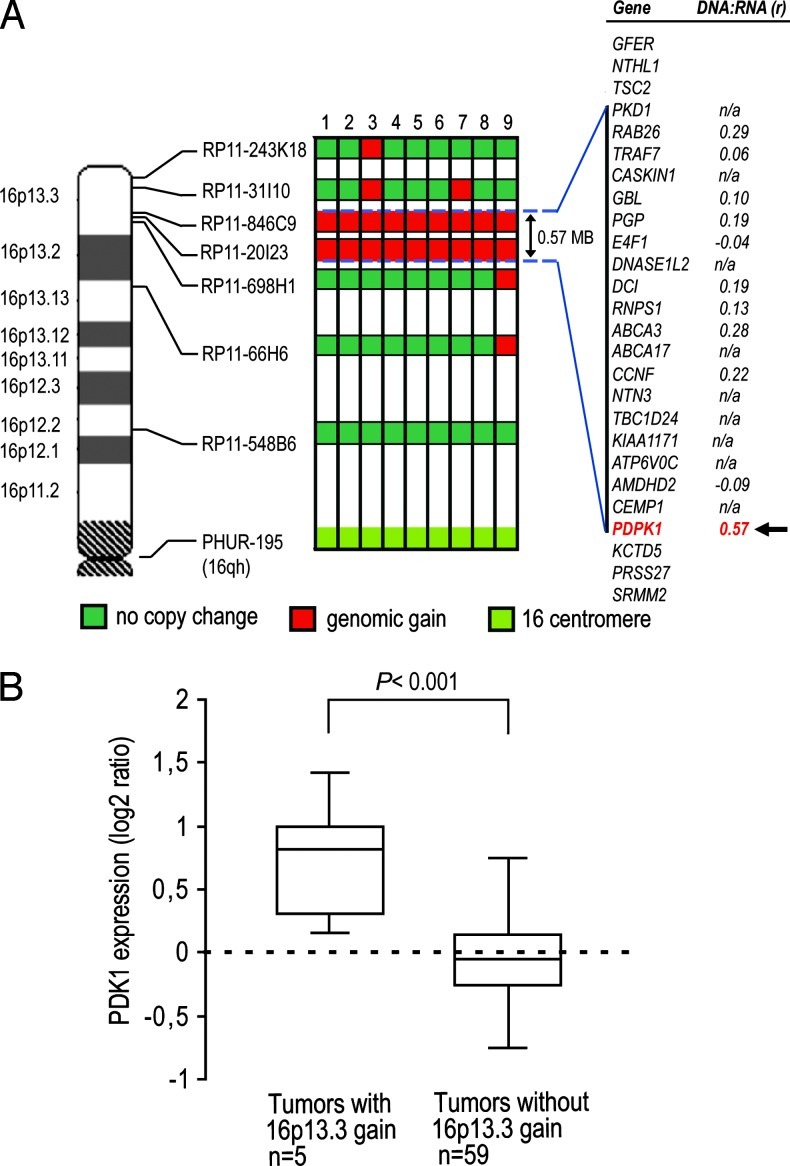
To define the extent of 16p13.3 gain, we mapped the flanking genomic region with FISH using six different BAC probes on the 9 of 46 primary PCa samples with gain for which additional TMA sections were available for multiple-probe hybridization. The size of the gain varied from 0.57 to 9 MB (Figure 2A). The minimal region of gain common to the nine samples was 0.57 MB in size and included 20 genes according to the UCSC Genome Browser, February 2009 assembly. To prioritize candidates at this locus and in absence of gene expression data for the nine samples mapped here, we looked at the previous PCa array-CGH study by Lapointe et al. that reported the 16p13.3 gain in five PCa samples (LN metastases) [13] and the corresponding gene expression data [16]. Both CNA and gene expression data were retrieved for 11 of 20 genes residing in the minimal region of gain. PDPK1 gene had the highest DNA/RNA correlation coefficient and the only one above 0.5 (Figure 2A). Transcript levels of PDK1, reported in the same gene expression study, were significantly higher in tumors with 16p13.3 gain than in samples without 16p13.3 gain (P < .001, two-tailed Mann-Whitney U test; Figure 2B).
Figure 2.
Mapping of flanking regions of the 16p13.3 gain and PDK1 transcript levels in PCa samples. (A) Each BAC probe was cohybridized with the centromere 16 probe to nine primary formalin-fixed paraffin-embedded PCa samples with 16p13.3 gain detected by FISH. Gains are indicated by red boxes for each sample. The horizontal dotted lines delineate the minimal region of gain with, on the far right, the list of genes mapping to this region (UCSC Genome Browser, February 2009 assembly) with their corresponding DNA/ RNA correlation coefficient calculated from independent and previously published array-CGH and gene expression data sets [13,16]. (B) PDK1 transcript levels measured in previously published micro-array data [16] are increased in tumor samples with 16p13.3 gain compared with samples without 16p13.3 gain [13]. Box plots show 25th, 50th (median), and 75th percentiles as well as maximum and minimum of sample set expression with P value (two-sided Mann-Whitney U test). Values are reported as log2 ratios, normalized to the sample set mean.
In Vitro Down-regulation of PDK1 Expression and PCa Cell Migration
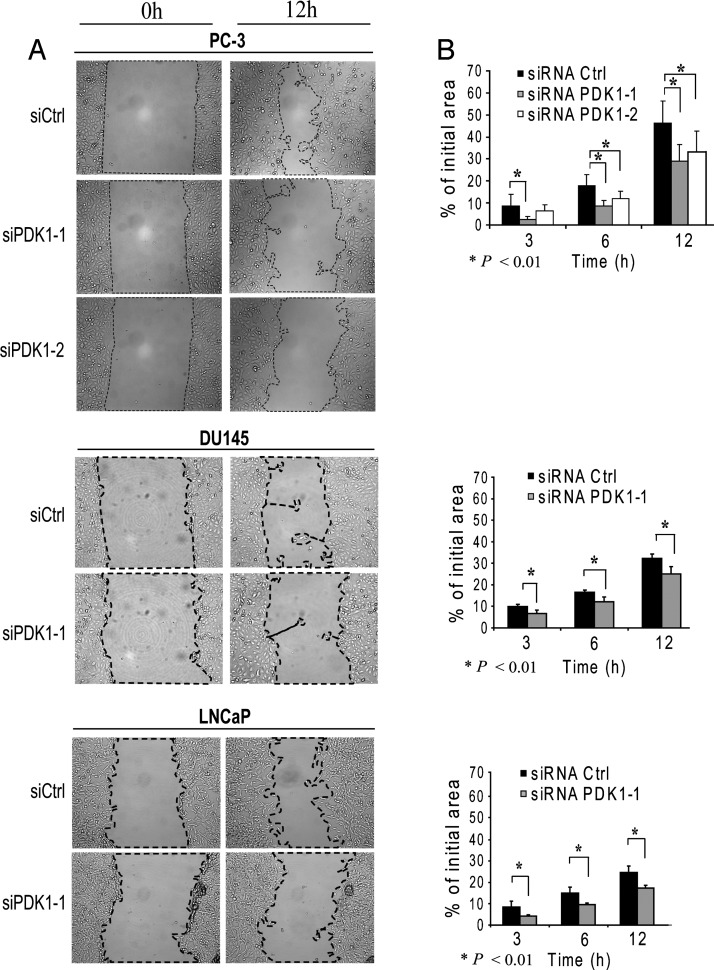
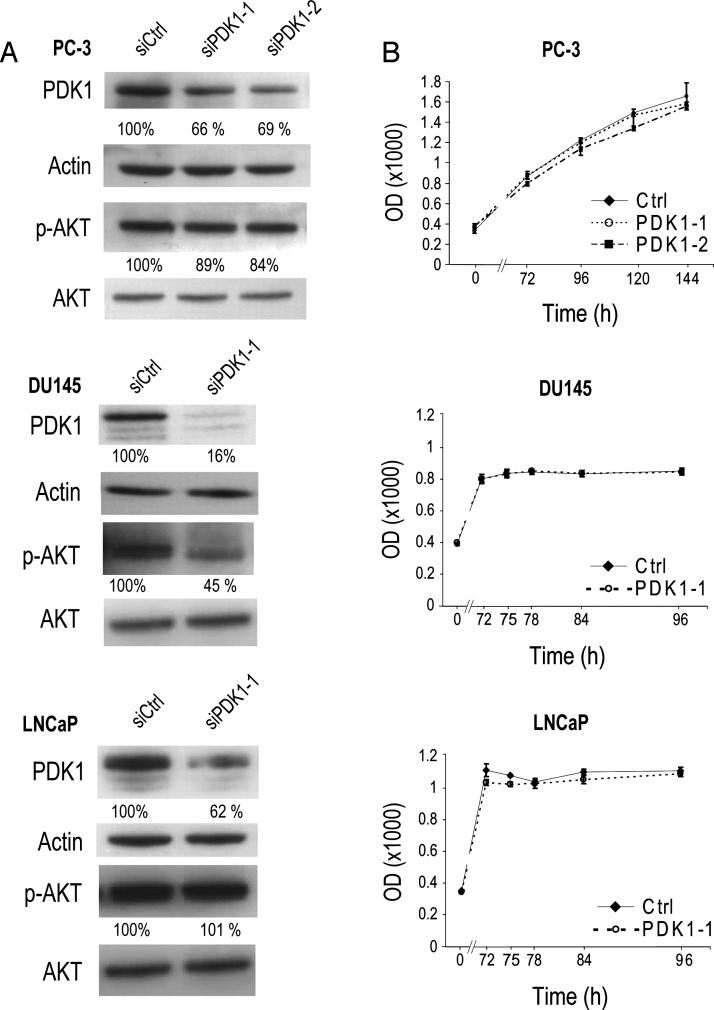
PDK1 is expressed in PCa cell lines with different PTEN and AR status: LNCaP, PC-3, and DU145 (Figure 3). The AR negative (AR-)/PTEN- PC-3 and the AR+/PTEN- LNCaP express high levels of PDK1, while the AR-/PTEN+ DU145 cells express the lowest. To explore the role of PDK1 in PCa progression, we downregulated its expression in these three cell lines with siRNA and assessed the resulting consequences on growth and migration. siPDK1-1 and siPDK1-2 were used in PC-3, and siPDK1-1 was used in DU145 and LNCaP cells. Cell migration was significantly reduced when PDK1 was siRNA downregulated across the three cell lines and the difference with siCtrl was noticeable at 3 hours into the assay (P <.01, Figure 4). Western blots were performed in parallel to assess the effect of siRNA on PDK1 protein expression and downstream cell signaling. In all three cell lines, siRNA effectively downregulated PDK1 expression (assessed by band quantification relative to actin levels; Figure 5A). In DU145 cells, down-regulation of PDK1 was the most effective (84% knockdown) and resulted in a down-regulation of AKT phosphorylation at Thr308 residue, while the knockdown in LNCaP and PC-3 cells did not substantially affect this phosphorylation site. In all three cell lines, knocking down PDK1 did not reduce cell growth as measured by MTT assay (Figure 5B).
Figure 3.
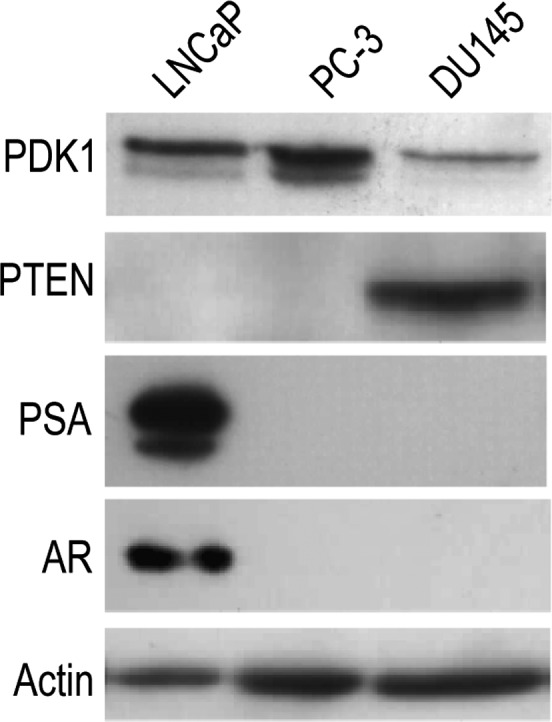
PDK1 expression in LNCaP, PC-3, and DU145 PCa cell lines. Cells were grown in RPMI 1640 medium supplemented with 10% FBS and assessed for basal levels of expression of PDK1, PTEN, AR, and the androgen-regulated PSA by Western blot analysis. Actin was used as control.
Figure 4.
PDK1 knockdown reduces PCa cell motility. (A) Wound healing assays for PC-3, DU145, and LNCaP cell lines at 0 and 12 hours with control siRNA (siCtrl) compared to siPDK1 (siPDK1-1 and siPDK1-2 for PC-3 and siPDK1-1 for DU145 and LNCaP). Dotted lines show areas used for quantification. Migration results are represented in B (from top to bottom: PC-3, DU145, and LNCaP) in terms of percentage recovery of initial surface area after wounding (hour).
Figure 5.
PDK1 knockdown and PC cell growth. (A) Accompanying Western blots of the experiments shown in Figure 4. Residual expression (percentage relative to siCtrl and normalized to actin) is indicated for PDK1 and p-AKT (relative to siCtrl and normalized to AKT). (B) The effect of PDK1 knockdown on growth in PCa cell lines. MTT assays were performed on PC-3, DU145, and LNCaP cells, on the day of transfection (0 hour) and 72 hours post-transfection at time intervals indicated. Cells were transfected with control (siCtrl), siPDK1-1, or siPDK1-2. Differences between control and PDK1-targeting siRNA were not significant with P ≥ .83.
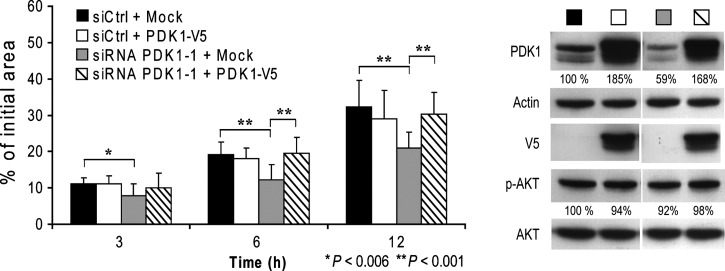
To further validate our findings, we re-expressed PDK1 using the human V5-tagged cDNA resistant to siPDK1-1. Transfection with a control vector (Mock) did not affect the ability of siPDK1-1 to reduce PC-3 cell motility, while re-expressing PDK1 was effective in rescuing motility and restoring levels to the control value (Figure 6). Overexpressing PDK1 in siCtrl-transfected cells did not affect motility. The effects of PDK1 down-regulation and PDK1 re-expression on motility were noticeable at 3 hours (P < .006) and were even more significant at 6 and 12 hours (P < .001). Figure 6 shows the effective down-regulation of PDK1 expression by siRNA and its subsequent re-expression. Levels of p-AKT did not significantly vary across experimental conditions.
Figure 6.
Ectopic expression of siRNA-resistant PDK1 rescues motility in siPDK1-treated PCa cells. The left panel shows the quantified results of migration comparing PC-3 cells transfected with siCtrl or siPDK1-1 in combination with an empty vector (Mock) or a siRNA-resistant PDK1-V5 expressing vector at 3, 6, and 12 hours after wounding. Accompanying Western blots are shown on the right, representing expression levels of PDK1, AKT, and p-AKT.
Discussion
The frequency of 16p13.3 gain in our set of PCa LN metastases (50%) is in line with the previous array-CGH study [13]. Although the number of metastases available was limited, the detection of this gain in most matched primary tumors (60%) is in agreement with earlier data [17] and more recent studies [5,18] showing that metastatic genomic profiling reflects the original primary tumor. In most LN metastases with 16p13.3 gain analyzed here, we observed a deletion of 10q23 (PTEN) ([9] and unpublished observations) as found in the previous array-CGH study [13], which may indicate cooperation between PDK1 and PTEN in the metastatic process. For cases with no alterations at 10q23 and 16p13.3, alternative genetic pathways may have led to their metastatic behavior.
The detection of the 16p13.3 gain in prostatectomy specimens and its association with high Gleason score and high preoperative PSA levels support the idea of an early marker for aggressive PCa. The higher levels of 16p13.3 gain found in LN metastases and CRPC than in radical prostatectomy samples also suggest a link between this genomic alteration and PCa progression. Recently, a report has shown that the 16p13.3 gain was associated with poor survival of breast cancer patients [19]. A cytogenetic study on lung tumors has found the 16p13.3 gain to be associated with poor differentiation and late stage disease [20]. Despite the importance of testing its prognostic value on a larger population of PCa patients with survival data, these findings suggest a strong clinical relevance for 16p13.3 gain in several cancers. Whether this genomic alteration is involved in the development of CRPC is unknown. The AKT pathway was shown to be activated in CRPC along with PTEN deletion [21]. Whether the AKT pathway is further activated in tumors with 16p13.3 gain needs to be assessed, as the observations in LN metastasis suggest that harboring the PTEN deletion along with the 16p13.3 gain may lead to a worse clinical outcome.
Although we cannot exclude a role for the other genes in the 16p13.3 region, mapping results and PDK1 mRNA levels correlating with CNAs in the microarray data sets suggested PDPK1 as a candidate driver of the gain. Our study is limited by the lack of data on PDK1 protein levels in the samples analyzed by FISH. Nevertheless, the microarray data concord with a recent report on PDK1 overexpression in breast cancers with increased PDPK1 CNA [19].
In all three PCa cell lines used here, knocking down PDK1 did not affect cell growth, a finding consistent with in vitro results in mouse embryonic fibroblast derived from PDK1 knockout mice [22]. The knockdown of PDK1 reduced however the cell migration that was rescued by re-expressing PDK1. Recent reports suggested that PDK1 regulates endothelial [23] as well as breast cancer cell migration [19,24] through phosphorylation of AKT at Thr308. The kinase and PH domains of PDK1 were necessary for this effect in endothelial cells [23], and PKCζ was involved in one of the breast cancer studies [24]. In our study, phosphorylation of AKT at Thr308 was affected by the reduction of PDK1 levels in DU145 but not in PC-3 and LNCaP cell lines, while motility was consistently diminished in all cell lines. Although reduced by siRNA, it is possible that the levels of PDK1 remained sufficient to maintain the AKT phosphorylation in PC-3 and LNCaP cells, considering that their basal level of PDK1 is higher than that of DU145 cells (Figure 3). PC-3 and LNCaP do not express a functional PTEN, which may further contribute to the deregulation of AKT phosphorylation. Similar observations were previously reported in animals showing that AKT phosphorylation remained normal in PDK1 hypomorphic mice expressing reduced levels of PDK1 [22]. Knockout of PDPK1 by homologous recombination in human colon cancer cell lines reduced the level but did not abolish the phosphorylation of AKT at Thr308 [25]. This result suggested that another kinase can phosphorylate AKT at Thr308, a hypothesis that is supported by our findings.
Absence of expected effects on the AKT pathway suggests that PDK1 may modulate PCa cell motility by another mechanism. PDK1 has been reported to bind ROCK1, a mediator of cell motility, at the plasma membrane without use of its kinase domain [15]. Loss of PDK1 diminishes ROCK1 activity and consequently reduces motility. Further experiments are needed to determine whether such a mechanism underlies the effect of PDK1 on PCa cell motility.
Given the involvement of PDK1 in motility, it is possible that the 16p13.3 gain detected in primary and LN metastases contributes to cancer cell migration outside the prostate and one can expect to find it in circulating tumor cells [26]. In recent CNA surveys of PCa, this gain was also detected in distant metastasis sites such as the bone, liver, and adrenal glands [5,18] and was associated with PCa liver metastases [5]. The latter observation suggests a role for the 16p13.3 gain in PCa cell migration to distant organs, which ultimately leads to lethal PCa.
Taken together, our results support that the 16p13.3 gain is relevant to PCa progression and may represent an early marker of metastasis, since retrieved in primary PCa, which is sampled by biopsies at time of diagnosis. PDK1, encoded by PDPK1 at 16p13.3, is implicated in PCa cell motility, a critical step for progression to metastasis. These findings provide further rationale for considering PDK1 as a target for cancer therapies and the development of new specific inhibitors of PDK1 [27].
Acknowledgments
We thank Ricky Gandhi for his work in the early phase of this project and Francisco P. Fonseca, a surgeon responsible for PCa samples from Brazil.
Footnotes
This study was supported by Prostate Cancer Canada (2010-576) and Fonds de recherche du Québec—Santé (FRQS) to J.L. and by the McGill Division of Urology and John McCrae Studentships to K.C.
References
- 1.Siegel R, Ward E, Brawley O, Jemal A. Cancer statistics, 2011: the impact of eliminating socioeconomic and racial disparities on premature cancer deaths. CA Cancer J Clin. 2011;61:212–236. doi: 10.3322/caac.20121. [DOI] [PubMed] [Google Scholar]
- 2.Canadian Cancer Society's Steering Committee on Cancer Statistics, author. Canadian Cancer Statistics 2011. Toronto, Ontario: Canadian Cancer Society; 2011. [Google Scholar]
- 3.Yuan X, Balk SP. Mechanisms mediating androgen receptor reactivation after castration. Urol Oncol. 2009;27:36–41. doi: 10.1016/j.urolonc.2008.03.021. [DOI] [PMC free article] [PubMed] [Google Scholar]
- 4.DeMarzo AM, Nelson WG, Isaacs WB, Epstein JI. Pathological and molecular aspects of prostate cancer. Lancet. 2003;361:955–964. doi: 10.1016/S0140-6736(03)12779-1. [DOI] [PubMed] [Google Scholar]
- 5.Holcomb IN, Young JM, Coleman IM, Salari K, Grove DI, Hsu L, True LD, Roudier MP, Morrissey CM, Higano CS, et al. Comparative analyses of chromosome alterations in soft-tissue metastases within and across patients with castration-resistant prostate cancer. Cancer Res. 2009;69:7793–7802. doi: 10.1158/0008-5472.CAN-08-3810. [DOI] [PMC free article] [PubMed] [Google Scholar]
- 6.Kim JH, Dhanasekaran SM, Mehra R, Tomlins SA, Gu W, Yu J, Kumar-Sinha C, Cao X, Dash A, Wang L, et al. Integrative analysis of genomic aberrations associated with prostate cancer progression. Cancer Res. 2007;67:8229–8239. doi: 10.1158/0008-5472.CAN-07-1297. [DOI] [PubMed] [Google Scholar]
- 7.Robbins CM, Tembe WA, Baker A, Sinari S, Moses TY, Beckstrom-Sternberg S, Beckstrom-Sternberg J, Barrett M, Long J, Chinnaiyan A, et al. Copy number and targeted mutational analysis reveals novel somatic events in metastatic prostate tumors. Genome Res. 2011;21:47–55. doi: 10.1101/gr.107961.110. [DOI] [PMC free article] [PubMed] [Google Scholar]
- 8.Taylor BS, Schultz N, Hieronymus H, Gopalan A, Xiao Y, Carver BS, Arora VK, Kaushik P, Cerami E, Reva B, et al. Integrative genomic profiling of human prostate cancer. Cancer Cell. 2010;18:11–22. doi: 10.1016/j.ccr.2010.05.026. [DOI] [PMC free article] [PubMed] [Google Scholar]
- 9.Yoshimoto M, Cunha IW, Coudry RA, Fonseca FP, Torres CH, Soares FA, Squire JA. FISH analysis of 107 prostate cancers shows that PTEN genomic deletion is associated with poor clinical outcome. Br J Cancer. 2007;97:678–685. doi: 10.1038/sj.bjc.6603924. [DOI] [PMC free article] [PubMed] [Google Scholar]
- 10.Reid AH, Attard G, Ambroisine L, Fisher G, Kovacs G, Brewer D, Clark J, Flohr P, Edwards S, Berney DM, et al. Molecular characterisation of ERG, ETV1 and PTEN gene loci identifies patients at low and high risk of death from prostate cancer. Br J Cancer. 2010;102:678–684. doi: 10.1038/sj.bjc.6605554. [DOI] [PMC free article] [PubMed] [Google Scholar]
- 11.Stambolic V, Suzuki A, de la Pompa JL, Brothers GM, Mirtsos C, Sasaki T, Ruland J, Penninger JM, Siderovski DP, Mak TW. Negative regulation of PKB/Akt-dependent cell survival by the tumor suppressor PTEN. Cell. 1998;95:29–39. doi: 10.1016/s0092-8674(00)81780-8. [DOI] [PubMed] [Google Scholar]
- 12.Alessi DR, Deak M, Casamayor A, Caudwell FB, Morrice N, Norman DG, Gaffney P, Reese CB, MacDougall CN, Harbison D, et al. 3-Phosphoinositidedependent protein kinase-1 (PDK1): structural and functional homology with the Drosophila DSTPK61 kinase. Curr Biol. 1997;7:776–789. doi: 10.1016/s0960-9822(06)00336-8. [DOI] [PubMed] [Google Scholar]
- 13.Lapointe J, Li C, Giacomini CP, Salari K, Huang S, Wang P, Ferrari M, Hernandez-Boussard T, Brooks JD, Pollack JR. Genomic profiling reveals alternative genetic pathways of prostate tumorigenesis. Cancer Res. 2007;67:8504–8510. doi: 10.1158/0008-5472.CAN-07-0673. [DOI] [PubMed] [Google Scholar]
- 14.Moyzis RK, Albright KL, Bartholdi MF, Cram LS, Deaven LL, Hildebrand CE, Joste NE, Longmire JL, Meyne J, Schwarzacher-Robinson T. Human chromosome-specific repetitive DNA sequences: novel markers for genetic analysis. Chromosoma. 1987;95:375–386. doi: 10.1007/BF00333988. [DOI] [PubMed] [Google Scholar]
- 15.Pinner S, Sahai E. PDK1 regulates cancer cell motility by antagonising inhibition of ROCK1 by RhoE. Nat Cell Biol. 2008;10:127–137. doi: 10.1038/ncb1675. [DOI] [PubMed] [Google Scholar]
- 16.Lapointe J, Li C, Higgins JP, van de Rijn M, Bair E, Montgomery K, Ferrari M, Egevad L, Rayford W, Bergerheim U, et al. Gene expression profiling identifies clinically relevant subtypes of prostate cancer. Proc Natl Acad Sci USA. 2004;101:811–816. doi: 10.1073/pnas.0304146101. [DOI] [PMC free article] [PubMed] [Google Scholar]
- 17.Jenkins RB, Qian J, Lieber MM, Bostwick DG. Detection of c-myc oncogene amplification and chromosomal anomalies in metastatic prostatic carcinoma by fluorescence in situ hybridization. Cancer Res. 1997;57:524–531. [PubMed] [Google Scholar]
- 18.Liu W, Laitinen S, Khan S, Vihinen M, Kowalski J, Yu G, Chen L, Ewing CM, Eisenberger MA, Carducci MA, et al. Copy number analysis indicates monoclonal origin of lethal metastatic prostate cancer. Nat Med. 2009;15:559–565. doi: 10.1038/nm.1944. [DOI] [PMC free article] [PubMed] [Google Scholar]
- 19.Maurer M, Su T, Saal LH, Koujak S, Hopkins BD, Barkley CR, Wu J, Nandula S, Dutta B, Xie Y, et al. 3-Phosphoinositide-dependent kinase 1 potentiates upstream lesions on the phosphatidylinositol 3-kinase pathway in breast carcinoma. Cancer Res. 2009;69:6299–6306. doi: 10.1158/0008-5472.CAN-09-0820. [DOI] [PMC free article] [PubMed] [Google Scholar]
- 20.Shen H, Zhu Y, Wu YJ, Qiu HR, Shu YQ. Genomic alterations in lung adenocarcinomas detected by multicolor fluorescence in situ hybridization and comparative genomic hybridization. Cancer Genet Cytogenet. 2008;181:100–107. doi: 10.1016/j.cancergencyto.2007.11.012. [DOI] [PubMed] [Google Scholar]
- 21.Sircar K, Yoshimoto M, Monzon FA, Koumakpayi IH, Katz RL, Khanna A, Alvarez K, Chen G, Darnel AD, Aprikian AG, et al. PTEN genomic deletion is associated with p-Akt and AR signalling in poorer outcome, hormone refractory prostate cancer. J Pathol. 2009;218:505–513. doi: 10.1002/path.2559. [DOI] [PubMed] [Google Scholar]
- 22.Lawlor MA, Mora A, Ashby PR, Williams MR, Murray-Tait V, Malone L, Prescott AR, Lucocq JM, Alessi DR. Essential role of PDK1 in regulating cell size and development in mice. EMBO J. 2002;21:3728–3738. doi: 10.1093/emboj/cdf387. [DOI] [PMC free article] [PubMed] [Google Scholar]
- 23.Primo L, di Blasio L, Roca C, Droetto S, Piva R, Schaffhausen B, Bussolino F. Essential role of PDK1 in regulating endothelial cell migration. J Cell Biol. 2007;176:1035–1047. doi: 10.1083/jcb.200607053. [DOI] [PMC free article] [PubMed] [Google Scholar]
- 24.Liu Y, Wang J, Wu M, Wan W, Sun R, Yang D, Sun X, Ma D, Ying G, Zhang N. Down-regulation of 3-phosphoinositide-dependent protein kinase-1 levels inhibits migration and experimental metastasis of human breast cancer cells. Mol Cancer Res. 2009;7:944–954. doi: 10.1158/1541-7786.MCR-08-0368. [DOI] [PubMed] [Google Scholar]
- 25.Ericson K, Gan C, Cheong I, Rago C, Samuels Y, Velculescu VE, Kinzler KW, Huso DL, Vogelstein B, Papadopoulos N. Genetic inactivation of AKT1, AKT2, and PDPK1 in human colorectal cancer cells clarifies their roles in tumor growth regulation. Proc Natl Acad Sci USA. 2010;107:2598–2603. doi: 10.1073/pnas.0914018107. [DOI] [PMC free article] [PubMed] [Google Scholar]
- 26.Attard G, Swennenhuis JF, Olmos D, Reid AH, Vickers E, A'Hern R, Levink R, Coumans F, Moreira J, Riisnaes R, et al. Characterization of ERG, AR and PTEN gene status in circulating tumor cells from patients with castration-resistant prostate cancer. Cancer Res. 2009;69:2912–2918.. doi: 10.1158/0008-5472.CAN-08-3667. [DOI] [PubMed] [Google Scholar]
- 27.Peifer C, Alessi DR. Small-molecule inhibitors of PDK1. ChemMedChem. 2008;3:1810–1838. doi: 10.1002/cmdc.200800195. [DOI] [PubMed] [Google Scholar]


