

Abstract
To date, metagenomic studies have relied on the utilization and analysis of reads obtained using 454 pyrosequencing to replace conventional Sanger sequencing. After extensively scanning the 16S ribosomal RNA (rRNA) gene, we identified the V5 hypervariable region as a short region providing reliable identification of bacterial sequences available in public databases such as the Human Oral Microbiome Database. We amplified samples from the oral cavity of three healthy individuals using primers covering an ~82-base segment of the V5 loop, and sequenced using the Illumina technology in a single orientation. We identified 135 genera or higher taxonomic ranks from the resulting 1,373,824 sequences. While the abundances of the most common phyla (Firmicutes, Proteobacteria, Actinobacteria, Fusobacteria and TM7) are largely comparable to previous studies, Bacteroidetes were less present. Potential sources for this difference include classification bias in this region of the 16S rRNA gene, human sample variation, sample preparation and primer bias. Using an Illumina sequencing approach, we achieved a much greater depth of coverage than previous oral microbiota studies, allowing us to identify several taxa not yet discovered in these types of samples, and to assess that at least 30,000 additional reads would be required to identify only one additional phylotype. The evolution of high-throughput sequencing technologies, and their subsequent improvements in read length enable the utilization of different platforms for studying communities of complex flora. Access to large amounts of data is already leading to a better representation of sample diversity at a reasonable cost.
Keywords: Metagenomics, Oral cavity, Flora composition, Microbiome, High-throughput sequencer
1. Introduction
Oral health, which is strongly influenced by oral microbiota, has a significant impact on general health. The bacterial community in the mouth contains species that promote health, and others that contribute to illness. Recent studies have shown that poor oral hygiene and/or the presence of particular species in the mouth may be associated with periodontitis, respiratory infection and intestinal disease (Avila et al., 2009; Kuehbacher et al., 2008; Raghavendran et al., 2007). In addition, the salivary microbiota may be used as a diagnostic marker for cancer (Mager et al., 2005) and periodontal disease (Faveri et al., 2008) as well as to provide insights into human population studies (Nasidze et al., 2009a). Understanding which species are present and how the community is composed in healthy adults is the first step towards understanding how changes can lead to disease.
Experts have recently raised the hypothesis that in some chronic diseases, the “pathogen” might be a disturbed microbial community rather than a single organism (Friedrich, 2008). Understanding the contribution of “behind-the-scenes” species which influence the pathogenicity of other species has already led to important changes in treatment strategies (Sibley et al., 2006). These unexpected interactions are changing how microbiologists think about causation of infection and disease (Lipkin, 2009).
Until recently, knowledge of the bacteria that reside in the human oral cavity was limited to those species that could be cultured in the laboratory. New sequencing technologies have brought tremendous improvements in automated sequencing and analysis of genome features. Today around 900 complete prokaryotic genomes are publicly available (www.ncbi.nlm.nih.gov/genomes/lproks.cgi) as well as more than a million 16S rRNA gene sequences, and several hundred metagenomic datasets. The Human Oral Microbiome Project (www.homd.org) now contains close to 1000 species which have been found in the mouth, while a metagenomic-based estimate of the diversity is one order of magnitude higher (Keijser et al., 2008). The availability of these extensive and varied sequences has opened the way for comparative genomics techniques (Fraser et al., 2000) for evaluating relatedness and diversity as well as studying whole viral or bacterial content of various media (Venter et al., 2004; Williamson et al., 2008) or bacterial infections (Cox-Foster et al., 2007; Nakamura et al., 2008; Turnbaugh et al., 2009).
Here, we evaluate the potential of Illumina high-throughput sequencing with an unprecedented depth of sequence coverage for the study of human oral microbiota diversity. We use partial sequences from the well-characterized and conserved 16S rRNA gene, to enable classification of bacteria from human oral samples.
2. Materials and methods
2.1. Sampling and DNA extraction
We collected saliva and oropharyngeal samples over a one-week period from three adult individuals with informed consent. Saliva samples were collected by expectoration into a sterile plastic 50-ml tube and kept frozen at −20 °C until processing. We mixed 100μL of each saliva sample with the same volume of 2× lysis buffer [Tris 20 mM, EDTA 2 mM (pH 8), Tween 1%, proteinase K (Fermentas) 400 μg/ml] and incubated them for 2h at 55 °C (Faveri et al., 2008). Proteinase K was inactivated by a 10 min incubation at 95 °C and the samples were frozen at −20 °C.
Dry cotton swabs (Copan) were used to gently swab the posterior wall of the oropharynx. They were directly suspended in a microtube containing 200 μL of lysis buffer and processed in the same way as the saliva samples. The saliva and oropharyngeal lysates from all three subjects were mixed in a 1:10 ratio with roughly equal contributions from the two sampling sites according to PCR yield.
2.2. PCR primers and conditions
We aligned 753 16S rDNA sequences from the Human Oral Microbiome Database (HOMD, October 2008) using MAFFT (-FFT-NS-2, v6.531b) (Katoh et al., 2002). We chose primers from the conserved areas of the alignment flanking the V5 region so as to match most sequences. With a 100%match, primers 784DEG(5′-GGMTTAGATACCC) and 880RDEG (5′-CRTACTHCHCAGGYG) sequences produced 740 and 745 hits, respectively, or 732 (97.2%) of the HOMD sequences. Species coverage was within the 91–100% range for all HOMD bacterial phyla except Chloroflexi which is very rare in oral microbiota (Keijser et al., 2008) and has a single representative in the HOMD.
PCR amplification was carried out in a 50 μL PrimeStar HS Premix (Takara) containing 5 μL of lysate and 0.5 μMof each forward (784DEG) and reverse (880RDEG) primer. The samples were run in two separate PCRs for 15 cycles using the following parameters: 98 °C for 10 s, 46 °C for 15s, and 72°C for 1min. The two PCRs were then pooled and phosphorylated with polynucleotide kinase and the Illumina paired-ends adapters were ligated with T4 DNA ligase. After PCR amplification with Phusion for 10 cycles using Illumina paired-ends PCR primers, the library was quality controlled by cloning an aliquot into a TOPO plasmid and capillary sequencing 16 clones. The library was sequenced from the forward end for 76 cycles on the Illumina Genome Analyzer system GAII using sequencing kits version 3.0. The 16S V5 amplicons correspond to E. coli positions 785 to 894 including primer sequence and to positions 798 to 879 excluding primers.
2.3. Sequence analysis
Base-calling was performed with the GAPipeline 1.3.2 using standard parameters, which include purity filtering with “chastity 0.6”. We removed sequences containing uncalled bases, incorrect primer sequence or runs of ≥12 identical nucleotides. Seventy-two-base sequence reads were trimmed to remove the 13-base forward primer sequence, yielding 59-base sequences.
We assigned taxonomy to sequences with GAST (Huse et al., 2008), using a database of reference V5 rDNA sequences (RefHVR_V5) from SILVA (version 98) (Pruesse et al., 2007), and taxonomy from known cultured isolates, Entrez Genome projects, the Ribosomal Database Project [RDP; (Cole et al., 2005)], Greengenes (DeSantis et al., 2006) and hand curation. GAST compares each tag to the RefHVR_V5 and aligns it to its nearest neighbors in the database and then selects the closest reference (s). The taxonomy for the tag is the lowest common ancestor for a two-thirds majority of all 16S rDNA sequences associated with the nearest V5 reference sequences.
Before generating clusters of phylotypes, we filtered out all sequences that occurred fewer than 3 times. This reduced the number of unique sequences to a computationally manageable level, and potentially reduced the number of errors from sequencing and contamination. We created a multiple sequences alignment of the remaining data using MUSCLE (Edgar, 2004) with parameters -maxiters 2 and -diags, and generated phylotype clusters and diversity estimates using MOTHUR (Schloss and Handelsman, 2005).
3. Results and discussion
3.1. Evaluation of the oral microbiota diversity using the V5 region of the 16S rRNA gene
To examine which region of the 16S rRNA gene would be possible to target with the short Illumina sequencing reads, we extracted various sections of aligned 16S rDNA sequences available for 753 species in the Human Oral Microbiome Database and submitted them to the RDP classifier with a 80% confidence cutoff. The entire V5 120-base region as well as the 59-base segments from its forward end lead to many fewer unclassified sequences than their V6-region counterparts. (Table 1). Therefore, the paired-end data from the ~82-base V5 region we amplified in the current study would provide a means to capture taxonomic information suitable for studying the microbial diversity with the Illumina technology, similar to that of the favored V1–3 and V6 regions which are used when longer sequence reads are possible.
Table 1.
RDP Classification of aligned segments of the 16S rRNA genes from the 753 sequences in the Human Oral Microbiome Database, using 80% confidence level cutoffs with the RDP Classifier software.
| Percentage of sequences classified for different 16S rDNA regions | |||||||
|---|---|---|---|---|---|---|---|
| Position in 16S rDNAa | 8–1520 | 28–512 | 798–856 | 798–879 | 798–917 | 993–1051 | 932–1051 |
| Variable region (s) | All | V123 | V5 | V5 | V5 | V6 | V6 |
| Sequence length (nt) | 1513 | 485 | 59 Fb | 82 | 120 | 59 Rb | 120 |
| Phylum | |||||||
| Firmicutes | 38.6 | 36.8 | 28.6 | 32.9 | 35.7 | 25.3 | 32.3 |
| Proteobacteria | 15.1 | 15.1 | 15.1 | 15.0 | 15.1 | 14.8 | 14.7 |
| Actinobacteria | 10.8 | 10.8 | 9.7 | 10.4 | 10.6 | 7.1 | 10.4 |
| Fusobacteria | 5.7 | 5.7 | 4.7 | 5.7 | 5.7 | 3.1 | 4.6 |
| Bacteroidetes | 17.8 | 17.8 | 9.9 | 14.5 | 16.6 | 7.8 | 16.9 |
| Spirochaetes | 8.6 | 8.2 | 3.5 | 5.8 | 8.1 | 3.9 | 5.2 |
| Unclassified | 0.1 | 2.4 | 28 | 13.8 | 5.6 | 35.8 | 13.7 |
Numbering corresponds to the E. coli 16S rRNA gene sequence.
F, from the forward end; R, from the reverse end.
We explored the microbial diversity of the pooled saliva and oropharyngeal swab samples from three individuals by targeting the 16S rDNA hypervariable V5 regions. Of 1,373,824 obtained reads, 1,237,319 [publicly available at the MG-RAST repository (Meyer et al., 2008) under ID:4444448.3] passed the quality control. They were clustered in 377,275 distinct sequences most of which (330,815) were unique.
3.2. Taxonomic analysis of the oral microbiota
We analyzed the taxonomic composition and abundance of the oral bacterial community using GAST (Huse et al., 2008), the MG-RAST server (Meyer et al., 2008) and the RDP classifier (Wang et al., 2007). RDP’s Seqmatch program may also eventually be useful for determining which sequences in the RDP database are most closely related to our sequences, it works for sequences as short as 7 bases but only for 2000 sequences at a time.
The mean RDP confidence level for the six taxonomic levels from domain to genus was calculated as a function of the sequence abundance. The confidence decreases as the sequence copy number decreases (Fig. 1). This general trend is most likely due to the fact that the most frequent sequences correspond to known species whose 16S rDNA sequences are available. Conversely, the rare species include a higher proportion of 16S rDNA sequences absent or distant from those in the RDP reference database. In addition, the probability that a sequence contains an error is expected to be higher in low frequency sequences (Andersson et al., 2008).
Fig. 1.

Average confidence level for the six taxonomic levels as a function of sequence counts.
To limit the impact of sequencing errors, we removed all sequences that occurred less than three times. This new dataset contains 865,540 reads representing 25,978 distinct sequences. We discarded 381 reads (<0.05%) with a GAST distance that diverged more than 30% from their nearest reference sequence, leaving 865,159 sequences. For the MGRAST analysis with a minimum alignment length of 50 and a maximum BLAST e-value of 10−10 21,713 sequences (2.5%) were removed, leaving 843,827 sequences. The phylogenetic assignments using the RDP classifier were performed after two additional filtering steps. They included the removal of sequences that were better classified when considered as reverse complements and those that had <80% confidence at the domain level. In this way the number of reads was reduced to 854,968 (24,757 distinct sequences).
The combined saliva and oropharyngeal swab samples were dominated by the phyla Firmicutes, Proteobacteria, Actinobacteria, Fusobacteria, TM7 and Spirochaetes (Table 2), that are also abundant in other oral samples assessed by means of phyloarrays (Huyghe et al., 2008) or massively parallel pyrosequencing of the 16S rDNA clones or amplicons (Keijser et al., 2008; Nasidze et al., 2009a). Their proportions, however, differ in different studies (Table 2). Removing the 80% confidence cut-off in the RDP classification results in phyla breakdown that are very similar between RDP and GAST (data not shown); however, bootstrap values of less than 80% cannot be trusted. The MG-RAST server and RDP classifer returned a higher fraction of unclassified bacteria, likely because they are not well designed for such short sequences. This may explain the lower content of major phyla relative to that generated by GAST which was designed specifically for short tag sequences. Proteobacteria is an exception since their abundances were similar with the three classification tools. Therefore, the RDP- and MG-RAST-based classification of V5 rDNA sequences appeared to be more sensitive for Proteobacteria than for other major phyla. Indeed, the RDP classification of the HOMD 16S rDNA sequences showed that the relative abundance of Proteobacteria, in contrast to those of other major phyla, was not reduced when using 59-base V5 sequences instead of their full length counterparts (Table 1).
Table 2.
Comparison of oral phyla abundance obtained using different classification tools.
| Phylum | Percentage of total sequences classified
|
|||
|---|---|---|---|---|
| Saliva+throat swab
|
Saliva (Keijser et al., 2008) | |||
| GASTa | MG-RASTb | RDPc | ||
| Firmicutes | 61.2 | 28.6 | 39.3 | 40.7 |
| Proteobacteria | 29.3 | 29.9 | 27.8 | 21 |
| Actinobacteria | 4.9 | 4.1 | 2.8 | 6.3 |
| Fusobacteria | 2.9 | 0.93 | 1.6 | 2.9 |
| TM7 | 1.2 | 1.2 | 0.0063 | 1.9 |
| Bacteroidetes | 0.027 | 0.026 | 0.021 | 27.2 |
| BRC1 | 0.07 | 0.076 | 0 | 0 |
| OP10 | 0.12 | 0.040 | 0 | 0 |
| Spirochaetes | 0.20 | 0.20 | 0.064 | 0.2 |
| Cyanobacteria | 0.0007 | 0.0020 | 0.0016 | 0.020 |
| SR1 | 0.013 | 0 | 0.0013 | 0.014 |
| Acidobacteria | 0.0018 | 0 | 0 | 0.049 |
| OP3 | 0.0006 | 0 | 0 | 0 |
| Unclassified Bacteria | 0.023 | 35 | 28.5 | 0.2 |
NR, not reported.
≤30% divergent from their nearest reference sequence.
Maximum e-value 10−10 and minimum alignment length of 50 nucleotides.
80% confidence cutoff applied at the phylum level.
The ability to identify taxa from class down to the genus level varied between phyla and was dependent on the classification approach (Fig. 2). For the six major phyla, GAST generated the highest proportion of reads placed at these levels of taxonomy. Fusobacteria and Spirochaetes had the largest proportion of reads that can be confidently placed at the genus level using all three classification approaches. This proportion was the lowest for Proteobacteria despite their robust classification at the phylum level (see above).
Fig. 2.
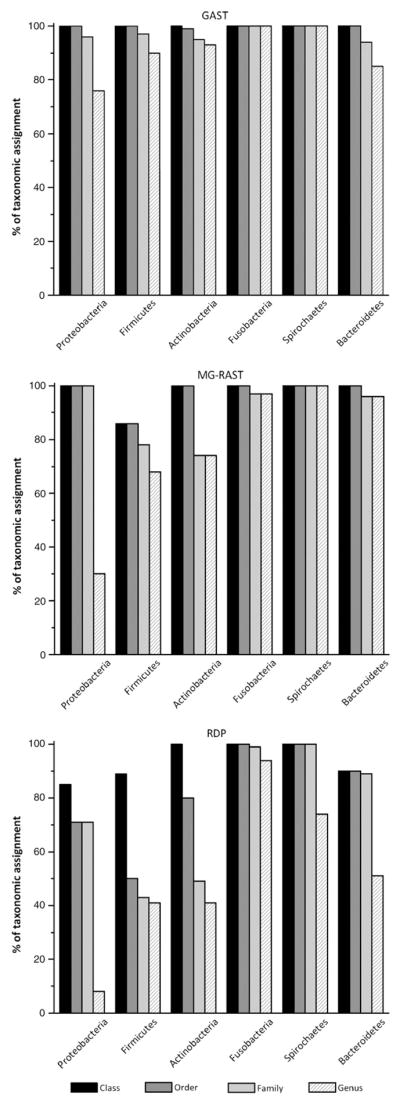
Proportions of taxonomic assignments under the phylum level. Reads assigned to each of the four taxonomic levels for each major phylum are represented by bars. Their height represent the percentage of reads that can be placed at a given level of taxonomy using GAST, the MG-RAST server and the RDP Classifier.
Some consider organisms with more than 1.3% sequence difference in 16S rDNA sequence (based on the full-length) to belong to different species (Stackebrandt and Ebers, 2006). Since a single nucleotide difference in a 59-base-long sequence corresponds to a 1.7% resolution, there may be more than 25,000 species-level phylotypes in our dataset (Fig. 3). For a more conservative estimate of species-level phylotypes, we used a cutoff of 3% corresponding to a 2-base resolution (Stackebrandt and Goebel, 1994) to create clusters of sequences. There are at least 8,000 different phylotypes at the 3% level. This will be an underestimate since we removed all sequences occurring less than three times prior to analysis. These filtered sequences would include valid but rare organisms as well as many low-quality sequences.
Fig. 3.

Rarefaction analysis of the oral metagenome. The curves include only sequences which occur 3 or more times. The number of OTUs with different cutoff values was plotted as a function of the number of sequences sampled. OTUs with ≥97%, ≥95% and ≥90% pairwise sequence identity are arbitrarily assumed to form the same species, genus and family, respectively.
We used rarefaction analysis to determine the microbial diversity recovery in the filtered dataset. The rarefaction curve is very stable at ~8000 (Fig. 3), suggesting that the sampling completeness is high — at least 30,000 additional reads would be required to discover a new unique phylotype, and more than 120,000 additional reads would be required to discover a new 3% phylotype. The removal of unique sequences impacts the rarefaction curve, and may underestimate the potential for new species detection in human saliva samples. However, sampling is sufficient among the sequences likely to be prevalent in human saliva because they were found at least 3 times.
A total of 135 genera or next higher taxonomic ranks were identified by GAST (Appendix A). The most frequent genera were Neisseria and Streptococcus, constituting about 70% of the sequences. Thirty-four taxa have not been identified in previous studies of oral microbiotas (Keijser et al., 2008; Nasidze et al., 2009a,b) and are not listed in the Human Oral Microbiome Database. They include some low-abundance genera as well as putative members of the candidate divisions BRC1, OP10, OP3. The MG-RAST server also identified BRC1 and OP10 sequences.
The observed relative low abundance in Bacteroidetes in our data compared to previous studies may be accounted for by many factors including sampling from different anatomical sites, individual variation, sample size, as well as potential bias in lysis, amplification and classification. Indeed, it has been shown that some of the “frequent” species are absent in some individuals (Aas et al., 2005). Good oral hygiene is known to decrease the proportion of Gram-negative bacteria including some Bacteroidetes species. The amplification bias has been invoked to explain a decline of Bacteroidetes in a metagenomic study of a series of fecal samples (Andersson et al., 2008). This is unlikely to be the case in our study since the PCR primers used cover 104 of 107 (97%) Bacteroidetes species listed in the HOMD.
To the best of our knowledge this is the first metagenomic study based on the utilization of the Illumina high-throughput sequencing technology. Illumina sequencing provides more sequence reads per run, allowing for more in-depth coverage than the competing technologies. This enables analysis of larger sample sizes, inclusion of more bar-coded time-points and samples, and better assessment of total diversity in microbial communities. Metagenomic studies of other human microbial communities in the gut, stomach and skin have shown that it is not clear whether a core community of bacteria is common to most humans, making the less common species important to understanding human health and disease (Hamady and Knight, 2009).
The advantage of generating and sequencing short 16S rDNA amplicons for bacterial community analysis is that it reduces the likelihood of generating chimera and increases the likelihood of detecting low-abundance taxa (Huber et al., 2009). Moreover, reads of 100–200 bases obtained with carefully chosen amplification primers can yield the same clustering as long 16S rDNA sequences (Liu et al., 2007).
There is a concern that short read length may compromise the classification quality. However, for the current Illumina read length using the V5 region of the 16S rDNA, taxonomic assessment at the phylum level is sufficient to effectively compare samples. The taxonomic analysis based on the Illumina technology will be improved by paired-end reads (Table 1) which are expected not only to generate longer sequences but also to increase the sequence quality. Since the probability of a sequencing error increases with the read length (Qu et al., 2009), partially overlapping complementary reads of the same amplicon may help to predict sequencing errors and aid the removal of ambiguous reads or parts of reads.
Supplementary Material
Acknowledgments
This work was supported by grants from the Swiss National Science Foundation 3100A0-112370/1 (JS) and 3100A0-116075 (PF), and United States National Institutes of Health grant UH2DK083993 (SH).
Appendix A. Supplementary data
Supplementary data associated with this article can be found, in the online version, at 10.1016/j.mimet.2009.09.012.
References
- Aas JA, Paster BJ, Stokes LN, Olsen I, Dewhirst FE. Defining the normal bacterial flora of the oral cavity. J Clin Microbiol. 2005;43:5721–5732. doi: 10.1128/JCM.43.11.5721-5732.2005. [DOI] [PMC free article] [PubMed] [Google Scholar]
- Andersson AF, Lindberg M, Jakobsson H, Backhed F, Nyren P, Engstrand L. Comparative analysis of human gut microbiota by barcoded pyrosequencing. PLoS ONE. 2008;3:e2836. doi: 10.1371/journal.pone.0002836. [DOI] [PMC free article] [PubMed] [Google Scholar]
- Avila M, Ojcius DM, Yilmaz O. The oral microbiota: living with a permanent guest. DNA Cell Biol. 2009;28:405–411. doi: 10.1089/dna.2009.0874. [DOI] [PMC free article] [PubMed] [Google Scholar]
- Cole JR, Chai B, Farris RJ, Wang Q, Kulam SA, McGarrell DM, Garrity GM, Tiedje JM. The Ribosomal Database Project (RDP-II): sequences and tools for high-throughput rRNA analysis. Nucleic Acids Res. 2005;33:D294–D296. doi: 10.1093/nar/gki038. [DOI] [PMC free article] [PubMed] [Google Scholar]
- Cox-Foster DL, Conlan S, Holmes EC, Palacios G, Evans JD, Moran NA, Quan PL, Briese T, Hornig M, Geiser DM, Martinson V, vanEngelsdorp D, Kalkstein AL, Drysdale A, Hui J, Zhai J, Cui L, Hutchison SK, Simons JF, Egholm M, Pettis JS, Lipkin WI. A metagenomic survey of microbes in honey bee colony collapse disorder. Science. 2007;318:283–287. doi: 10.1126/science.1146498. [DOI] [PubMed] [Google Scholar]
- DeSantis TZ, Hugenholtz P, Larsen N, Rojas M, Brodie EL, Keller K, Huber T, Dalevi D, Hu P, Andersen GL. Greengenes, a chimera-checked 16S rRNA gene database and workbench compatible with ARB. Appl Environ Microbiol. 2006;72:5069–5072. doi: 10.1128/AEM.03006-05. [DOI] [PMC free article] [PubMed] [Google Scholar]
- Edgar RC. MUSCLE: multiple sequence alignment with high accuracy and high throughput. Nucleic Acids Res. 2004;32:1792–1797. doi: 10.1093/nar/gkh340. [DOI] [PMC free article] [PubMed] [Google Scholar]
- Faveri M, Mayer MP, Feres M, de Figueiredo LC, Dewhirst FE, Paster BJ. Microbiological diversity of generalized aggressive periodontitis by 16S rRNA clonal analysis. Oral Microbiol Immunol. 2008;23:112–118. doi: 10.1111/j.1399-302X.2007.00397.x. [DOI] [PubMed] [Google Scholar]
- Fraser CM, Eisen J, Fleischmann RD, Ketchum KA, Peterson S. Comparative genomics and understanding of microbial biology. Emerg Infect Dis. 2000;6:505–512. doi: 10.3201/eid0605.000510. [DOI] [PMC free article] [PubMed] [Google Scholar]
- Friedrich MJ. Microbiome project seeks to understand human body’s microscopic residents. JAMA. 2008;300:777–778. doi: 10.1001/jama.300.7.777. [DOI] [PubMed] [Google Scholar]
- Hamady M, Knight R. Microbial community profiling for human microbiome projects: tools, techniques, and challenges. Genome Res. 2009;19:1141–1152. doi: 10.1101/gr.085464.108. [DOI] [PMC free article] [PubMed] [Google Scholar]
- Huber JA, Morrison HG, Huse SM, Neal PR, Sogin ML, Mark Welch DB. Effect of PCR amplicon size on assessments of clone library microbial diversity and community structure. Environ Microbiol. 2009;11:1292–1302. doi: 10.1111/j.1462-2920.2008.01857.x. [DOI] [PMC free article] [PubMed] [Google Scholar]
- Huse SM, Dethlefsen L, Huber JA, Welch DM, Relman DA, Sogin ML. Exploring microbial diversity and taxonomy using SSU rRNA hypervariable tag sequencing. PLoS Genet. 2008;4:e1000255. doi: 10.1371/journal.pgen.1000255. [DOI] [PMC free article] [PubMed] [Google Scholar]
- Huyghe A, Francois P, Charbonnier Y, Tangomo-Bento M, Bonetti EJ, Paster BJ, Bolivar I, Baratti-Mayer D, Pittet D, Schrenzel J. Novel microarray design strategy to study complex bacterial communities. Appl Environ Microbiol. 2008;74:1876–1885. doi: 10.1128/AEM.01722-07. [DOI] [PMC free article] [PubMed] [Google Scholar]
- Katoh K, Misawa K, Kuma K, Miyata T. MAFFT: a novel method for rapid multiple sequence alignment based on fast Fourier transform. Nucleic Acids Res. 2002;30:3059–3066. doi: 10.1093/nar/gkf436. [DOI] [PMC free article] [PubMed] [Google Scholar]
- Keijser BJ, Zaura E, Huse SM, van der Vossen JM, Schuren FH, Montijn RC, ten Cate JM, Crielaard W. Pyrosequencing analysis of the oral microflora of healthy adults. J Dent Res. 2008;87:1016–1020. doi: 10.1177/154405910808701104. [DOI] [PubMed] [Google Scholar]
- Kuehbacher T, Rehman A, Lepage P, Hellmig S, Folsch UR, Schreiber S, Ott SJ. Intestinal TM7 bacterial phylogenies in active inflammatory bowel disease. J Med Microbiol. 2008;57:1569–1576. doi: 10.1099/jmm.0.47719-0. [DOI] [PubMed] [Google Scholar]
- Lipkin WI. Microbe hunting in the 21st century. Proc Natl Acad Sci USA. 2009;106:6–7. doi: 10.1073/pnas.0811420106. [DOI] [PMC free article] [PubMed] [Google Scholar]
- Liu Z, Lozupone C, Hamady M, Bushman FD, Knight R. Short pyrosequencing reads suffice for accurate microbial community analysis. Nucleic Acids Res. 2007;35:e120. doi: 10.1093/nar/gkm541. [DOI] [PMC free article] [PubMed] [Google Scholar]
- Mager DL, Haffajee AD, Devlin PM, Norris CM, Posner MR, Goodson JM. The salivary microbiota as a diagnostic indicator of oral cancer: a descriptive, non-randomized study of cancer-free and oral squamous cell carcinoma subjects. J Transl Med. 2005;3:27. doi: 10.1186/1479-5876-3-27. [DOI] [PMC free article] [PubMed] [Google Scholar]
- Meyer F, Paarmann D, D’Souza M, Olson R, Glass EM, Kubal M, Paczian T, Rodriguez A, Stevens R, Wilke A, Wilkening J, Edwards RA. The metagenomics RAST server — a public resource for the automatic phylogenetic and functional analysis of metagenomes. BMC Bioinformatics. 2008;9:386. doi: 10.1186/1471-2105-9-386. [DOI] [PMC free article] [PubMed] [Google Scholar]
- Nakamura S, Maeda N, Miron IM, Yoh M, Izutsu K, Kataoka C, Honda T, Yasunaga T, Nakaya T, Kawai J, Hayashizaki Y, Horii T, Iida T. Metagenomic diagnosis of bacterial infections. Emerg Infect Dis. 2008;14:1784–1786. doi: 10.3201/eid1411.080589. [DOI] [PMC free article] [PubMed] [Google Scholar]
- Nasidze I, Li J, Quinque D, Tang K, Stoneking M. Global diversity in the human salivary microbiome. Genome Res. 2009a;19:636–643. doi: 10.1101/gr.084616.108. [DOI] [PMC free article] [PubMed] [Google Scholar]
- Nasidze I, Quinque D, Li J, Li M, Tang K, Stoneking M. Comparative analysis of human saliva microbiome diversity by barcoded pyrosequencing and cloning approaches. Anal Biochem. 2009b;391:64–68. doi: 10.1016/j.ab.2009.04.034. [DOI] [PubMed] [Google Scholar]
- Pruesse E, Quast C, Knittel K, Fuchs BM, Ludwig W, Peplies J, Glockner FO. SILVA: a comprehensive online resource for quality checked and aligned ribosomal RNA sequence data compatible with ARB. Nucleic Acids Res. 2007;35:7188–7196. doi: 10.1093/nar/gkm864. [DOI] [PMC free article] [PubMed] [Google Scholar]
- Qu W, Hashimoto S, Morishita S. Efficient frequency-based de novo short-read clustering for error trimming in next-generation sequencing. Genome Res. 2009;19:1309–1315. doi: 10.1101/gr.089151.108. [DOI] [PMC free article] [PubMed] [Google Scholar]
- Raghavendran K, Mylotte JM, Scannapieco FA. Nursing home-associated pneumonia, hospital-acquired pneumonia and ventilator-associated pneumonia: the contribution of dental biofilms and periodontal inflammation. Periodontol. 2007;2000 (44):164–177. doi: 10.1111/j.1600-0757.2006.00206.x. [DOI] [PMC free article] [PubMed] [Google Scholar]
- Schloss PD, Handelsman J. Introducing DOTUR, a computer program for defining operational taxonomic units and estimating species richness. Appl Environ Microbiol. 2005;71:1501–1506. doi: 10.1128/AEM.71.3.1501-1506.2005. [DOI] [PMC free article] [PubMed] [Google Scholar]
- Sibley CD, Rabin H, Surette MG. Cystic fibrosis: a polymicrobial infectious disease. Future Microbiol. 2006;1:53–61. doi: 10.2217/17460913.1.1.53. [DOI] [PubMed] [Google Scholar]
- Stackebrandt E, Goebel BM. Taxonomic note: a place for DNA–DNA reassociation and 16S rRNA sequence analysis in the present species definition in bacteriology. Int J Syst Bacteriol. 1994;44:846–849. [Google Scholar]
- Stackebrandt E, Ebers J. Taxonomic parameters revisited: tarnished gold standards. Microbiol Today. 2006;33:152–155. [Google Scholar]
- Turnbaugh PJ, Hamady M, Yatsunenko T, Cantarel BL, Duncan A, Ley RE, Sogin ML, Jones WJ, Roe BA, Affourtit JP, Egholm M, Henrissat B, Heath AC, Knight R, Gordon JI. A core gut microbiome in obese and lean twins. Nature. 2009;457:480–484. doi: 10.1038/nature07540. [DOI] [PMC free article] [PubMed] [Google Scholar]
- Venter JC, Remington K, Heidelberg JF, Halpern AL, Rusch D, Eisen JA, Wu D, Paulsen I, Nelson KE, Nelson W, Fouts DE, Levy S, Knap AH, Lomas MW, Nealson K, White O, Peterson J, Hoffman J, Parsons R, Baden-Tillson H, Pfannkoch C, Rogers YH, Smith HO. Environmental genome shotgun sequencing of the Sargasso Sea. Science. 2004;304:66–74. doi: 10.1126/science.1093857. [DOI] [PubMed] [Google Scholar]
- Wang Q, Garrity GM, Tiedje JM, Cole JR. Naive Bayesian classifier for rapid assignment of rRNA sequences into the new bacterial taxonomy. Appl Environ Microbiol. 2007;73:5261–5267. doi: 10.1128/AEM.00062-07. [DOI] [PMC free article] [PubMed] [Google Scholar]
- Williamson SJ, Rusch DB, Yooseph S, Halpern AL, Heidelberg KB, Glass JI, Andrews-Pfannkoch C, Fadrosh D, Miller CS, Sutton G, Frazier M, Venter JC. The Sorcerer II Global Ocean Sampling Expedition: metagenomic characterization of viruses within aquatic microbial samples. PLoS ONE. 2008;3:e1456. doi: 10.1371/journal.pone.0001456. [DOI] [PMC free article] [PubMed] [Google Scholar]
Associated Data
This section collects any data citations, data availability statements, or supplementary materials included in this article.