Abstract
Drug “ligands” that bind G protein-coupled receptors (GPCRs) can either stimulate, fully (full agonists) or partially (partial agonists), or reduce (inverse agonists) basal receptor activity, by stabilizing different receptor conformations. The term “intrinsic efficacy” was introduced as a parameter to express the ability of a ligand to activate its receptor and to differentiate the varying signaling capacity of diverse ligands when they occupy the same fraction of a single receptor. Most methods use downstream biochemical and physiological responses as proxies of “intrinsic efficacy” but cannot measure it directly at the level of the receptor. Here I describe the development of a Förster resonance energy transfer (FRET) approach that permits the rigorous measurement of the intrinsic efficacy of a ligand directly at the level of a GPCR and independent from variation in experimental conditions. This approach also allows intrinsic efficacies of ligands to be linked with the effects of receptor polymorphisms or receptor heterodimerization.
Keywords: G protein-coupled receptor, α2A-Adrenergic receptor, β1-Adrenergic receptor, GPCR heterodimer, GPCR polymorphisms, Heterotrimeric G proteins, Förster resonance energy transfer, Ligand efficacy, Conformational changes, FlAsH labeling
1. Introduction
G protein-coupled receptors (GPCRs) serve as cell surface switches to transmit extracellular sensory (e.g., light, taste, and odorant molecules), chemical (e.g., drugs), and physiological (e.g., hormones, ions) signals into cells. These receptors regulate cell functions primarily by activating heterotrimeric Gαβγ-proteins located on the cytoplasmic face of the cell membrane. Activated G proteins then regulate the activity of effector molecules such as adenylyl cyclases and phosphoplipase C, which control the production of intracellular second messengers such as cAMP and inositol 1,4,5-trisphosphate, respectively. These responses are usually terminated by the binding of the receptor to cytosolic arrestins (β-arrestin-1 and -2) that coordinate in space and time receptor and G protein uncoupling, as well as receptor internalization (1). This latter event may also promote various distal signaling responses such as those mediated by mitogen-activated protein (MAP) kinase cascades. Key regulators of a large palette of physiological functions such as heart rate, bone formation, and mineral metabolism among others, GPCRs are also involved in many pathological processes, and are the targets of a majority of clinical drugs.
A fundamental property of drugs acting at receptors is their capacity to produce either a maximal (full agonists) or submaximal (partial agonists) receptor-mediated response even upon total occupancy of receptors by the drug, or reduce (inverse agonists) basal levels of receptor signaling. The term “intrinsic efficacy” was introduced as a parameter to express the ability of a drug “ligand” to activate its receptor and produce a functional response (2). The intrinsic efficacy of a ligand can thus be used to differentiate the varying signaling capacity of diverse ligands when they occupy the same fraction of a single receptor. Most methods use downstream biochemical and physiological responses as proxies of “intrinsic efficacy” but cannot measure it directly. These methods rely traditionally on measurements of second messenger production, protein phosphorylation, level of gene expression, or even smooth muscle cell relaxation. Since the varying number of receptors, G proteins, and effector molecules encountered in diverse cell types and tissues unavoidably affects these measurements, the efficacy of a ligand at the level of its receptor has remained inaccessible. One of the difficulties in measuring rigorously the intrinsic efficacy of a compound is illustrated in Fig. 1. In this example, VIP2–28, a fragment of the vasoactive intestinal peptide (VIP), increased cAMP levels in cells expressing a high amount of VIP type 1 receptors (VIP1-R) as efficiently as the native hormone, but displayed partial agonism in cell expressing ≈ eightfold less VIP1-R (3). The measurement of ligand efficacy is thus sensitive to experimental conditions. These difficulties can now be circumvented by an optical approach based on the FRET principle, which directly measures changes in receptor conformation upon ligand binding (see below). This strategy permits the rigorous measurement of the intrinsic efficacy of a ligand directly at the level of the receptor and independent from variation in either receptor number or cell conditions.
Fig. 1.

Experiment illustrating the difficulty of accurately measuring ligand efficacy. Concentration-response of VIP(1–28) ( filled circles ) and VIP(2–28) (open circles) stimulated adenylyl cyclase activity in plasma membrane from CHO cells expressing a high (850 ± 50 fmol receptor/mg proteins) or low (100 ± 30 fmol receptor/mg proteins) level of VIP receptor. Adapted from (3).
1.1. The FRET Principle
Initially described by the French physicist Jean Perrin in 1930 (4) and later elucidated by the German scientist Theodor Förster in 1948 (5), Förster resonance energy transfer (FRET) is a process by which an excited fluorophore molecule (the donor) transfers its energy nonradiatively to an acceptor fluorophore partner. This energy transfer occurs when both donor and acceptor molecules are <100 Å of each other, and share a spectral overlap between the donor’s emission and acceptor’s absorption spectra. The efficiency of the energy transfer (ET) depends on dipole orientation and distances between donor and acceptor molecules - ET falls off with the sixth power of the distance between the two fluorophore moieties. FRET can thus report interactions between different proteins by the measurement of intermolecular FRET (in this case, the two fluorophores are in two separate proteins), as well as conformational changes within a single protein by the measurement of intramolecular FRET (the fluorophores are within a single protein) (6).
The cyan fluorescent protein (CFP) and yellow fluorescent protein (YFP) form a popular donor/acceptor FRET pair for studies of protein–protein interactions or conformational changes in a given protein (7). This pair has a strong spectral overlap and permits excellent resolution for recording FRET with both dual emission photometry and imaging systems and can provide powerful insights into kinetics and mechanisms of protein associations, and protein conformational changes in live cells (8, 9). These two GFP variants can be easily incorporated into proteins by genetic engineering, and can be used to monitor the complex formation between two proteins, and quantify kinetics of the initial steps involved in GPCR signaling such as in ligand binding, receptor activation, receptor and G protein coupling, G protein activation, and second messenger propagation in live cells (10).
A limitation is the requirement for external excitation of the CFP to initiate the fluorescence transfer, which leads to a slight direct excitation of the YFP (called cross-talk). In addition to this direct excitation of the YFP by light at 436 nm, another critical source of consideration is the partial overlap of the CFP emission spectrum that is detectable in the channels used to detect YFP (called bleed-through). These two sources of non-FRET signal, however, can be easily controlled and corrected (see Subheading 6.3).
1.2. Design of GPCR Biosensors
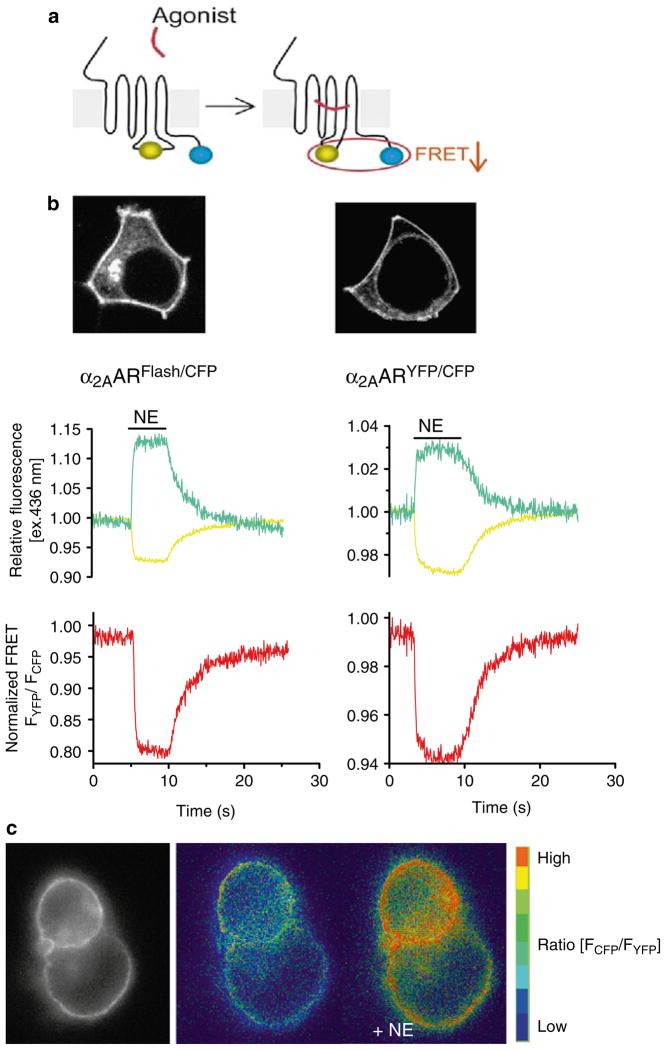
Both the kinetics and magnitude of GPCR activation can be determined with high temporal resolution in live cells using GPCR biosensors that use FRET to measure intramolecular conformational changes. These biosensors are designed by inserting one fluorescent moiety into the third intracellular loop of the receptor and the other fluorescent moiety into the receptor carboxy terminus. For example, GPCR biosensors can be made with either CFP/YFP, or with CFP/FlAsH (Fluorescein Arsenical Hairpin binder) as FRET pairs (8, 9). In this latter case, CFP is generally fused (or inserted) to the carboxy terminus of the receptor and the tetracysteine motif CCPGCC, which can specifically bind the membrane-permeable dye FlAsH, is inserted in the third intracellular loop of the same receptor. These receptor constructs (referred to as GPCRCFP/YFP or GPCRCFP/FlAsH) are usually well expressed and functional, although the size of the CFP/YFP protein tags can cause reduced signaling responses (9). Because CFP and YFP (or FlAsH) are in close proximity in the inactive receptor, energy is efficiently transferred and both the cyan and yellow light emitted by CFP and YFP are detected upon CFP illumination. When agonist binding induces a conformational change in the receptor, the relative distance and/or dipole–dipole orientation between the fluorescent partners in the FRET pair change, resulting in rapid loss of FRET. This FRET change can be monitored as the change in the ratio of emission intensities of yellow and cyan fluorescence, FCFP/FYFP (Fig. 2). Formation of the active receptor state in response to ligand binding is monitored as a fast decrease of the FRET ratio, which usually follows a monoexponential time course. This approach has been successfully applied to several different GPCRs, and allows detailed analysis of the kinetics of ligand-mediated receptor activation as well as its direct visualization in live cells (6).
Fig. 2.
Comparing the CFP/YFP and FlAsh/CFP FRET pair constructs of the α2A-adrenergic receptor. (a) Design of a GPCR biosensor (blue circles CFP, greenish yellow circles YFP/FlAsH). GPCR activation is monitored by a decrease in FRET between CFP and YFP (or FlAsH) inserted in the third intracellular loop and C-termini of the receptor, respectively. (b) Upper panels; confocal pictures show the cellular expression of the α2A-AR Flash/CFP and α2A-AR YFP/CFP in transiently transfected HEK-293 cells. Note that both receptor constructs exhibit predominant localization to the plasma membrane. Lower panels; changes in the fluorescence of CFP and Flash (left ) or CFP and YFP (right ), and corresponding FRET ratio FYFP/FCFP in response to a saturating concentration of norepinephrine (NE; 100 μM) recorded from a single HEK-293 cell expressing α2A-AR Flash/CFP or α2A-AR YFP/CFP. Initial values of relative fluorescence (cyan traces for CFP, and yellow traces for YFP or Flash) and the FRET ratio (red traces) were set to one. The fractional decrease of FRET in response to NE reflects the intramolecular conformational switch accompanying receptor activation. Measurements were performed in single cells continuously perfused with buffer or with ligand for the time indicated by the horizontal bar. (c) FRET imaging of receptor activation in HEK293 cells transiently tranfected with α2A-AR CFP/YFP. The left panel shows the epifluorescence image and the next two panels present the pseudo-colored FRET ratio before and after stimulation by NE. Adapted from (9).
1.3. Recording Ligand Efficacy
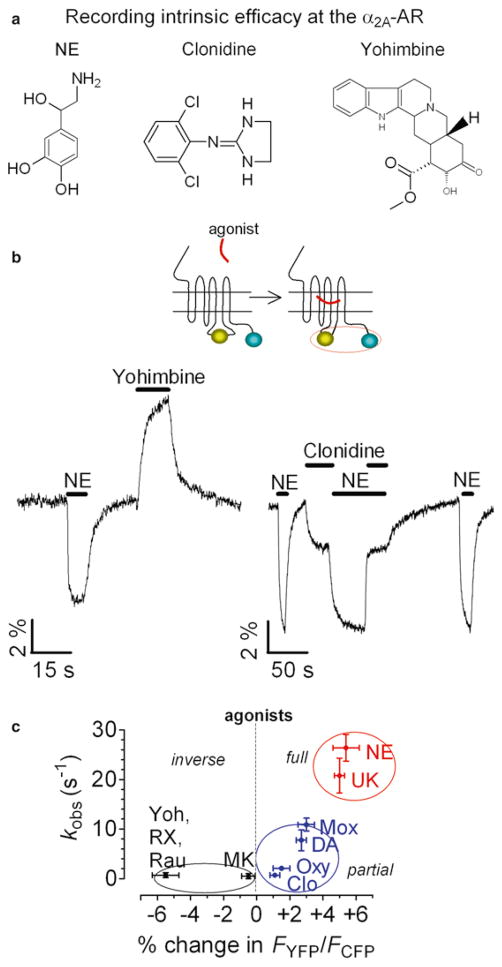
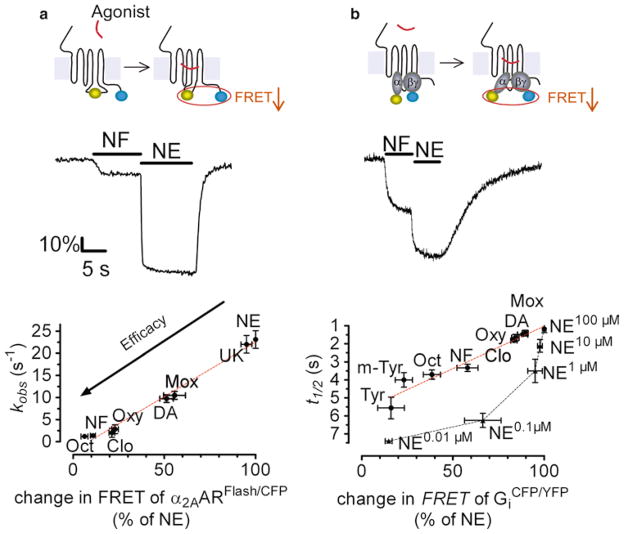
Experiments are usually performed under an inverted microscope, where light at 436 nm selectively excites a single cell expressing a GPCR biosensor (GPCRFlash/CFP or GPCRCFP/YFP) to induce donor (CFP) and acceptor (FlAsH or YFP) emission fluorescence which is simultaneously recorded over time. Studies in live cells expressing a α2A-adrenergic receptor (α2A-AR) biosensor, α2A-AR CFP/YFP or α2A-AR CFP/FlAsH, serve here as examples of the experimental strategy used to measure intrinsic efficacies of ligands acting at GPCRs (8, 9, 11–13). These studies have demonstrated that full, partial, and inverse agonists of different chemical structures and efficacies produce FRET signals that correspond exactly to their predicted pharmacological properties: full and partial agonists cause a decrease in FRET of different magnitudes, whereas inverse agonists cause FRET to increase (Fig. 3) (11). These ligands not only induce conformational changes of a different nature and magnitude, but divergence also appears in the kinetics of receptor activation: FRET changes of the receptor biosensor have revealed fast conformational changes for full agonists (rate constant τ ≈ 50 ms), smaller and slower changes for partial agonists (τ < 1 s), and even slower changes (τ ≈ 1 s) in the opposite direction in response to inverse agonists (11, 12). These different kinetics depend on neither structural differences between ligands nor their binding affinities but correlate very well with the functional efficacy of ligand, as measured by activation of the inhibitory G protein Gi (Fig. 4) (12). These differences can be interpreted as evidence that GPCRs in live cells not only switch between an inactive “off” receptor state and a ligand-bound “on” active receptor state but also adopt distinct conformations in response to compounds of different intrinsic efficacies. Therefore, both the amplitudes and the kinetics of change in intramolecular FRET can be used to classify compounds as full, partial, or inverse agonists, and can be used to directly monitor intrinsic efficacy of compounds acting directly at a given receptor.
Fig. 3.
Direct recording of intrinsic efficacy at a GPCR. (a) Chemical structure of norepinephrine (NE), clonidine (Clo), and yohimbine (Yoh) as examples of full, partial and inverse α2A-AR agonists, respectively. (b) Example of FRET signals seen during sequential application of ligands of distinct efficacies to a single HEK-293 cell expressing α2AAR YFP/CFP. The left trace represents the FRET signals mediated by NE, and yohimbine. The right trace represents the action of saturating concentrations of the NE or clonidine added alone or together. Note that the simultaneous application of NE and clonidine restored the partial response seen with clonidine alone. This corresponds to the predicted properties of a high-affinity partial agonist. (c) The correlation between the rate constant (k−1) of receptor activation, and respective extent of FRET amplitude seen with ligands of different efficacies. Adapted from (11,12).
Fig. 4.
Relation between ligand efficacy and kinetics of receptor activation and G protein activation. (a, b) Traces represent recording of the FRET ratio, FYFP/FCFP, as examples of action of agonists on HEK-293 cells expressing α2AARFlash/CFP (a), or the wild-type α2AAR together with GαiYFPβ1γ2 CFP (b). Plots show the rate constant of receptor activation (a) or half-time of G protein activation (b) when the efficacy of the agonist varies. Values were obtained from fitting the kinetic recording with a monoexponential equation. Note that decreasing NE concentrations decrease the degree and rate of Gi activation but did not mimic the action of partial agonists. α2AAR full agonists: norepinephrine (NE), UK-14,304 (UK); α2AAR partial agonists: dopamine (DA), octopamine (Oct), norphenylephrine (NF), tyramine (Tyr), m-tyramine (m-Tyr), moxonidine (Mox), clonidine (Clo), oxymetazoline (Oxy). Adapted from (12).
1.4. Ligand Efficacy Modulated by GPCR Polymorphisms
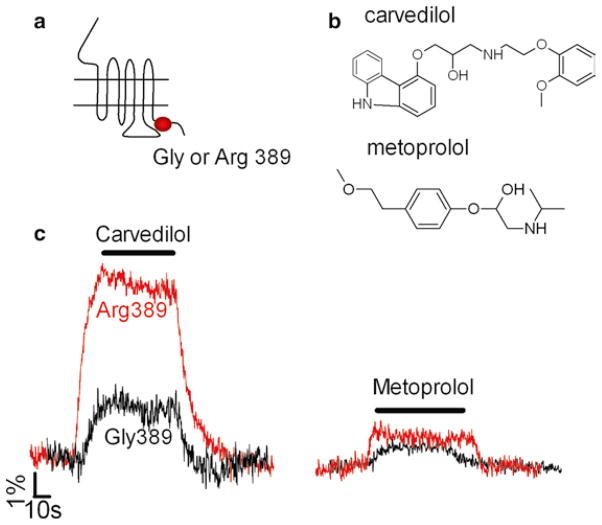
The capacity to record the effects of ligand efficacy directly at the level of the receptor also makes it possible to detect how GPCR polymorphisms might modify ligand efficacies. The results of a recent FRET study done with a β1-adrenergic receptor biosensor, β1-AR CFP/YFP (14), showed that carvedilol differentiated itself from metoprolol and bisoprolol, two other powerful β-blockers, by a specific and marked inverse agonist effects at the Arg389-variant of the receptor (Fig. 5). The specific effect of carvedilol on the Arg389-variant of the β1AR revealed by this FRET study was further confirmed by a physiological assay that measured the beating frequency in cardiac myocytes expressing the two receptor variants (14). This FRET study thus opens a strategy to the determination and differentiation of the intrinsic efficacies of clinical drugs acting at variants of the same receptor.
Fig. 5.
Linking GPCR polymorphisms and ligand efficacy. (a) Schematic representation of β1-adrenergic receptor variants. (b) Chemical structure of two β-blockers. (c) Effect of β1-adrenergic receptor polymorphisms on beta-blocker responses. Examples of the FRET ratio FYFP/FCFP signals recorded from single cells expressing the Gly389– β1AR CFP/YFP sensor (black traces) or the Arg389–β1ARCFP/YFP sensor (gray traces) after application the beta-blockers carvedilol or metoprolol. Note the marked inverse agonist effect of carvedilol on the Arg389-β1AR variant. Adapted from (14).
1.5. Ligand Efficacy Modulated by GPCR Heterodimerization
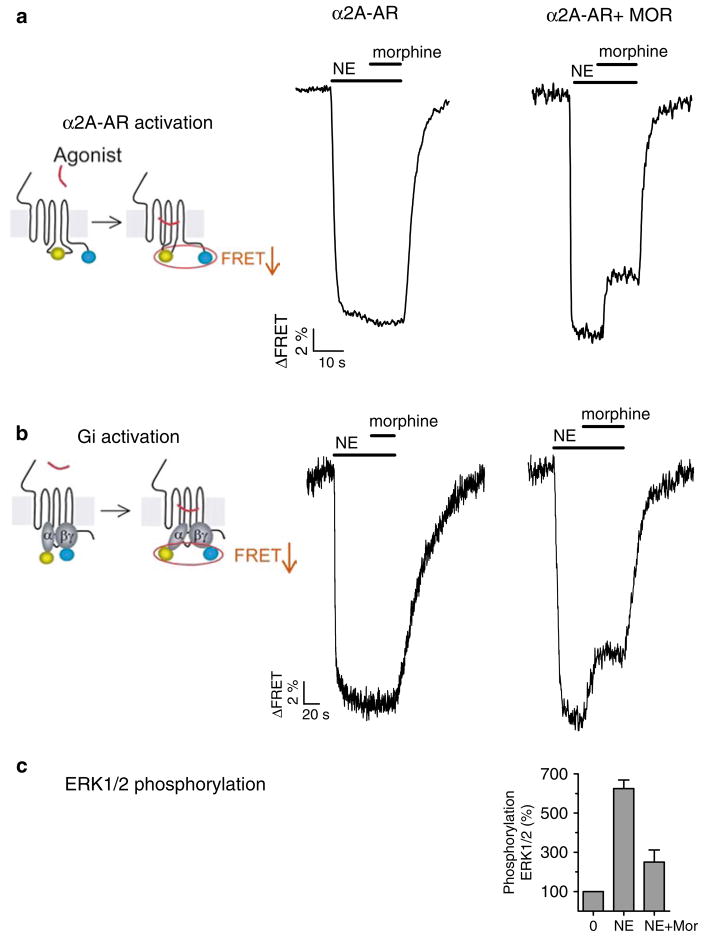
Recent studies revealed that allosteric interactions between GPCR heterodimers, mediated by direct cross-conformational changes between receptors, can modulate the intrinsic efficacy of a ligand (13). For example, in the heterodimer formed by the two inhibitory G protein (Gi)-coupled α2A-adrenergic/μ-opioid receptors, morphine binding to the μ-opioid receptor triggers a conformational change in the norepinephrine (NE)-bound α2A-adrenergic receptor that decreases the efficacy of NE to activate its receptor. This allosteric regulation by morphine in turn decreases both NE-mediated inhibitory G protein (Gi) activation and NE-mediated MAP kinase activation (Fig. 6) (13). Thus, conformational cross-talk between receptors is able to modulate the intrinsic efficacy and physiological response to two different ligands acting simultaneously at a receptor heteromer.
Fig. 6.
Cross-conformational switching between GPCR heteromers modulate ligand efficacy. (a, b) Left panels illustrate the design of FRET sensors (filled circles CFP, open circles YFP/FlAsH) for receptor activation (a) and G protein activation (b), which are monitored by recording changes in FRET between CFP and FlAsH (or YFP); center panels show examples of activation of the α2A-AR, and the inhibitory G protein, Gi, which were monitored in a single HEK-293 cell expressing α2A-AR FlAsH/CFP (a) or the wild-type α2A-AR and GαiYFPβ1γ2CFP (b); right panels show similar experiments in cell coexpressing the μ-opioid receptor MOR. Horizontal bars indicate the application of NE or morphine to the cell. (c) Maximal NE effect on phosphorylation of ERK1/2 in cells coexpressing α2A-AR FlAsH/CFP and MOR. Note that NE acts as a partial agonist when the MOR is activated by morphine. Adapted from (13).
2. Materials
2.1. Cell Culture
Glass coverslips 24 mm.
Six-well and 10 cm tissue culture dishes.
Adherent cells such as human embryonic kidney (HEK-293) or rat osteosarcoma (ROS 17/2.8) cells among others (see Note 1).
Growth medium for HEK-293 cells: DMEM supplemented with 10% FCS (Fetal Calf Serum), 1% L-Glutamine (200 mM), 1% penicillin (10,000 units/ml)/Streptomycin (10 mg/ml) solution.
Transfection reagents such as Effectene (Qiagen), FuGene (Roche Pharmaceuticals), among others (see Note 2).
Phosphate-buffered saline (PBS).
Poly-L-lysine 0.01% w/v in phosphate-buffered saline (PBS) stored at 4°C.
2.2. FlAsH Labeling
Hank’s balanced salt solution (HBSS): 150 mM NaCl, 10 mM HEPES pH 7.4, 25 mM KCl, 4 mM CaCl2, 2 mM MgCl2, 10 mM glucose (add freshly).
1,2-Ethanedithiol (EDT) stock (Fluka).
Dimethylsulfoxide (DMSO) stock.
TC-FlAsH™ stock solution: 1 mg/ml (Invitrogen).
2.3. FRET Assay
HEPES/BSA buffer: 137 mM NaCl, 5 mM KCl, 1 mM CaCl2,1 mM MgCl2, 20 mM HEPES, 0.1% (w/v) bovine serum albumin (BSA), pH 7.4.
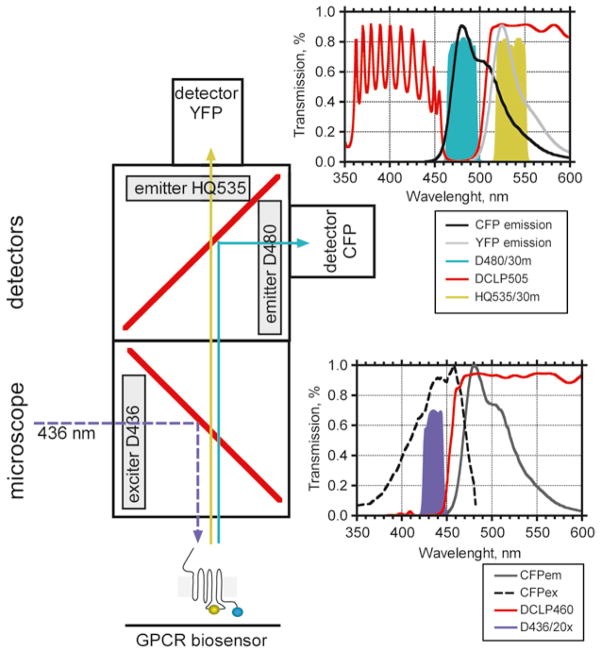
Photometric detection system (see Fig. 7): inverted fluorescent microscope (e.g., Zeiss Axiovert 200) equipped with an oil immersion 60× or 100× objective and a dual emission photometric system (TILL Photonics). Filter sets for CFP/YFP FRET (Chroma): excitation filter 436/20, beam splitter dichroic long-pass DCLP460 (CFP excitation); emission intensities are recorded by using 535/30 M (YFP emission), 480/30 M (CFP emission), DCLP505 (beam splitter).
Perfusion system: computer-assisted solenoid valve rapid superfusion device that permits rapid solution exchanges within 5–10 ms (ALA-VM8, ALA Scientific Instruments).
Imaging chamber: Attofluor cell chamber (Molecular Probes).
Analytical software: Origin 7.1 (Microcal); Clampex; GraphPAd Prism.
Fig. 7.
Fluorescent microscope system for CFP/YFP FRET detection. Experiments are performed under an inverted fluorescent microscope equipped with a “FRET cube” containing an excitation filter D436/20 and beam splitter DCLP460 for CFP excitation. Light at 436 nm selectively excites cells expressing a GPCR biosensor to induce CFP and YFP emission fluorescence, which is detected by using a “beam splitter cube” with the following filter combination: 535/30 M (YFP emission), 480/30 M (CFP emission), DCLP505 (beam splitter). Plots represent excitation and emission characteristics of CFP and YFP, as well as spectral profiles of filters and mirrors used.
3. Methods
3.1. Cell Preparation for FRET Measurement
Soak glass coverslips in poly-l-lysine solution for 20 min.
Wash the coated coverslips with PBS and place them into six-well plates or 10 cm tissue culture dishes.
Seed cells stably or transiently expressing a GPCR biosensor onto coated glass coverslips and maintain the cell culture in growth medium overnight at 37°C in a humidified atmosphere (95% air and 5% CO2).
Label cells with FlAsH if you are using cells expressing a GPCRFlAsH/CFP.
3.2. FlAsH Labeling
For convenience, cells on coverslips are placed in six-well plates and then labeled with FlAsH–EDT.
For 1 plate, freshly prepare EDT/DMSO by mixing 2.1 μl EDT stock with 1 ml DMSO (EDT/DMSO solution).
Incubate 6.3 μl FlAsH stock solution with 6.3 μl EDT/DMSO solution for 10–15 min at room temperature.
Wash the cells three times with HBSS.
Add 1 ml HBSS per well.
Mix 12.6 μl FlAsH/EDT with 300 μl HBSS, then add an additional 6 ml of HBSS.
Incubate the cells with 1 ml of FlAsH/HBSS per well for 1 h at 37°C.
Freshly prepare the wash solution by mixing 42 μl EDT with 1 ml DMSO, and then adding 25 μl of this mix to 50 ml HBSS buffer.
Wash cells three times with 3 ml wash solution at 37°C; 10 min each wash.
Incubate the cells with 1 ml medium or HBSS/glucose until FRET recording.
3.3. Recording Ligand-Induced Changes in FRET
Mount a cover slip in an imaging chamber and carefully wash cells with HEPES/BSA buffer; place the chamber on a fluorescence inverted microscope equipped with an oil immersion 60× or 100× objective and a dual emission photometric system.
Turn on the monochromator, and under the binocular select a single cell expressing the GPCRCFP/YFP or GPCRCFP/FlAsH by exciting cells at 436 nm (CFP excitation). CFP emission is selectively observed using the DCLP460 dichroic and D480/30 m emission filter; YFP emission can be selectively observed using the DCLP505 dichroic and the HQ535/30 m emission filter (Fig. 7). For experiments involving G protein biosensors see Notes 3–6.
Perfuse the selected cell with HEPES/BSA buffer using a computer-assisted solenoid valve rapid superfusion device.
At the beginning of each experiment, record the emission intensity of YFP upon direct excitation at 500 nm (using HQ500/20 excitation and HQ535/30 m emission filters, and the DCLP505 dichroic). These data will be used in the data analysis (see Subheading 3.4).
Start FRET recording with excitation at 436 nm to induce cyan (CFP) and, via FRET, yellow (FlAsH or YFP) fluorescence, using a FRET cube containing the 436/10 excitation filter nm and the DCLP460 nm dichroic (Fig. 7). The illumination time is typically set to 5–10 ms with a frequency between 5 and 200 Hz. See Note 7.
Record the baseline for ≈20 s and use the perfusion system to exchange buffer and ligands as appropriate for the experiment. Collect data.
3.4. Data Analysis
-
The FRET ratio is corrected according to Eq. 1:
(1) where FYFP ex436/em535 and FCFPex436/em480 represent, respectively, the emission intensities of YFP (recorded at 535 nm) and CFP (recorded at 480 nm) upon excitation at 436 nm; a and b represent correction factors for the bleed-through of CFP into the 535 nm channel (a) and the cross-talk due to the direct YFP excitation by light at 436 nm (b). FYFPex500/em535 represents the emission intensity of YFP (recorded at 535 nm) upon direct excitation at 500 nm, and was recorded at the beginning of each experiment. Note that the bleed-through of YFP into the 480 nm channel usually is negligible. To ensure that CFP- and YFP-labeled molecule expression is similar in examined cells, experiments should be performed in cells displaying comparable fluorescence levels.
-
The changes in the FRET ratio are usually analyzed using nonlinear regression to one- or two-exponential models:
where A1 and A2 are the amplitudes of the two phases, A0 is the baseline at t = ∞, k1 and k2 are the rate constants (s−1) for the two phases, and t is the time. The best fit can be judged by the analysis of residuals (i.e., differences between the experimental data and the calculated curve fits). Changes in emission due to photobleaching are systematically subtracted, and data are analyzed using Origin 7.1 software or Prism.
Acknowledgments
This work was supported by start-up funds from the Department of Pharmacology & Chemical Biology, University of Pittsburgh School of Medicine and by National Institutes of Health (NIH) grant DK087688. I thank Tim Feinstein for careful comments on this manuscript.
Footnotes
Transiently or stably transfected cells work equally well in the FRET assay described here. The following cell types have been successfully used in this FRET assay: Chinese hamster ovary cells (CHO), human embryonic kidney cells (HEK 293); Osteoblastic cell lines such as rat osteosarcoma cells (ROS 17/2.8), UMR 106, mouse MC-3T3; neuron-like rat PC12 cells; primary culture of rat hippocampal neurons.
Cells can be easily transfected using diverse transfection reagents such as Effectene™ (Qiagen), FuGENE™ (Roche), X-tremeGENE™ (Roche), or protocols based on the DEAE-dextran or calcium-phosphate methods (16). Stably expressing cells can be generally selected after 3–4 weeks of drug treatment (e.g., hygromycin).
Controls and conditions for studies involving G proteins. The physiological relevance of new information obtained by FRET approaches may be questioned by the use of recombinant fluorescent fusion proteins expressed at high levels in cultured cells. Therefore, a number of controls and conditions should be performed to test the effect of molecular crowding (17).
Design of G protein biosensors. For FRET assays involving the measurement of G proteins activation (Fig. 4b), GFP variants are attached to the G protein subunits at various positions. For example, CFP or YFP can be inserted at position 91 of Gαi, whereas Gβ1- and Gγ2-subunits are fused to GFP variants at their C- or N-termini. These constructs are functional with respect to receptor coupling as well as effector activation. C-terminal labeling of the γ-subunit, however, resulted in loss of the lipid modification site and, thus, in reduced membrane targeting. Based on the classical model that receptor-mediated activation of G protein results in the dissociation between α and βγ subunits, activation of FRET-based G protein sensors (GαYFP.GβγCFP) should presumably drive a loss in FRET. Unexpectedly, an increase in FRET was observed in some cases, thus revealing that activation of G protein in live cells proceeds via conformational or dissociational events.
Optimize expression conditions to ensure low to moderate expression levels G protein constructs based on Western blot analysis of endogenous and expressed CFP or YFP-labeled G proteins using antibodies against the Gα subunit or fluorescent proteins.
For experiments involving the coexpression a GPCR and Gα-YFP plus Gβγ-CFP subunits for the diverse G proteins, expression conditions should be optimized to ensure a ≈1:1 molar expression ratio of CFP and YFP constructs at moderate expression levels. A CFP–YFP dimer construct in which the ratio is constrained to 1:1 could be used as a control. To ensure that G proteins expression (i.e., coexpression of GαYFP and GβγCFP) is similar in examined cells, experiments should be performed in cells displaying comparable fluorescence levels.
CFP and YFP emissions are simultaneously recorded over time. FRET is monitored as a YFP/CFP emission intensity ratio upon excitation at 436 nm. The emission fluorescence intensities are determined at 535 ± 15 nm (YFP) and 480 ± 20 nm (CFP) with a beam splitter DCLP of 505 nm, and are detected by avalanche photodiodes and are digitalized using an analog/digital converter and stored on a personal computer using Clampex 10.0 software (Axon Instruments).
References
- 1.Kendall RT, Luttrell LM. Diversity in arrestin function. Cell Mol Life Sci. 2009;66:2953–73. doi: 10.1007/s00018-009-0088-1. [DOI] [PMC free article] [PubMed] [Google Scholar]
- 2.Neubig RR, Spedding M, Kenakin T, Christopoulos A. International union of pharmacology nomemclature and rug classification. Upadate on tgerms and symbols in quantitative pharmacology. Pharmcol Rev. 2003;55:597–606. doi: 10.1124/pr.55.4.4. [DOI] [PubMed] [Google Scholar]
- 3.Ciccarelli E, Vilardaga JP, De Neef P, DiPaolo E, Waelbroeck M, Bollen A, Robberecht P. Properties of the VIP-PACAP type II receptor stably expressed in CHO cells. Regulatory Peptides. 1994;54:397–407. doi: 10.1016/0167-0115(94)90537-1. [DOI] [PubMed] [Google Scholar]
- 4.Perrin J Théorie quantique des transferts d’activation entre molécules de même espèce. Cas des solutions fluorescentes. Ann Chim Phys. 1932;17:283–313. [Google Scholar]
- 5.Förster T. Zwischenmolekulare Energiewanderung und Fluoreszenz. Ann Physik (Leipzig) 1948;2:55–75. [Google Scholar]
- 6.Vilardaga JP, Bünemann M, Feinstein TN, Lambert N, Nikolaev VO, Engelhardt S, Lohse MJ, Hoffmann C. GPCR and G proteins: drug efficacy and activation in live cells. Mol Endocrinol. 2009;23:590–99. doi: 10.1210/me.2008-0204. [DOI] [PMC free article] [PubMed] [Google Scholar]
- 7.Balla T. Green light to illuminate signal transduction events. Trends Cell Biol. 2009;19:575–86. doi: 10.1016/j.tcb.2009.08.001. [DOI] [PMC free article] [PubMed] [Google Scholar]
- 8.Vilardaga JP, Bünemann M, Krasel C, Castro M, Lohse MJ. A millisecond activation switch for G protein-coupled receptors in living cells. Nat Biotechnology. 2003;21:807–12. doi: 10.1038/nbt838. [DOI] [PubMed] [Google Scholar]
- 9.Hoffmann C, Gaietta G, Bünemann M, Adams RS, Oberforff-Maas S, Behr B, Vilardaga J-P, Tsien RY, Ellisman MH, Lohse MJ. A FLASH-based approach to determine G protein-coupled receptor activation in living cells. Nature Methods. 2005;2:171–76. doi: 10.1038/nmeth742. [DOI] [PubMed] [Google Scholar]
- 10.Ferrandon S, Feinstein TN, Castro C, Bouley R, Potts JT, Gardella TJ, Vilardaga JP. Sustained cyclic AMP production by parathyroid hormone receptor endocytosis. Nat Chem Biol. 2009;5:734–42. doi: 10.1038/nchembio.206. [DOI] [PMC free article] [PubMed] [Google Scholar]
- 11.Vilardaga JP, Steinmeyer R, Harms G, Lohse MJ. Molecular basis of inverse agonism in a G protein-coupled receptor. Nat Chem Biol. 2005;1:25–8. doi: 10.1038/nchembio705. [DOI] [PubMed] [Google Scholar]
- 12.Nikolaev OV, Hoffmann C, Bünemann M, Lohse MJ, Vilardaga J-P. Molecular basis of partial agonism at the neurotransmitter α2A-adrenergic receptor and Gi-protein heterotrimer. J Biol Chem. 2006;281:24506–11. doi: 10.1074/jbc.M603266200. [DOI] [PubMed] [Google Scholar]
- 13.Vilardaga JP, Nikolaev OV, Lorentz K, Ferrandon S, Zhuang Z, Lohse MJ. Direct inhibition of G protein signaling by cross-conformational switches between α2A-adrenergic and m-opioid receptors. Nat Chem Biol. 2009;4:126–31. doi: 10.1038/nchembio.64. [DOI] [PubMed] [Google Scholar]
- 14.Rochais F, Vilardaga J-P, Bünemann M, Lohse MJ, Engelhardt S. Real-time optical recording of β1-adrenergic receptor activation reveals supersensitivity of the Arg389 variant to carvedilol. J Clin Invest. 2007;117:229–35. doi: 10.1172/JCI30012. [DOI] [PMC free article] [PubMed] [Google Scholar]
- 15.Xia Z, Liu Y. Reliable and global measurement of fluorescence resonance energy transfer using fluorescence microscopes. Biophys J. 2001;81:2395–02. doi: 10.1016/S0006-3495(01)75886-9. [DOI] [PMC free article] [PubMed] [Google Scholar]
- 16.Ausubel FM, Brent R, Kingston RE, Moore DD, Seidman JG, Smith JA, Struhl K. Current Protocols in Molecular Biology. Wiley; New York: 1997. [Google Scholar]
- 17.Hein P, Frank M, Hoffmann C, Lohse MJ, Bünemann M. Dynamic of receptor/G protein coupling in living cells. EMBO J. 2005;24:4106–14. doi: 10.1038/sj.emboj.7600870. [DOI] [PMC free article] [PubMed] [Google Scholar]


