Abstract
Background
In spite of intensive efforts, understanding of the genetic aspects of familial prostate cancer remains largely incomplete. In a previous microsatellite-based linkage scan of 1233 prostate cancer (PC) families, we identified suggestive evidence for linkage (i.e. LOD≥1.86) at 5q12, 15q11, 17q21, 22q12, and two loci on 8p, with additional regions implicated in subsets of families defined by age at diagnosis, disease aggressiveness, or number of affected members.
Methods
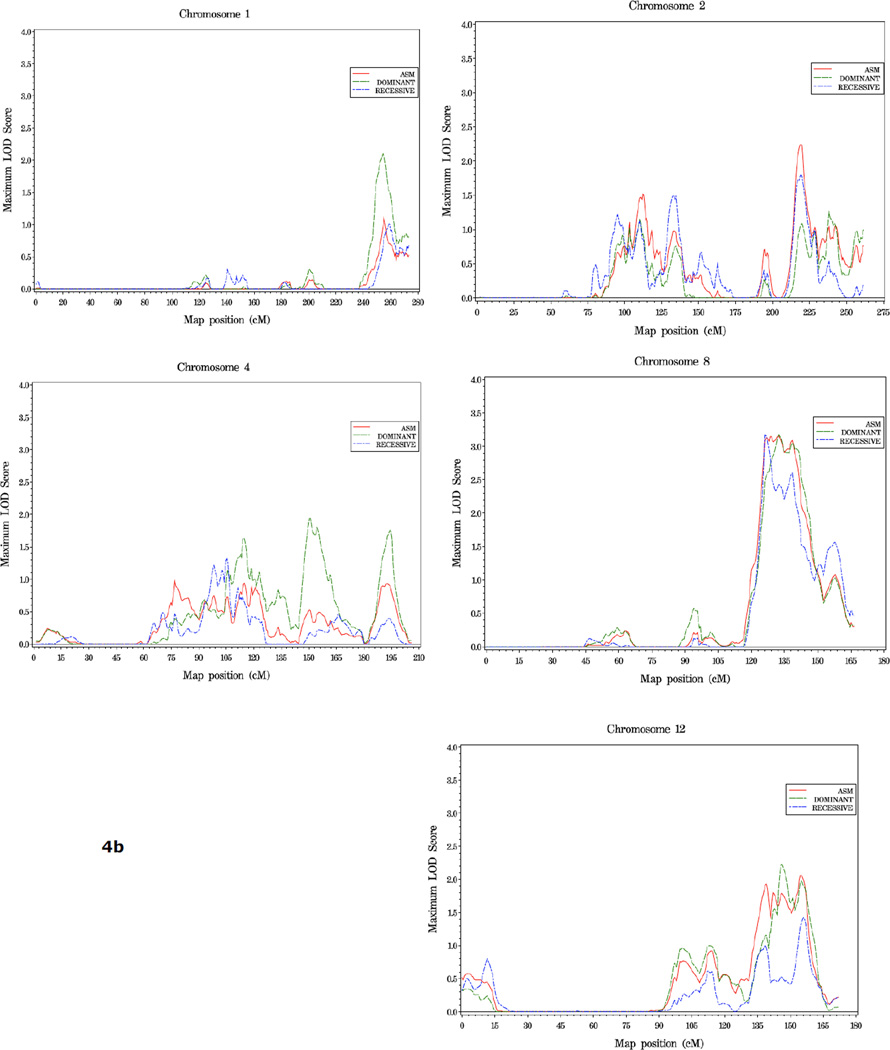
In an attempt to replicate these findings and increase linkage resolution, we used the Illumina 6000 SNP linkage panel to perform a genome-wide linkage scan of an independent set of 762 multiplex PC families, collected by 11 ICPCG groups.
Results
Of the regions identified previously, modest evidence of replication was observed only on the short arm of chromosome 8, where HLOD scores of 1.63 and 3.60 were observed in the complete set of families and families with young average age at diagnosis, respectively. The most significant linkage signals found in the complete set of families were observed across a broad, 37 cM interval on 4q13-25, with LOD scores ranging from 2.02 to 2.62, increasing to 4.50 in families with older average age at diagnosis. In families with multiple cases presenting with more aggressive disease, LOD scores over 3.0 were observed at 8q24 in the vicinity of previously identified common PC risk variants, as well as MYC, an important gene in PC biology.
Conclusions
These results will be useful in prioritizing future susceptibility gene discovery efforts in this common cancer.
Introduction
The recent discoveries of multiple SNPs across the genome as common, reproducible genetic risk factors for prostate cancer (PC) have been impressive. Over 30 common sequence variants have now been confirmed to be associated with PC risk, emphasizing the polygenic nature of inherited susceptibility for this disease (1). In spite of the substantial progress in this area, current estimates suggest that the identified loci do not explain the majority of the excess risk associated with PC family history (1), one of the most reproducible risk factors for PC (2,3).
Attempts to map PC susceptibility genes by linkage analysis of individual family collections have yielded few reproducible leads despite numerous genome-wide scans, most likely due to genetic and disease heterogeneity (4–6). In an effort to address this question more effectively, we previously carried out a large linkage study that included 1233 PC families collected by members of the International Consortium for Prostate Cancer Genetics (ICPCG) (7). This study provided strong evidence that one or a few major genes cannot account for the majority of disease in PC families. At the same time, a number of loci demonstrated suggestive linkage signals, consistent with a complex genetic etiology for this disease. To extend these studies using a higher resolution marker set, and to assess which of these linkage signals might warrant additional investigation, in this report we describe a second combined linkage analysis with 6000 SNPs to interrogate an independent set of 762 families collected by the ICPCG.
RESULTS
Study Population - 762 Prostate Cancer Families
Table 1 summarizes the characteristics of the 762 PC families from the 11 ICPCG groups participating in this analysis. Fifty-three percent of families had a mean age at diagnosis of <65 years, and 21% had four or more affected family members. Most of the families (65%) were collected in Europe or Australia, with the remainder collected in the U.S. The current analysis was restricted to Caucasian families; analysis of linkage results from African American pedigrees collected by members of the ICPCG will be described in a separate report.
Table 1.
Characteristics of 762 ICPCG Families
| Mean Age at Diagnosis | Number of Affected Members | Families with Aggressive PCa |
TOTAL | |||||||
|---|---|---|---|---|---|---|---|---|---|---|
| ICPCG MEMBER | <65 | ≥65 | 2 | 3 | 4 | ≥5 | Families | Affected Individuals |
Non-Affected Individuals |
|
| ACTANE | 108 | 71 | 89 | 72 | 13 | 5 | 150 | 179 | 380 | 83 |
| Univ TAMPERE | 24 | 33 | 16 | 32 | 6 | 3 | 42 | 57 | 144 | 159 |
| CeRePP | 87 | 87 | 110 | 49 | 11 | 4 | 63 | 174 | 385 | 73 |
| FHCRC | 3 | 10 | 12 | 1 | 0 | 0 | 3 | 13 | 27 | 0 |
| JHU | 19 | 5 | 2 | 10 | 5 | 7 | 10 | 24 | 78 | 24 |
| MAYO Clinic | 6 | 5 | 2 | 6 | 2 | 1 | 0 | 11 | 29 | 10 |
| Univ MICHIGAN | 88 | 43 | 55 | 58 | 12 | 6 | 0 | 131 | 344 | 0 |
| Northwestern Univ | 12 | 2 | 11 | 3 | 0 | 0 | 0 | 14 | 29 | 6 |
| Univ UMEA | 11 | 24 | 7 | 19 | 7 | 2 | 4 | 35 | 88 | 25 |
| Univ ULM | 34 | 16 | 17 | 28 | 5 | 0 | 17 | 50 | 114 | 21 |
| Univ UTAH | 13 | 61 | 0 | 0 | 55 | 19 | 59 | 74 | 143 | 268 |
| TOTAL | 405 | 357 | 321 | 278 | 116 | 47 | 348 | 762 | 1761 | 699 |
SNP Scan Linkage Results
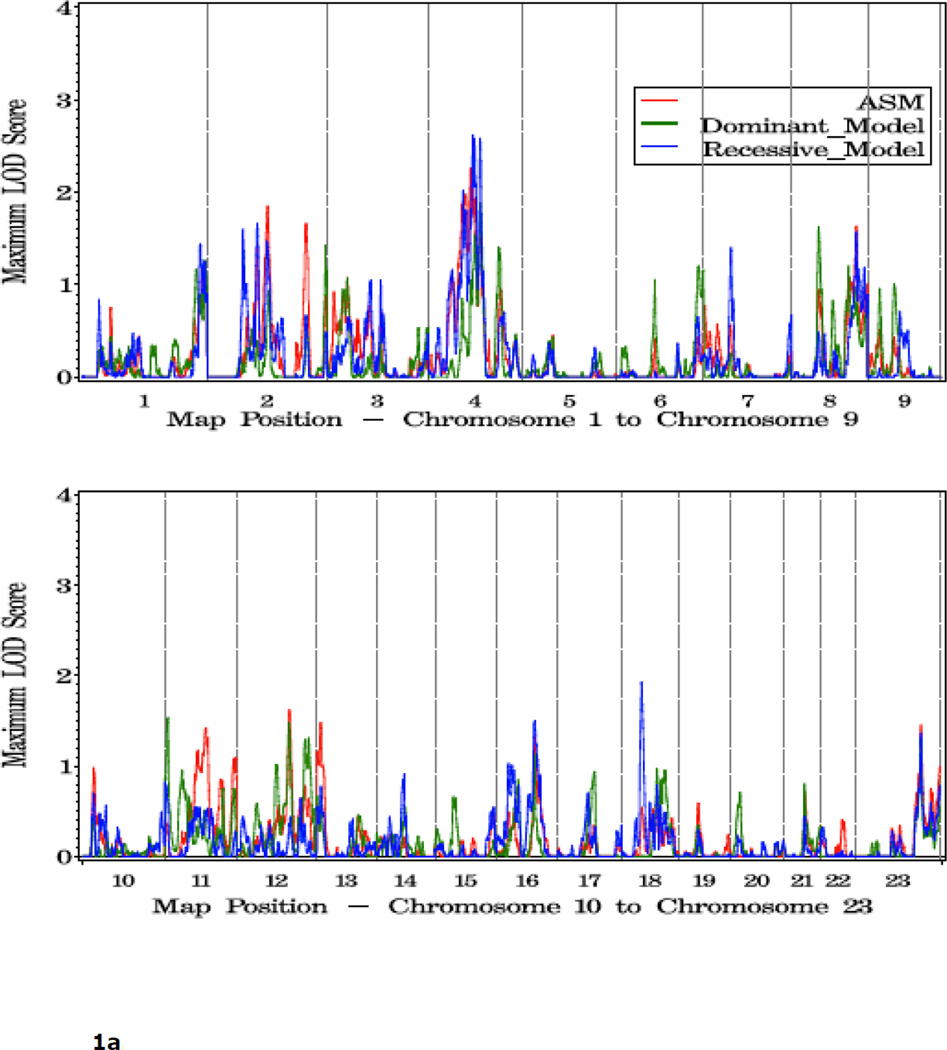
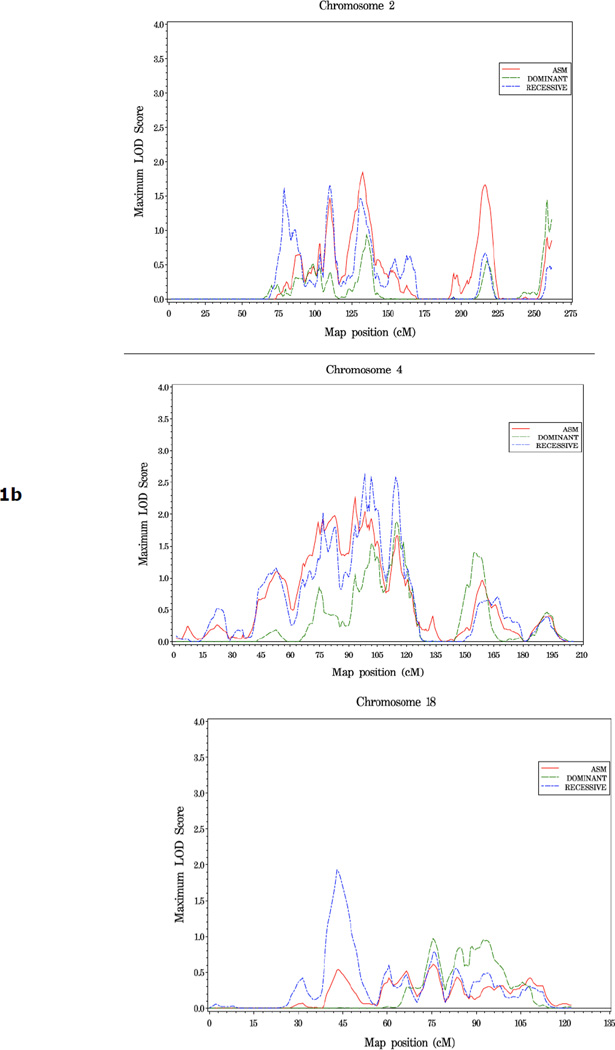
Shown in Figure 1 and Table 2 are the linkage results for the entire set of 762 families using dominant (dom), recessive (rec), and nonparametric (KCLOD or asm) linkage models. The strongest evidence of linkage in the complete set of families is located in a broad region with multiple peaks on the proximal and mid-q arm of chromosome 4. A maximum HLOD=2.62 was observed under a recessive model at 4q22 at 97 cM, along with several other peaks over 1.86 between 74 cM and 115 cM, 4q13-25. An examination of LOD scores by individual family collection indicates that six of the seven largest family collections had scores over 0.9 in the 12 cM interval between 83 cM and 102 cM on this chromosome, using either a recessive or asm model (Table 3).
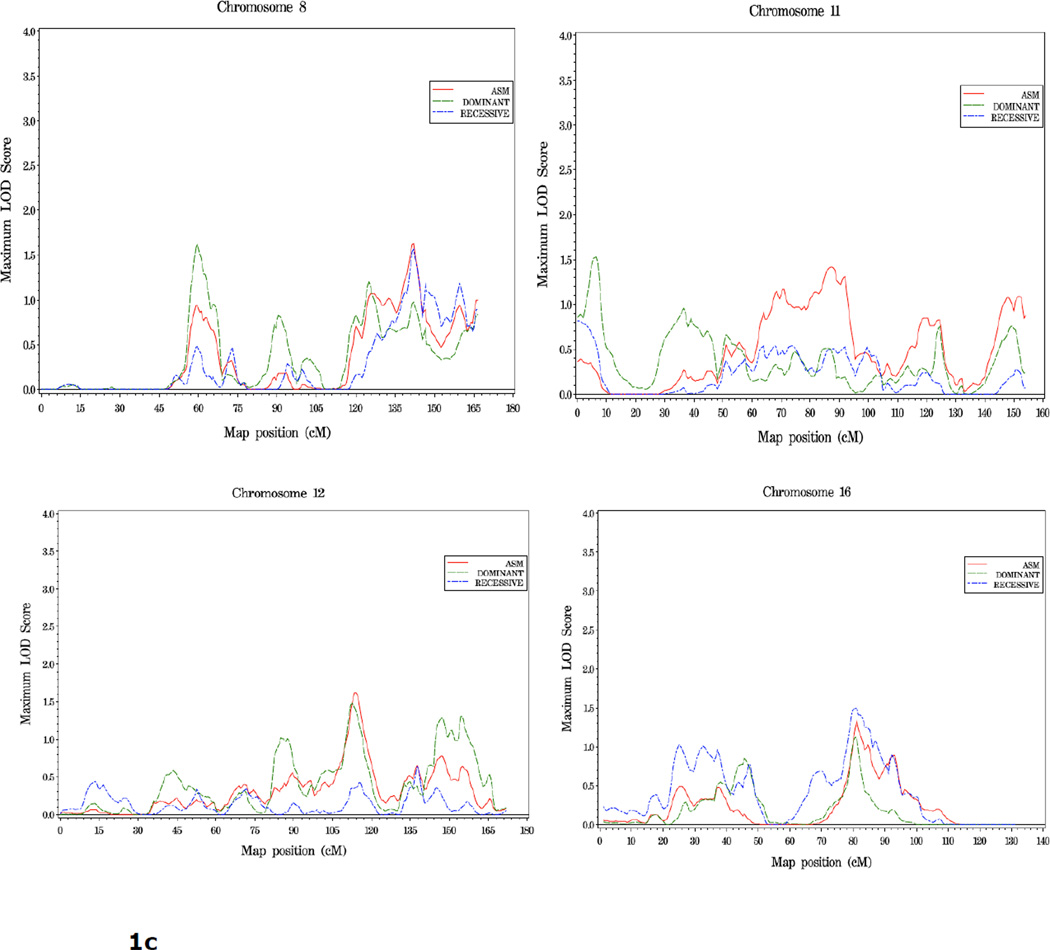
Figure 1.
a. Plot of LOD scores for all families by chromosome.
b. Chromosomes with LOD scores > 1.86 in all families.
c. Chromosomes with LOD Scores > 1.5 in all families.
Table 2.
LOD Score Summary - All Families (n = 762)a
| Chr | pos (cM) | LODb | model | region | SNP | pos (bp) |
|---|---|---|---|---|---|---|
| 2 | 77 | 1.60 | rec | 2p16.1 | rs1961245 | 54947346 |
| 2 | 108 | 1.66 | rec | 2p11.2 | rs11395 | 86219368 |
| 2 | 131 | 1.85 | asm | 2q14.2 | rs280192 | 121453918 |
| 2 | 216 | 1.66 | asm | 2q35 | rs750365 | 218099958 |
| 4 | 77 | 2.02 | rec | 4q13.1 | rs1489572 | 63718358 |
| 4 | 93 | 2.26 | asm | 4q21.23 | rs1383972 | 86603603 |
| 4 | 98 | 2.62 | rec | 4q22.1 | rs729685 | 90654547 |
| 4 | 102 | 2.58 | rec | 4q22.2 | rs183993 | 95349298 |
| 4 | 114 | 2.58 | rec | 4q25 | rs1879053 | 111616647 |
| 8 | 59 | 1.63 | dom | 8p11.21 | rs868586 | 40824258 |
| 8 | 142 | 1.63 | asm | 8q24.22 | rs1062064 | 133081648 |
| 11 | 7 | 1.53 | dom | 11p15.4 | rs2231963 | 4581846 |
| 12 | 114 | 1.62 | asm | 12q23.2 | rs1544921 | 100635554 |
| 16 | 81 | 1.50 | rec | 16q21 | rs1027277 | 61242497 |
| 18 | 43 | 1.93 | rec | 18q11.2 | rs948384 | 18260958 |
All scores >1.5
HLOD scores listed for dom and rec models
Table 3.
LOD Scores on Chromosome 4
| group | LODa | pos (cM) | model | # families |
|---|---|---|---|---|
| ACTANE | 1.20 | 98 | asm | 179 |
| Univ Tampere | 1.36 | 83 | rec | 57 |
| CeRePP | 1.54 | 83 | rec | 174 |
| Univ Umea | 1.71 | 102 | rec | 35 |
| Univ Ulm | 0.94 | 102 | rec | 50 |
| Univ Utah | 1.00 | 93 | rec | 74 |
| MAYO Clinic | 0.36 | 83 | rec | 11 |
| FHCRC | 0.00 | 83–102 | rec | 13 |
| JHU | 0.33 | 83 | rec | 24 |
| Univ Michigan | 0.00 | 83–102 | rec | 131 |
| NW Univ | 0.09 | 102 | asm | 14 |
HLOD scores listed for rec model
One other region, 18q11, reached the threshold for suggestive evidence of linkage: rec HLOD=1.93 at 43cM. Including results from all three linkage models, LOD scores over 1.5 were observed at 8p11 (59 cM), 8q24 (142 cM), 11p15 (7 cM), 12q23 (114 cM), 16q21 (81 cM), and multiple positions on both arms of chromosome 2 (2p16, 77 cM; 2p11, 108 cM; 2q14, 131 cM; and 2q35, 216 cM) (Table 2).
Linkage Signals in Subsets of Families
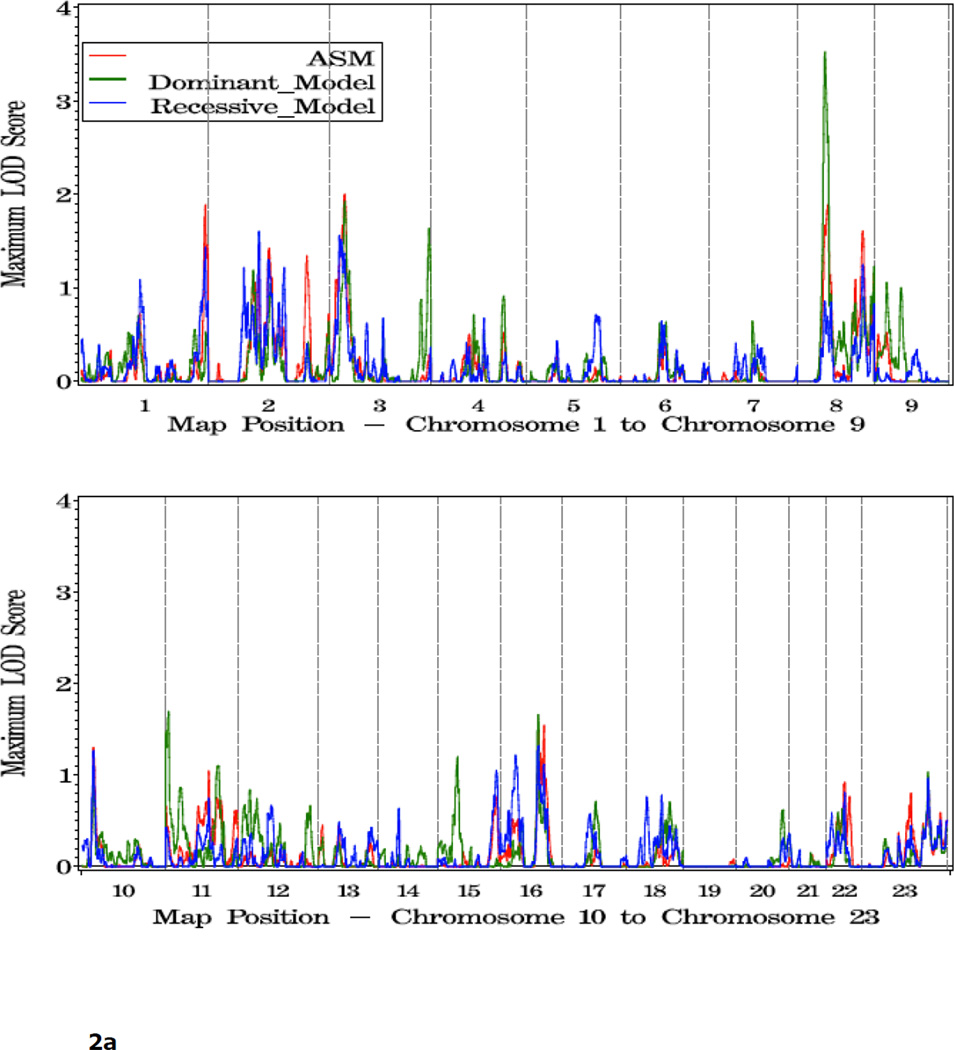
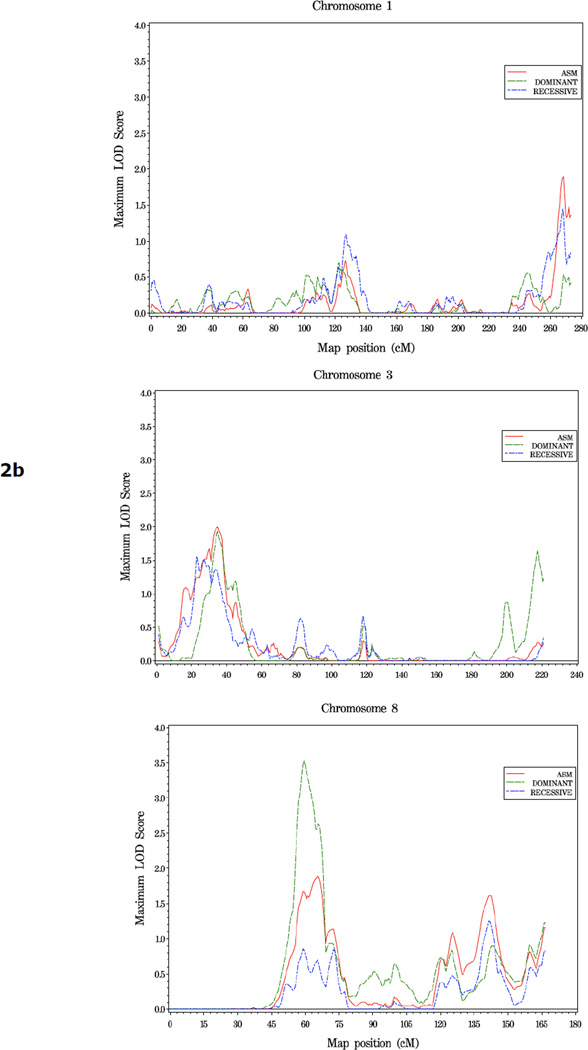
To explore variables that might impact the linkage results, we analyzed subsets of families characterized by young or old average age at diagnosis (≤65, vs 65 or older), five or more affected individuals, or multiple members affected with more aggressive disease. For the 405 families with young age of diagnosis, the most significant evidence for linkage was observed on 8p11 at 59 cM (dom HLOD=3.60 vs 1.63 at this same position in all families). Two other regions showing suggestive linkage in this family subset were observed, at 3p24 (asm LOD=2.05 at 35 cM), and 1q44 (asm LOD =1.95 at 269 cM) (Figure 2, Table 4).
Figure 2.
a. Plot of LOD Scores for families with average age at diagnosis under 65.
b. Chromosomes with LOD scores ≥ 1.86 in families with young age at diagnosis (<65).
Table 4.
LOD Score Summary - Subsets of Familes
| Chr | pos (cM) | LODa | model | region | SNP | pos (bp) |
|---|---|---|---|---|---|---|
| Families with early age atdiagnosis (<65, n=410) | ||||||
| 1 | 269 | 1.95 | asm | 1q44 | rs1148917 | 243595288 |
| 3 | 35 | 2.05 | asm | 3p24.3 | rs826423 | 15316855 |
| 8 | 59 | 3.60 | dom | 8p11.21 | rs868586 | 40824258 |
| Families with older age at diagnosis (≥65, n=353) | ||||||
| 4 | 95 | 4.50 | rec | 4q22.1 | rs729685 | 90654547 |
| 12 | 113 | 3.14 | dom | 12q23.2 | rs1544921 | 100635554 |
| 13 | 15 | 2.23 | rec | 13q12.13 | rs977655 | 25202569 |
| 18 | 43 | 1.91 | rec | 18q11.2 | rs948384 | 18260958 |
| Families with more aggressive disease (n=348) | ||||||
| 1 | 255 | 2.11 | dom | 1q43 | rs528011 | 236344348 |
| 2 | 218 | 2.24 | asm | 2q35 | rs746233 | 220209631 |
| 4 | 149 | 1.94 | dom | 4q32.1 | rs716428 | 156864474 |
| 8 | 126 | 3.17 | rec | 8q24.13 | rs2833 | 124055830 |
| 8 | 132 | 3.17 | dom | 8q24.21 | rs7814955 | 127491272 |
| 8 | 139 | 3.09 | asm | 8q24.21 | rs766811 | 130073850 |
| 12 | 146 | 2.23 | dom | 12q24.31 | rs2197777 | 124356099 |
| Families with five or more affected (n=47) | ||||||
| 13 | 128 | 2.46 | asm | 13q34 | rs1885688 | 112942237 |
| 15 | 40 | 2.00 | rec | 15q14 | rs276855 | 37318605 |
| 16 | 48 | 2.00 | rec | 16p12.1 | rs991911 | 24198554 |
HLOD scores listed for dom and rec models
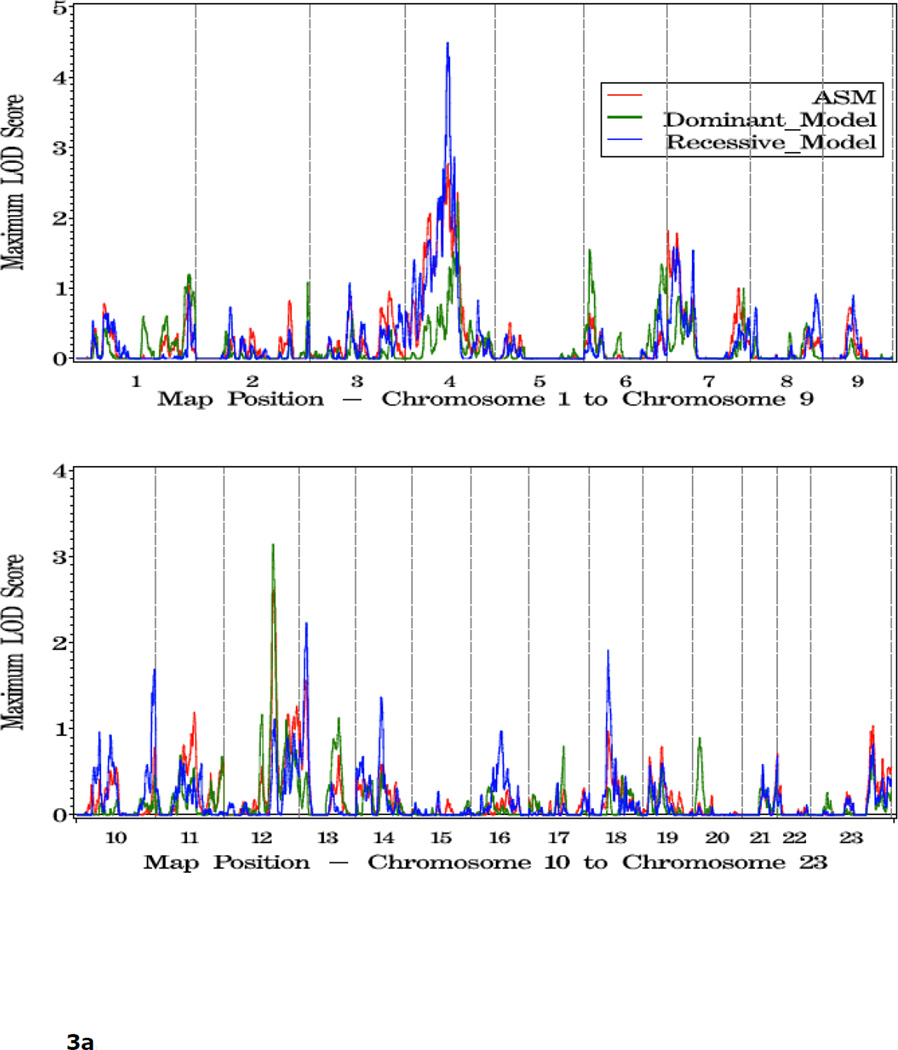
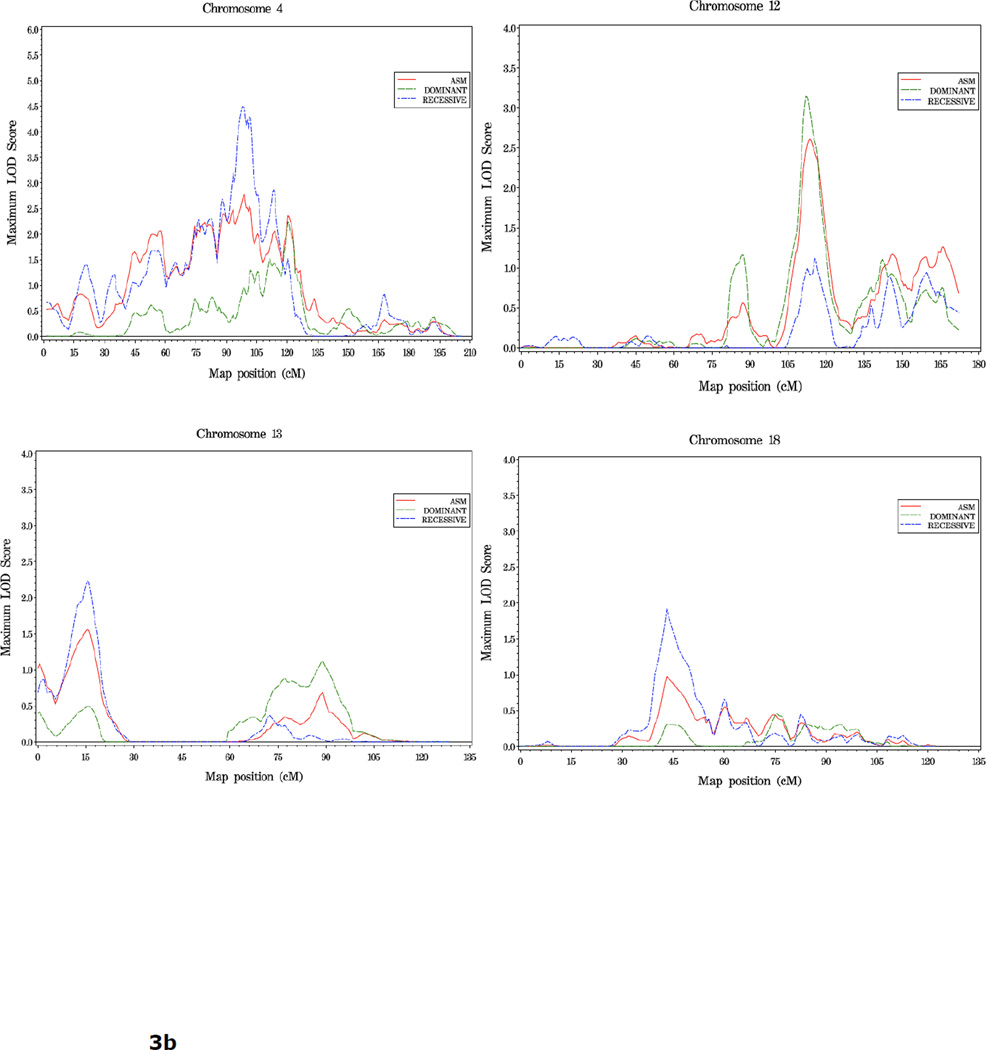
In families with an average age at diagnosis of 65 or greater (n=357), LOD scores over 1.86 are seen in a broad region spanning the centromere of chromosome 4 (51cM-122cM), which overlaps with the strongest region of linkage observed in the complete set of families. The peak for this subset analysis was at 95cM, 4q22, with a rec HLOD =4.50. Other positions with LOD scores over 1.86 in this subset of families were observed on chromosomes 12, 13 and 18 (dom HLOD = 3.14, rec HLOD = 2.23 and 1.91 at 113 cM, 15 cM and 43 cM, respectively) (Figure 3, Table 4).
Figure 3.
a. Plot of LOD Scores for families with average age at diagnosis ≥ 65.
b. Chromosomes with LOD scores ≥ 1.86 in families with average age at diagnosis ≥65.
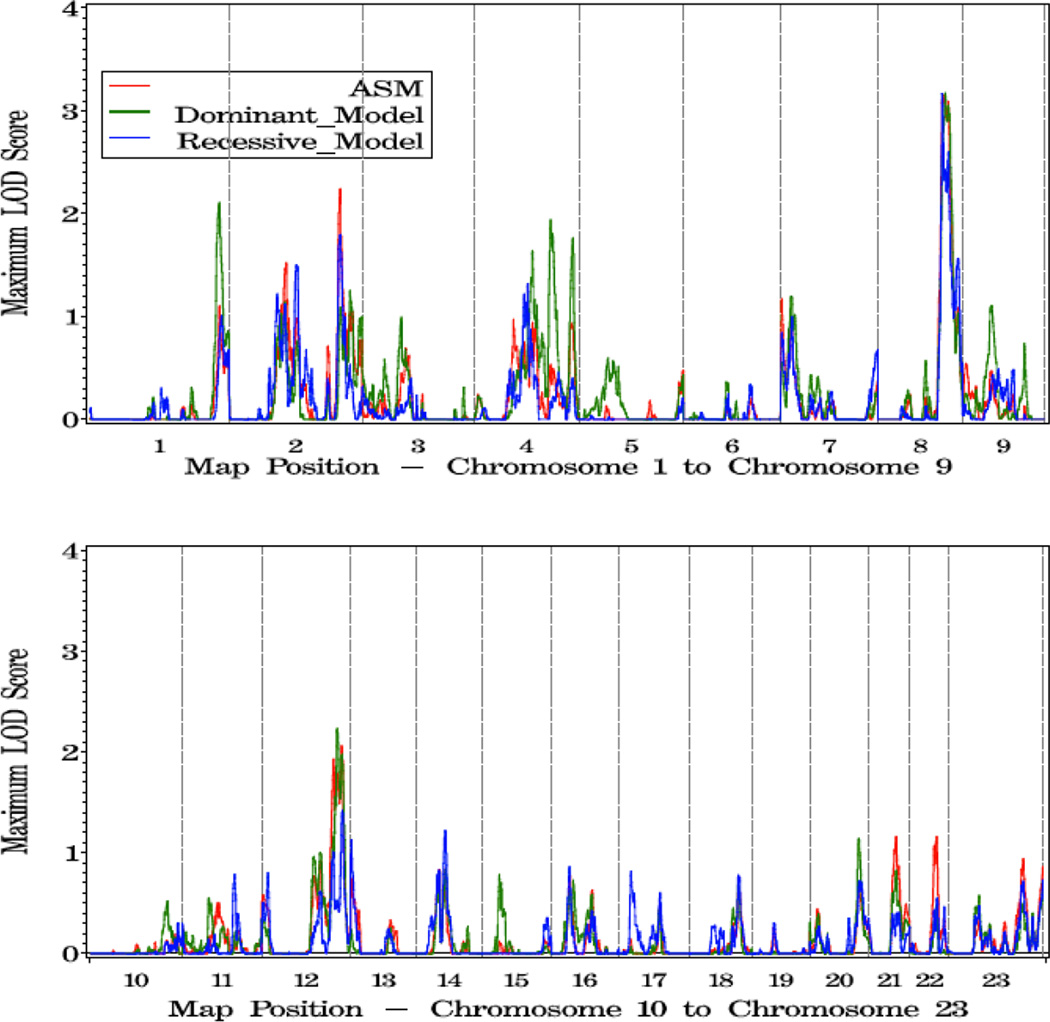
The strongest linkage signals in families with more aggressive disease were seen on chromosome 8 where LOD scores reached over 3.0 across a 14 cM interval at 8q24 (126–140 cM, high score 3.17 at 132 cM, dom model). Four other regions were of interest in this group: 1q43 (dom HLOD = 2.11 at 255 cM), 2q35 (asm LOD = 2.24 at 218 cM), and 4q32 (dom HLOD = 1.94 at 149 cM), 12q24 (dom HLOD = 2.23 at 146 cM) (Figure 4, Table 4).
Figure 4.
a. Plot of LOD Scores for families with more aggressive disease.
b. Chromosomes with LOD scores ≥1.86 in families with more aggressive disease.
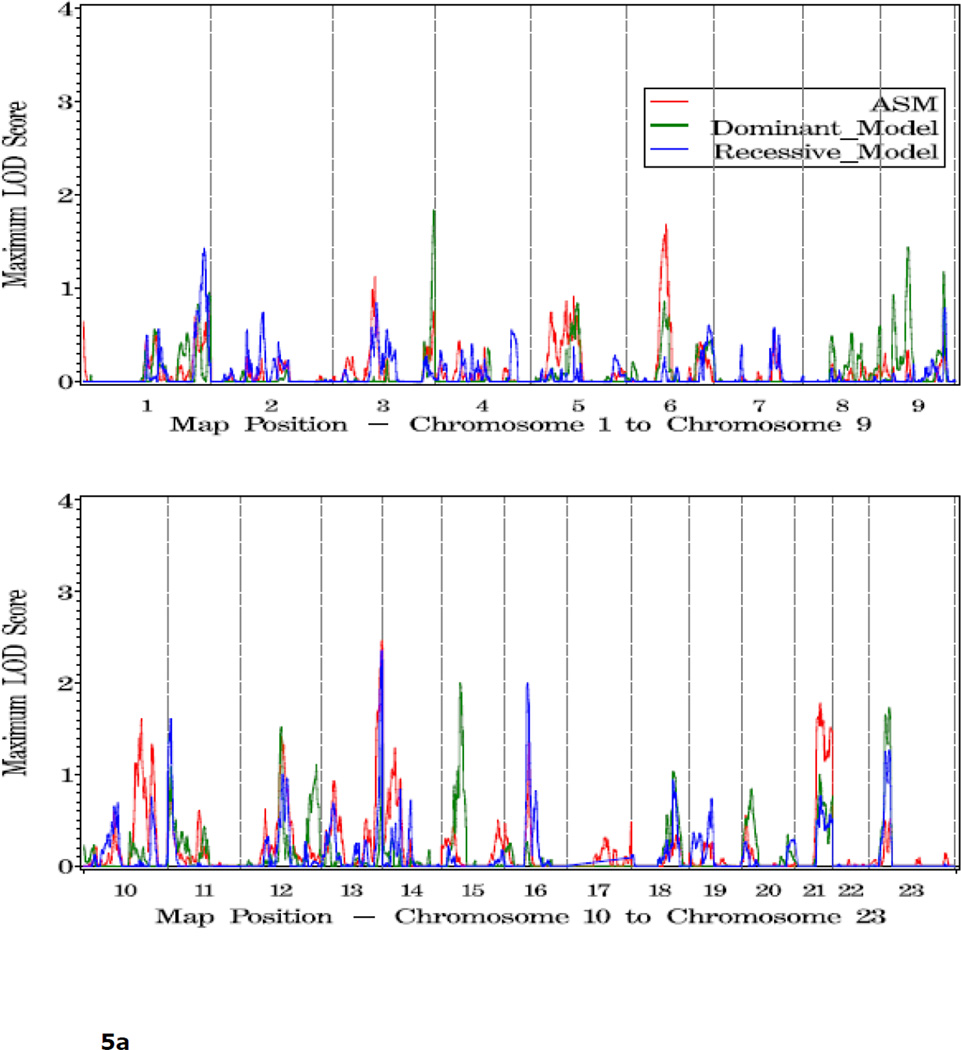
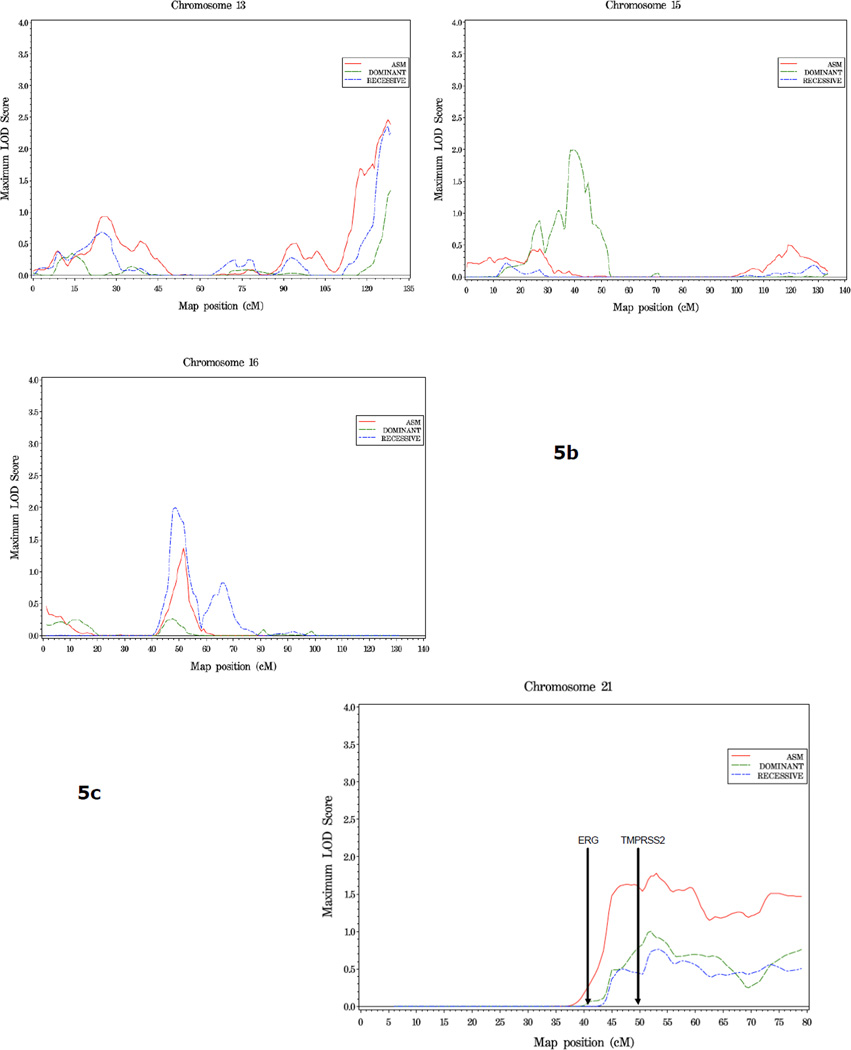
In families with 5 or more affected individuals, suggestive evidence of linkage was observed at three regions: 13q34 (asm LOD = 2.46, 128 cM), 15q14 (40 cM, dom HLOD = 2.0), and 16p12.1 (rec HLOD = 2.0, 48 cM) (Figure 5, Table 4). On chromosome 21, an HLOD of 1.78 was observed at 45cM, in the vicinity of the ERG and TMPRSS2 genes, in this family subset (Figure 5c).
Figure 5.
a. Plot of LOD Scores for families with 5 or more affected members.
b. Chromosomes with LOD scores ≥ 1.86 in families with 5 or more affected members.
c. Chromosome 21 in families with 5 or more affected members. The position of ERG and TMPRSS2, two genes known to undergo common genomic rearrangement leading to gene fusion and activation of ERG (41), is noted.
Comparison of Two Linkage Scans in ICPCG Families
To search for reproducible linkage signals, we compared the results of this SNP linkage scan (designated here SNP scan) with our previous scan of 1,233 families using microsatellite markers (MS scan) (7). Of the six regions of suggestive linkage found in the MS scan, none were supported by LOD scores reaching the threshold for suggestive linkage, i.e. ≥1.86, in the SNP scan. However, more modest evidence of replication was observed on the proximal short arm of chromosome 8. In the SNP scan, an HLOD of 1.63 was observed at 8p11 (59 cM) under a dominant model. In the MS scan, two signals were observed on 8p, one at 60 cM (1.94) and one at 46 cM (1.97), under recessive and dominant models respectively. For the remaining four regions of suggestive linkage found in our first scan, at 5q12, 15q11, 17q21 and 22q12, little or no evidence for linkage was seen in the SNP scan (LOD scores <0.4).
Similarly, for all regions reaching LOD scores of 1.5 or greater in the complete set of families analyzed in the SNP scan, including the multiple loci on chromosomes 2 and 4, 8p11, 11p15, 12q23, 16q21, and 18q11, the highest score observed in the MS scan was 0.53 at 133 cM on chromosome 2.
Comparison of Two Linkage Scans in Subsets of Families
In families with an young age at diagnosis, dom HLOD scores ≥ 1.86 were observed on 3p in both scans, although the peak locations differed by over 20cM (35 cM in SNP scan and 57 cM in MS scan). When comparing regions of linkage in the scans of families with five or more affected members, peaks over 1.86 were observed within 15cM of each other on 16p12 (at 34cM in MS scan and 49cM in SNP scan) (asm LOD 2.04 and 2.14 respectively).
Of the three regions reaching suggestive linkage (6p22, 11q14, and 20q11) in our previous MS scan of families with aggressive disease, one region, 11q14 provided some evidence of an overlapping signal in the SNP scan with a rec HLOD score of 0.8 at 100 cM. Also in this group of families, coinciding linkage signals occurred at 8q24, where dom HLOD scores of 1.17 and 3.05 were observed in the same positions (137 cM) in the MS and SNP scans, respectively.
Discussion
In this report, we describe a genome-wide linkage study of 762 families collected by members of the ICPCG. This is the second largest collection of PC families analyzed to date to assess linkage across the genome. A primary rationale behind this study was to determine whether linkage signals observed in an earlier microsatellite linkage scan of 1,233 families could be replicated, as a means to identify loci warranting further study.
Of the six regions of suggestive linkage observed in the previous MS scan of 1,233 PC families (7), one region, 8p11, attained a LOD score over 1.5 in the present SNP scan. In addition, overlapping linkage signals in the two scans provided some evidence of replication in defined subsets of families analyzed. Both families with young age at diagnosis and families with five or more affected individuals had moderate linkage signals at 3p24 and 16p12, respectively, in both scans. In addition, the subset of families with clinically aggressive disease showed linkage to 8q24 in both scans. Thus, while overall replication of previous linkage peaks was quite limited, several loci, particularly on chromosome 8, showed consistent linkage signals in two large, jndependent collections of prostate cancer families.
Chromosome 8 has long been suggested to harbor both prostate tumor suppressor gene(s) and oncogene(s) due to the frequent copy number alterations (deletions of 8p and gains of 8q, respectively) occurring somatically in specimens of prostate tumor tissue (8–10, reviewed in 11, 12). At the germline level, linkage at 8p has been observed in PC family collections from Japan, Sweden, Germany and the US (13–17), although in the majority of these studies the signals observed were more telomeric than the one observed here. In addition, a large case-control study conducted by PRACTICAL found two SNPs at 8p21, near NKX3.1, to be associated with PC risk (18).
The 8q24 locus been extensively analyzed by GWAS, with five or more regions reproducibly shown to be associated with PC risk (19–21). Historically, the region was first identified through a fine-mapping study of a linkage peak observed in a genome-wide scan of Icelandic PC families (22). Linkage to this region was also reported by Camp et al (23) in extended PC families from Utah. It will be of interest to determine whether any of the susceptibility loci identified in the original study and the association studies since, contribute to the linkage signals observed here. A gene of particular interest for PC, MYC, lies in the region of linkage observed in this study in families with more aggressive disease. Previous studies have demonstrated the common up-regulation of this gene early in human prostate carcinogenesis (24, 25), amplification of the gene in advanced PC (26, 27), and the ability of prostate specific expression of this gene to induce PC in animal models (28, 29). Such studies, together with recent work demonstrating interactions between risk loci and MYC regulatory elements have led to the hypothesis that the 8q24 risk alleles that have been identified to date modify PCa risk mechanistically by altering MYC regulation and expression (30–34).
In the complete family collection, the strongest linkage signals in this study were observed on the proximal and mid q arm of chromosome 4. One important aspect of this signal is the contributions provided by the multiple different family collections. Interestingly, six of the seven largest family collections (ranging from 35 to 174 families) had LOD scores over 0.9 in the 12 cM interval between 93 cM and 105 cM on this chromosome, whereas the four smaller collections (n < 25 families) contributed little evidence to this signal. Curiously, the six positive family collections include all five groups originating from Europe/Australia, suggesting a possible geographical association to the chromosome 4 linkage, although limited sample size of the US family sets, or chance occurrence are also possible explanations for this observation. It is of interest that recent GWAS findings have led to the identification and confirmation of several SNPs on 4q22 and 4q24, in introns of PDLIM5, and upstream of TET2, respectively, as being associated with PC risk (18). Whether or not common risk alleles at these or nearby loci play a role in the linkage signal observed in the larger family collections studied here is a question for further investigation.
Stanford et al (35) recently reported a SNP based linkage scan in which several linkage signals were reported that coincide with results from this study. Specifically, coincident peaks were observed at 15q13-14 and 2q14-21 in this study and the one reported here, although the signals were observed in different subsets of PC families. Evidence of linkage to the long arm of chromosome 8 (8q22) was observed in the complete set of 289 Caucasian families.
One of the aims of this study was to replicate findings from our earlier MS scan (7); however few loci were observed in both studies. While this is disappointing, it is not surprising given the known genetic heterogeneity of PC. Indeed, a limitation of our study is the potentially heterogeneous genetic and environmental influences arising from a collection of families from multiple locations across the U.S., Europe, and Australia. Over half of the families (65%) studied in this scan were collected in Europe or Australia, while the majority of families (79%) studied in our previous MS scan were collected in the U.S. Differences in intensity of PC screening in Europe versus the U.S. may lead to substantial differences in the distribution of disease stage at diagnosis (e.g., lower stage due to widespread PSA testing in the U.S.). While we have attempted to address some of these differences by examining specific subsets of PC families stratified by age at diagnosis and clinical and pathologic variables of the disease, this may not be sufficient to account for the heterogeneity that may be introduced by the differences in clinical practices between the continents.
It should be noted that with respect to comparability with our previous MS scan, while in general the family characteristics were quite similar, the families in this scan had on average fewer members affected with PC (~2.3 per family compared to~3.5 in the MS scan). This fact could have implications with respect to the linkage evidence on 8q24. Smaller numbers of affected individuals within families could reflect a greater presence of sporadic disease. While little is known about the role of 8q24 susceptibility variants in familial PC, there is unequivocal evidence that these risk alleles are associated with sporadic PC even though the relative risks associated with these risk alleles are small to modest. It is interesting to note that the Icelandic families in which the 8q24 locus was originally identified through linkage analysis were of similar average size to the families in this study (22).
The strengths of this study are its large size and increased genetic information and resolution due to the use of dense SNP panels for genotyping. While the wide area of family ascertainment may generate heterogeneity, the large number of families afforded by this approach increases power and possibly results in the identification of more robust genetic signals. Finally, the large number of families increases our ability to examine potentially more homogeneous subsets of families while still maintaining reasonable levels of power.
In summary, in an examination of results from a high resolution SNP scan of 762 families and a previous MS scan of 1233 independent PC families, no locus emerges as an unequivocally strong candidate. However, our results suggest that a broad region on proximal 4q, and multiple regions on chromosome 8 are possible candidate regions harboring PC susceptibility loci. In light of evidence from this and previous studies, further analysis of these regions appears warranted.
Methods
Ascertainment of Families
The ICPCG study populations have been previously described in detail (36). Each group within the ICPCG recruited PC families and eleven ICPCG groups contributed to this combined genome-wide screen: ACTANE (Anglo/Canadian/Texan/Australian/Norwegian/European Union Biomed), Centre de Recherche sur les Pathologies Prostatiques, (CeRePP) in France, Johns Hopkins University (JHU), Mayo Clinic, University of Michigan, Northwestern University, PROGRESS (Prostate Cancer Genetic Research Study, Fred Hutchinson Cancer Research Center), University of Tampere in Finland, University of Ulm in Germany, Karolinska Insititute in Sweden, and University of Utah. There were 762 PC pedigrees in this combined analysis. The research protocols and informed consent procedures were approved by each group’s institutional review board.
Definition of Affection Status and Classification of Pedigrees
Affected individuals were defined as men diagnosed with PC that had been confirmed by either medical records or death certificates. Self- or relative-reported affected men without either medical records or death certificate confirmation were considered as having unknown affection status. All men without a diagnosis of PC were coded as having unknown affection status, regardless of whether they had undergone screening for PC. Hence, all analyses were based on the sharing of marker genotypes among affected individuals, with no consideration of the phenotype for the remaining subjects. Family members not considered affected nonetheless contributed genotype information, when available, to increase the linkage information content among the affected men. Although such an approach may result in some loss of power, it provided a uniform approach across all participating groups, particularly important because screening of unaffected men varied across groups.
For subset analyses, pedigrees were stratified according to the following criteria: 1) average age at diagnosis within families, contrasting <65 years to 65+ years; 2) families with aggressive disease based on criteria previously described (37). Briefly, families meeting these criteria had three or more affected individuals with PC with at least one of the following clinicopathologic characteristics: Gleason score 7 or higher, TNM stage of T3 or T4, pretreatment serum PSA ≥20 ng/mL, or death from PC before age 65. In these families, other cases not meeting any of the criteria for aggressive disease were classified as having unknown disease status; 3) families having 5 or more affected individuals..
Genotyping
Genome-wide SNP linkage scan genotyping was performed at the Center for Inherited Disease Research using Illumina's HumanLinkage-12 Genotyping BeadChip (http://www.cidr.jhmi.edu/human_snp.html). These chips assay 6,090 SNP markers, with an average intermarker distance of 0.58 cM across the genome and an average marker heterozygosity of 0.43 in Caucasians.
Statistical Analysis: Linkage-Analysis Methods
The computer programs Pedcheck (http://watson.hgen.pitt.edu/register/docs/pedcheck.html) and PREST (http://galton.uchicago.edu/~mcpeek/software/prest/) were used for checking whether the genotypes of individuals within a pedigree are consistent with their specified relationships. Based on these analyses, 58 individuals were removed from further analysis.
Both parametric and non-parametric linkage analyses were performed using Merlin software (38). The parametric LOD scores were computed using either a dominant or a recessive model, as described in elsewhere (5). LOD scores allowing for linkage heterogeneity among families (HLOD) were estimated using HOMOG (39). Non-parametric LOD scores were calculated using the Kong and Cox exponential allele sharing model score (herein referred to as asm) (40). Marker allele frequencies for each SNP were estimated by counting alleles across all genotyped subjects, ignoring genetic relationships. Multipoint linkage statistics were calculated at 0.5 cM intervals across the genome.
We used the r-square option (≥ 0.1) of Merlin to remove SNPs that were in linkage disequilibrium (LD). This is necessary to reduce the positive bias of strong marker LD among flanking SNPs on linkage results, and to reduce the memory and time requirements for large pedigrees. To further fit pedigree data into the memory limits of Merlin software, trimming of family members was conducted. Un-genotyped subjects or subjects with missing phenotypes were trimmed. Trimming was performed on each pedigree to obtain a maximum bit size of 24.
To facilitate comparison of the results of this SNP scan with our previous scan using microsatellite (MS) markers, we aligned the results of these two linkage scans based on physical map positions (Build 35) of both the microsatellite markers and SNP markers.
Acknowledgements
We would like to express our gratitude to the many families who participated in the studies involved in the International Consortium for Prostate Cancer Genetics (ICPCG). The ICPCG, including the consortium’s Data Coordinating Center (DCC), is made possible by a grant from the National Institutes of Health U01 CA89600 (to W.B.I.). Additional support to participating groups, or members within groups, is as follows: ACTANE Group: This study, and recruitment of U.K. families, was supported by Cancer Research U.K (CR-UK) grant no C5047/A3354. Additional support was provided by The Prostate Cancer Research Foundation, The Times Christmas Appeal and the Institute of Cancer Research. We thank S. Seal and A. Hall for kindly storing and logging the samples that were provided. D.F.E is a Principal Research Fellow of CR-UK. Funding in Australia was obtained from The Cancer Council Victoria, The National Health and Medical Research Council (grants 940934, 251533, 209057, 126402, 396407), Tattersall’s and The Whitten Foundation. We would like to acknowledge the work of the study coordinator M. Staples and the Research Team B. McCudden, J. Connal, R. Thorowgood, C. Costa, M. Kevan, and S. Palmer, and to J. Karpowicz for DNA extractions. The Texas study of familial prostate cancer was initiated by the Department of Epidemiology, M.D. Anderson Cancer Center. M.B. was supported by an NCI Post-doctoral Fellowship in Cancer Prevention (R25). BC/CA/HI Group: USPHS CA67044. CeRePP: Association pour la Recherche sur le Cancer, grant number 5441. FHCRC Group: USPHS CA80122 (to J.L.S.)and USPHS CA78836 (to E.A.O), with additional support from the Fred Hutchinson Cancer Research Center. E.A.O and B.J. acknowledge the Intramural Program of the National Human Genome Research Institute. JHU Group:.USPHS CA58236 (to W.B.I.) Mayo Clinic Group: USPHS CA72818. Michigan Group: USPHS CA079596. Northwestern Group: The Urological Research Foundation. University of Tampere Group: The Competitive Research Funding of the Pirkanmaa Hospital District, Reino Lahtikari Foundation, Finnish Cancer Organisations, Sigrid Juselius Foundation, and Academy of Finland grant 211123. University of Ulm Group: Deutsche Krebshilfe, grant number 70-3111-V03. Karolinska Institute Group Swedish Cancer Society and a Spear grant from the Umeå University Hospital, Umeå, Sweden. University of Utah Group: Data collection was supported by USPHS CA90752 (to L.A.C.-A.) and by the Utah Cancer Registry, which is funded by Contract #N01-PC-35141 from the National Cancer Institute's Surveillance, Epidemiology, and End Results Program with additional support from the Utah State Department of Heath and the University of Utah. G.B.C. was supported by National Library of Medicine training grant NLM T15 LM07124. N.J.C. was supported in part by USPHS CA98364 (to N.J.C.). L.C.A. acknowledges support from the Huntsman Cancer Foundation. DCC: The study is partially supported by USPHS CA106523 (to J.X.), USPHS CA95052 (to J.X.), and Department of Defense grant PC051264 (to J.X.).
Other investigators who contributed to this work: ACTANE Group: UK, Sutton: S. Bullock, Q. Hope, S. Bryant, S. Mulholland, S. Jugurnauth, N. Garcia, L. O'Brien, B. Gehr-Swain, A. Hall, R. Wilkinson, A. Ardern-Jones, D. Dearnaley, The UKGPCS Collaborators, British Association of Urological Surgeons' Section of Oncology. UK, Cambridge: Chris Evans, M. Dawn Teare, (Cancer Research UK Genetic Epidemiology Unit, Strangeways Research Labs, Cambridge). Australia: Melissa Southey (The Cancer Council of Victoria and The University of Melbourne, Carlton, Australia). Canada: Nancy Hamel, Steven Narod, Jaques Simard. (Department of Medical Genetics, McGill University, Montreal, Quebec; Oncology and Molecular Endocrinology Research Center, CHUL Research Center; Laval University, Quebec City, and Women's College Hospital Research Institute, University of Toronto). Texas: Chris Amos (MD Anderson Cancer Centre, Houston, TX and Division of Medical Genetics, University of Washington Medical Centre, Seattle, WA). Norway, Oslo: Ketil Heimdal, Lovise Mahle, Pal Moller+ (Unit of Medical Genetics, Norwegian Radium Hospital, Oslo). Norway, Ullevaal: Nicolai Wessel, Tone Andersen (Dept of Oncology, Ullevaal University Hospital, Oslo). EU Biomed: Tim Bishop, The EU Biomed Prostate Cancer Linkage Consortium (Cancer Research UKGenetic Epidemiology Laboratory, St James’ University Hospital, Leeds, UK).
References
- 1.Easton DF, Eeles RA. Genome-wide association studies in cancer. Hum Mol Genet. 2008;17(R2):R109–R115. doi: 10.1093/hmg/ddn287. [DOI] [PubMed] [Google Scholar]
- 2.Bruner DW, Moore D, Parlanti A, Dorgan J, Engstrom P. Relative risk of prostate cancer for men with affected relatives: systematic review and meta-analysis. Int J Cancer. 2003;107(5):797–803. doi: 10.1002/ijc.11466. [DOI] [PubMed] [Google Scholar]
- 3.Johns LE, Houlston RS. A systematic review and meta-analysis of familial prostate cancer risk. BJU Int. 2003 Jun;91(9):789–794. doi: 10.1046/j.1464-410x.2003.04232.x. 2003. [DOI] [PubMed] [Google Scholar]
- 4.Easton DF, Schaid DJ, Whittemore AS, Isaacs WB. International Consortium for Prostate Cancer Genetics. Where are the prostate cancer genes?--A summary of eight genome wide searches. Prostate. 2003;D57(4):261–269. doi: 10.1002/pros.10300. [DOI] [PubMed] [Google Scholar]
- 5.Schaid DJ. The complex genetic epidemiology of prostate cancer. Hum Mol Genet. 2004;13:R103–R121. doi: 10.1093/hmg/ddh072. [DOI] [PubMed] [Google Scholar]
- 6.Langeberg WJ, Isaacs WB, Stanford JL. Genetic etiology of hereditary prostate cancer. Front Biosci. 2007;12:4101–4110. doi: 10.2741/2374. [DOI] [PubMed] [Google Scholar]
- 7.Xu J, Dimitrov L, Chang BL, Adams TS, Turner AR, Meyers DA, Eeles RA, Easton DF, Foulkes WD, Simar J, et al. A combined genomewide linkage scan of 1,233 families for prostate cancer-susceptibility genes conducted by the international consortium for prostate cancer genetics. Am J Hum Genet. 2005;77(2):219–229. doi: 10.1086/432377. [DOI] [PMC free article] [PubMed] [Google Scholar]
- 8.Bergerheim US, Kunimi K, Collins VP, Ekman P. Deletion mapping of chromosomes 8, 10, and 16 in human prostatic carcinoma. Genes Chromosomes Cancer. 1991;3(3):215–220. doi: 10.1002/gcc.2870030308. [DOI] [PubMed] [Google Scholar]
- 9.Bova GS, Carter BS, Bussemakers MJ, Emi M, Fujiwara Y, Kyprianou N, Jacobs SC, Robinson JC, Epstein JI, Walsh PC, et al. Homozygous deletion and frequent allelic loss of chromosome 8p22 loci in human prostate cancer. Cancer Res. 1993;53(17):3869–3873. [PubMed] [Google Scholar]
- 10.El Gammal AT, Brüchmann M, Zustin J, Isbarn H, Hellwinkel OJ, Köllermann J, Sauter G, Simon R, Wilczak W, Schwarz J, et al. Chromosome 8p deletions and 8q gains are associated with tumor progression and poor prognosis in prostate cancer. Clin Cancer Res. 2010;16(1):56–64. doi: 10.1158/1078-0432.CCR-09-1423. [DOI] [PubMed] [Google Scholar]
- 11.Tsuchiya N, Slezak JM, Lieber MM, Bergstralh EJ, Jenkins RB. Clinical significance of alterations of chromosome 8 detected by fluorescence in situ hybridization analysis in pathologic organ-confined prostate cancer. Genes Chromosomes Cancer. 2002;34(4):363–371. doi: 10.1002/gcc.10064. [DOI] [PubMed] [Google Scholar]
- 12.Sun J, Liu W, Adams TS, Sun J, Li X, Turner AR, Chang B, Kim JW, Zheng SL, Isaacs WB, Xu J. DNA copy number alterations in prostate cancers: a combined analysis of published CGH studies. Prostate. 2007;67(7):692–700. doi: 10.1002/pros.20543. [DOI] [PubMed] [Google Scholar]
- 13.Xu J, Zheng SL, Hawkins GA, Faith DA, Kelly B, Isaacs SD, Wiley KE, Chang B, Ewing CM, Bujnovszky P, et al. Linkage and association studies of prostate cancer susceptibility: evidence for linkage at 8p22-23. Am J Hum Genet. 2001;69(2):341–350. doi: 10.1086/321967. [DOI] [PMC free article] [PubMed] [Google Scholar]
- 14.Wiklund F, Jonsson BA, Göransson I, Bergh A, Grönberg H. Linkage analysis of prostate cancer susceptibility: confirmation of linkage at 8p22-23. Hum Genet. 2003;112(4):414–418. doi: 10.1007/s00439-003-0916-6. [DOI] [PubMed] [Google Scholar]
- 15.Matsui H, Suzuki K, Ohtake N, Nakata S, Takeuchi T, Yamanaka H, Inoue I. Genomewide linkage analysis of familial prostate cancer in the Japanese population. J Hum Genet. 2004;49(1):9–15. doi: 10.1007/s10038-003-0099-y. [DOI] [PubMed] [Google Scholar]
- 16.Schaid DJ, Guenther JC, Christensen GB, Hebbring S, Rosenow C, Hilker CA, McDonnell SK, Cunningham JM, Slager SL, Blute ML, et al. Comparison of microsatellites versus single-nucleotide polymorphisms in a genome linkage screen for prostate cancer susceptibility Loci. Am. J. Hum. Genet. 2004;75:948–965. doi: 10.1086/425870. [DOI] [PMC free article] [PubMed] [Google Scholar]
- 17.Maier C, Herkommer K, Hoegel J, Vogel W, Paiss T. A genomewide linkage analysis for prostate cancer susceptibility genes in families from Germany. Eur J Hum Genet. 2005;13(3):352–360. doi: 10.1038/sj.ejhg.5201333. [DOI] [PubMed] [Google Scholar]
- 18.Eeles RA, Kote-Jarai Z, Al Olama AA, Giles GG, Guy M, Severi G, Muir K, Hopper JL, Henderson BE, Haiman CA, et al. Identification of seven new prostate cancer susceptibility loci through a genome-wide association study. Nat Genet. 2009;41(10):1116–1121. doi: 10.1038/ng.450. [DOI] [PMC free article] [PubMed] [Google Scholar]
- 19.Al Olama AA, Kote-Jarai Z, Giles GG, Guy M, Morrison J, Severi G, Leongamornlert DA, Tymrakiewicz M, Jhavar S, Saunders E, et al. Multiple loci on 8q24 associated with prostate cancer susceptibility. Nat Genet. 2009;41(10):1058–1060. doi: 10.1038/ng.452. [DOI] [PubMed] [Google Scholar]
- 20.Yeager M, Chatterjee N, Ciampa J, Jacobs KB, Gonzalez-Bosquet J, Hayes RB, Kraft P, Wacholder S, Orr N, Berndt S, et al. Identification of a new prostate cancer susceptibility locus on chromosome 8q24. Nat Genet. 2009;41(10):1055–1057. doi: 10.1038/ng.444. [DOI] [PMC free article] [PubMed] [Google Scholar]
- 21.Gudmundsson J, Sulem P, Gudbjartsson DF, Blondal T, Gylfason A, Agnarsson BA, Benediktsdottir KR, Magnusdottir DN, Orlygsdottir G, Jakobsdottir M, et al. Genome-wide association and replication studies identify four variants associated with prostate cancer susceptibility. Nat Genet. 2009;41(10):1122–1126. doi: 10.1038/ng.448. [DOI] [PMC free article] [PubMed] [Google Scholar]
- 22.Amundadottir LT, Sulem P, Gudmundsson J, Helgason A, Baker A, Agnarsson BA, Sigurdsson A, Benediktsdottir KR, Cazier JB, Sainz J, et al. A common variant associated with prostate cancer in European and African populations. Nat. Genet. 2006;38:652–658. doi: 10.1038/ng1808. [DOI] [PubMed] [Google Scholar]
- 23.Camp NJ, Farnham JM, Allen-Brady K, Cannon-Albright LA. Statistical recombinant mapping in extended high-risk Utah pedigrees narrows the 8q24 prostate cancer locus to 2.0 Mb. Prostate. 2007;67(13):1456–1464. doi: 10.1002/pros.20631. [DOI] [PubMed] [Google Scholar]
- 24.Fleming WH, Hamel A, MacDonald R, Ramsey E, Pettigrew NM, Johnston B, Dodd JG, Matusik RJ. Expression of the c-myc protooncogene in human prostatic carcinoma and benign prostatic hyperplasia. Cancer Res. 1986;46:1535–1538. [PubMed] [Google Scholar]
- 25.Gurel B, Iwata T, Koh CM, Jenkins RB, Lan F, Van Dang C, Hicks JL, Morgan J, Cornish TC, Sutcliffe S, et al. Nuclear MYC protein overexpression is an early alteration in human prostate carcinogenesis. Mod Pathol. 2008;21(9):1156–1167. doi: 10.1038/modpathol.2008.111. [DOI] [PMC free article] [PubMed] [Google Scholar]
- 26.Jenkins RB, Qian J, Lieber MM, Bostwick DG. Detection of c-myc oncogene amplification and chromosomal anomalies in metastatic prostatic carcinoma by fluorescence in situ hybridization. Cancer Res. 1997;57:524–530. [PubMed] [Google Scholar]
- 27.Sato K, Qian J, Slezak JM, Lieber MM, Bostwick DG, Bergstralh EJ, Jenkins RB. Clinical significance of alterations of chromosome 8 in high-grade, advanced, nonmetastatic prostate carcinoma. J Natl Cancer Inst. 1999;91:1574–1580. doi: 10.1093/jnci/91.18.1574. [DOI] [PubMed] [Google Scholar]
- 28.Ellwood-Yen K, Graeber TG, Wongvipat J, Iruela-Arispe ML, Zhang J, Matusik R, Thomas GV, Sawyers CL. Myc-driven murine prostate cancer shares molecular features with human prostate tumors. Cancer Cell. 2003;4(3):223–238. doi: 10.1016/s1535-6108(03)00197-1. Erratum in: Cancer Cell. 2005 Dec;8(6):485. [DOI] [PubMed] [Google Scholar]
- 29.Williams K, Fernandez S, Stien X, Ishii K, Love HD, Lau YF, Roberts RL, Hayward SW. Unopposed c-MYC expression in benign prostatic epithelium causes a cancer phenotype. Prostate. 2005 Jun 1;63(4):369–384. doi: 10.1002/pros.20200. 2005. [DOI] [PubMed] [Google Scholar]
- 30.Tuupanen S, Turunen M, Lehtonen R, Hallikas O, Vanharanta S, Kivioja T, Björklund M, Wei G, Yan J, Niittymäki I, et al. The common colorectal cancer predisposition SNP rs6983267 at chromosome 8q24 confers potential to enhanced Wnt signaling. LA. Nat Genet. 2009;41(8):885–890. doi: 10.1038/ng.406. [DOI] [PubMed] [Google Scholar]
- 31.Pomerantz MM, Ahmadiyeh N, Jia L, Herman P, Verzi MP, Doddapaneni H, Beckwith CA, Chan JA, Hills A, Davis M, et al. The 8q24 cancer risk variant rs6983267 shows long-range interaction with MYC in colorectal cancer. Nat Genet. 2009;41(8):882–884. doi: 10.1038/ng.403. [DOI] [PMC free article] [PubMed] [Google Scholar]
- 32.Jia L, Landan G, Pomerantz M, Jaschek R, Herman P, Reich D, Yan C, Khalid O, Kantoff P, Oh W, et al. Functional enhancers at the gene-poor 8q24 cancer-linked locus. PLoS Genet. 2009;5(8):e1000597. doi: 10.1371/journal.pgen.1000597. [DOI] [PMC free article] [PubMed] [Google Scholar]
- 33.Ahmadiyeh N, Pomerantz MM, Grisanzio C, Herman P, Jia L, Almendro V, He HH, Brown M, Liu XS, Davis M, et al. 8q24 prostate, breast, and colon cancer risk loci show tissue-specific long-range interaction with MYC. Proc Natl Acad Sci U S A. 2010;107(21):9742–9746. doi: 10.1073/pnas.0910668107. [DOI] [PMC free article] [PubMed] [Google Scholar]
- 34.Sotelo J, Esposito D, Duhagon MA, Banfield K, Mehalko J, Liao H, Stephens RM, Harris TJ, Munroe DJ, Wu X. Long-range enhancers on 8q24 regulate c-Myc. Proc Natl Acad Sci U S A. 2010;107(7):3001–3005. doi: 10.1073/pnas.0906067107. [DOI] [PMC free article] [PubMed] [Google Scholar]
- 35.Stanford JL, FitzGerald LM, McDonnell SK, Carlson EE, McIntosh LM, Deutsch K, Hood L, Ostrander EA, Schaid DJ. Dense genome-wide SNP linkage scan in 301 hereditary prostate cancer families identifies multiple regions with suggestive evidence for linkage. Hum Mol Genet. 2009;18(10):1839–1848. doi: 10.1093/hmg/ddp100. [DOI] [PMC free article] [PubMed] [Google Scholar]
- 36.Schaid DJ, Chang BL International Consortium For Prostate Cancer Genetics. Description of the International Consortium For Prostate Cancer Genetics, and failure to replicate linkage of hereditary prostate cancer to 20q13. Prostate. 2005;63(3):276–290. doi: 10.1002/pros.20198. [DOI] [PubMed] [Google Scholar]
- 37.Schaid DJ, McDonnell SK, Zarfas KE, Cunningham JM, Hebbring S, Thibodeau SN, Eeles RA, Easton DF, Foulkes WD, Simard J, et al. Pooled genome linkage scan of aggressive prostate cancer: results from the International Consortium for Prostate Cancer Genetics. Hum Genet. 2006;120(4):471–485. doi: 10.1007/s00439-006-0219-9. [DOI] [PubMed] [Google Scholar]
- 38.Abecasis GR, Cherny SS, Cookson WO, Cardon LR. Merlin--rapid analysis of dense genetic maps using sparse gene flow trees. Nat Genet. 2002;30(1):97–101. doi: 10.1038/ng786. [DOI] [PubMed] [Google Scholar]
- 39.Bhat A, Heath SC, Ott J. Heterogeneity for multiple disease loci in linkage analysis. Hum Hered. 1999;49(4):229–231. doi: 10.1159/000022879. [DOI] [PubMed] [Google Scholar]
- 40.Kong A, Cox NJ. Allele-sharing models: LOD scores and accurate linkage tests. Am J Hum Genet. 1997;61(5):1179–1188. doi: 10.1086/301592. [DOI] [PMC free article] [PubMed] [Google Scholar]
- 41.Kumar-Sinha C, Tomlins SA, Chinnaiyan AM. Recurrent gene fusions in prostate cancer. Nat Rev Cancer. 2008;8(7):497–511. doi: 10.1038/nrc2402. [DOI] [PMC free article] [PubMed] [Google Scholar]


