

Abstract
OBJECTIVES
Mechanical ventilation tidal volumes are usually set according to an estimate of patient size in millilitres (ml) per kilogram (kg) body weight. We describe the relationship between donor–recipient lung-size mismatch and postoperative mechanical ventilation tidal volumes according to recipient- and donor-predicted body weights in a cohort of bilateral lung transplant patients.
METHODS
A most-undersized (10 patients with lowest predicted total lung capacity [pTLC] ratio = pTLC-donor/pTLC-recipient), a most-oversized (10 patients with highest pTLC ratio) and best-matched subset (10 patients with predicted total lung capacity ratio closest to 1.0) were selected within a cohort of 70 patients. All tidal volumes during mechanical ventilation in the first 96 h after bilateral lung transplantation were recorded. Tidal volumes were expressed in ml and ml/kg-recipient-predicted body weights and ml/kg-donor-predicted body weights.
RESULTS
Postoperative absolute tidal volumes (in ml) were comparable between subsets of patients with undersized, matched and oversized allografts (552 ± 103 vs 581 ± 107 vs 582 ± 104 ml), and tidal volumes in ml/kg-recipient-predicted body weights were also similar (8.8 ± 1.4 vs 9.3 ± 1.1 vs 9.8 ± 2.1). However, tidal volumes in ml/kg-donor-predicted body weights revealed significant differences between undersized, matched, and oversized subsets (11.4 ± 3.1 vs 9.4 ± 1.2 vs 8.1 ± 2.1, respectively; P < 0.05). Two patients developed primary graft dysfunction grade 3, both in the undersized subset. Four patients in the undersized group underwent tracheotomy (vs none in matched and one in oversized subset).
CONCLUSIONS
During mechanical ventilation after bilateral lung transplantation, undersized allografts received relatively higher tidal volumes compared with oversized allografts when the tidal volumes were related to donor-predicted body weights.
Keywords: Lung transplantation, Lung-size mismatch, Mechanical ventilation, Resource utilization
INTRODUCTION
Larger tidal volumes during mechanical ventilation may cause or amplify ventilator-induced lung injury [1, 2]. Tidal volumes are usually set according to an estimate of patient size in millilitres (ml) per kilogram (kg) body weight [1]. We describe the relationship between donor–recipient size mismatch and postoperative mechanical ventilation tidal volumes according to recipient- and donor-predicted body weights (predicted body weights, Supplementary Data E1A) after bilateral lung transplantation. We hypothesized that undersized allografts receive larger tidal volumes in ml/kg-donor-predicted body weights (Fig. 1).
Figure 1:

Conceptual graphic on the possible effect of lung-size mismatch on mechanical ventilation tidal volumes expressed as ml/kg-predicted body weights of the donor.
MATERIALS AND METHODS
The study population has been described previously [3]. We selected a most-undersized (10 patients with lowest predicted total lung capacity [pTLC] ratio = pTLC-donor/pTLC-recipient), a most-oversized (10 patients with highest pTLC ratio) and best-matched subset (10 patients with pTLC ratio closest to 1.0), Supplementary Data E1B. All tidal volumes during mechanical ventilation in the first 96 h after bilateral lung transplant patients were recorded (Supplementary Data E2). Tidal volumes were expressed in ml and ml/kg of recipient-predicted body weights and of ml/kg-donor-predicted body weights (Supplementary Data E1A) [1]. Mode of ventilation, fraction of inspired oxygen (FiO2), peak inspiratory pressure, positive end-expiratory pressure and plateau pressure were recorded. Driving pressure was calculated as the difference between peak inspiratory pressure and positive end-expiratory pressure. Dynamic compliance was calculated by dividing the tidal volumes by the driving pressure. Arterial blood gas results during the period of controlled mechanical ventilation were recorded and the PaO2/FiO2 ratio was calculated.
Perioperative care, postoperative complications and outcomes
Postoperative data included: length of stay (LOS); in-hospital infections; rejection episodes during index hospitalization; mechanical ventilation duration; reintubation; tracheostomy; acute kidney injury (AKI); renal replacement therapy; extracorporeal membrane oxygenation (ECMO) and in-hospital mortality. The Social Security Death Index was queried for survival status. Persisting atelectasis was defined as consolidation at the base of the recipient allograft and being still present after 1 week. Pleural complications included persistent pneumothorax (>1 cm and still present 1 week after lung transplant), at least moderate or large pleural effusion and empyema. Acute rejection was diagnosed according to the standard International Society of Heart and Lung Transplant criteria [4].
Resource utilization
Hospital charges were obtained and analysed as previously described [3].
Statistical analysis
Continuous variables are presented with the mean ± standard deviation (SD). Categorical variables are shown in whole numbers and percentages. All charge data and lung allocation scores (LAS) are presented as medians with Interquartile range (IQR), as these data were not normally distributed. Comparisons between groups were made with ANOVA one-way analysis or Fisher exact test as appropriate. The survival and occurrence of the bronchiolitis obliterans syndrome were estimated using the Kaplan–Meier method, and the log-rank test compared survival and bronchiolitis obliterans syndrome between size-matching subsets. P < 0.05 was considered significant. Analysis was performed using JMP 9.0 (www.jmpdiscovery.com).
RESULTS
The pTLC ratios ranged from 0.63 to 0.92 (mean 0.80 ± 0.09) in most-undersized, 1.18–1.43 (mean 1.27 ± 0.10) in most-oversized and 0.97–1.04 (mean 0.99 ± 0.04) in best-matched patients, Table 1. The groups did not differ significantly in age or gender. The median lung allocation scores was significantly higher in the most-undersized group than in the best-matched and in the most-oversized group (47.6 IQR [42–75] vs 38.2 IQR [34–41] vs 36.5 IQR [33–41]). Patients in the most-undersized group more often required cardiopulmonary bypass. The standardized mode of mechanical ventilation after bilateral lung transplantation was pressure assist-control ventilation with a pressure control of ∼20 cm H2O (range 14–26, mean 20.7 ± 2.4) and positive end-expiratory pressure of ∼5 cm H2O (range 5–12, mean 8.4 ± 1.6), which did not differ significantly between subsets, Table 2. Absolute tidal volumes were comparable between most-undersized, best-matched and most-oversized subsets (552 ± 103 vs 581 ± 107 vs 582 ± 104), but there was a trend towards lower absolute tidal volumes in the most-undersized subset (P = 0.069 for most-undersized to most-oversized comparison). Expressing tidal volumes in ml/kg-predicted body weights for the recipient also showed comparable results (Fig. 1). However, there were significant differences in tidal volumes in ml/kg-predicted body weights for the donor between most-undersized, best-matched and most-oversized cohorts (11.4 ± 3.1 vs 9.4 ± 1.2 vs 8.1 ± 2.1, Fig. 2). The mean PaO2/FiO2 ratio for the most-oversized subset was significantly lower than that of the most-undersized and best-matched subsets (290 ± 89 vs 334 ± 89 and 367 ± 90, Table 2, (Fig. 3A). Dynamic compliance and driving pressures were similar between cohorts (Fig. 3B). The median duration of mechanical ventilation did not differ between most-undersized, best-matched and most-oversized subsets (37.5 IQR [25–131] vs 28 IQR [20–39] vs 35 IQR [29–44], Table 3). Two patients developed primary graft dysfunction grade 3, both in the most-undersized subset. Four patients in the most-undersized group underwent tracheostomy (vs none in best-matched and one in most-oversized subset). The median length of stay and charges did not differ statistically between the three groups. There were no deaths during the index hospitalization (Table 4). Two patients in the most-undersized group, one in the best-matched group and none in the most-oversized group died during the first year after transplantation.
Table 1:
Patient characteristics
| Patient characteristics | Most-undersized group | Best-matched group | Most-oversized group |
|---|---|---|---|
| Number of patients | 10 | 10 | 10 |
| Demographics | |||
| Recipient age (years) | 47.4 (14.5) | 44.0 (14.9) | 49.8 (15.2) |
| Hypertension | 4 (40%) | 0 (0%)*,*** | 4 (40%) |
| Diabetes mellitus | 3 (30%) | 1 (10%) | 3 (30%) |
| Coronary artery disease | 0 (0%) | 0 (0%) | 0 (0%) |
| Creatinine | 0.92 (0.4) | 0.83 (0.3) | 0.83 (0.2) |
| Body mass index | 26.8 (5.0) | 23.6 (4.9) | 24.3 (5.0) |
| In ICU prior to transplant | 5 (50%)** | 3 (30%)*** | 0 (0%)**,*** |
| Transplant indications | |||
| LAS Group A (obstructive disease) | 1 (10%) | 2 (20%) | 4 (40%) |
| LAS Group B (pulmonary vascular) | 1 (10%) | 1 (10%) | 0 (0%) |
| LAS Group C (cystic fibrosis) | 3 (30%) | 5 (50%) | 3 (30%) |
| LAS Group D (restrictive disease) | 5 (50%) | 2 (20%) | 3 (30%) |
| Lung allocation score, median (IQR) | 47.6 (42–75)*,** | 38.0 (34–41)* | 36.5 (33–41)** |
| Operative characteristics | |||
| Pulmonary artery systolic pressurea | 52.7 (29.4) | 45.1 (21.1) | 41.7 (8.7) |
| Ischaemic time (min) | |||
| Left, median (IQR) | 272 (198–320) | 260 (195–317) | 256 (206–320) |
| Right, median (IQR) | 241 (182–282) | 199 (159–252) | 192 (141–258) |
| Cardiopulmonary bypass | 7 (70%)*,** | 2 (20%)* | 2 (20%)** |
| PRBC utilization in unitsb | 1.5 (2.8) | 1 (1) | 0.4 (0.7) |
| Graft volume reduction | 0 (0%) | 0 (0%) | 1 (10%) |
| Induction therapy | 6 (60%) | 6 (60%) | 7 (70%) |
| Size-matching characteristics | |||
| Recipient | |||
| Recipient gender (female/male) | 6/4 | 6/4 | 4/6 |
| Recipient height (cm) | 170 (7.7)** | 170 (9.2)*** | 162 (4.9)**,*** |
| Recipient pTLC (l) | 6.1 (0.8)** | 6.2 (1.1)*** | 5.3 (0.6)**,*** |
| Donor | |||
| Donor age (years) | 46.0 (17)** | 45.6 (13)*** | 34.9 (9)**,*** |
| Donor smoking | 4 (40%) | 5 (50%) | 5 (50%) |
| Donor gender (female/male) | 8/2*,** | 4/6*,*** | 0/10**,*** |
| Donor height (cm) | 158 (9.3)*,** | 169 (9.5)*,*** | 173 (12)**,*** |
| Donor pTLC (l) | 4.9 (0.8)*,** | 6.1 (1.2)*,*** | 6.7 (0.9)**,*** |
| pTLC ratio (SD) | 0.80 (0.09)*,** | 0.99 (0.03)*,*** | 1.26 (0.10)**,*** |
aData available for 22 of 30 patients.
bData available for 23 of 30 patients.
*Significant (P < 0.05) difference between most-undersized and best-matched cohort.
**Significant (P < 0.05) difference between most-undersized and most-oversized cohort.
***Significant (P < 0.05) difference between most-oversized and best-matched cohort.
LAS: lung allocation scores; IQR: interquartile range; pTLC: predicted total lung capacity; ICU: intensive care unit; PRBC: packed red blood cells.
Table 2:
Characteristics of postoperative mechanical ventilation after bilateral lung transplantation by size-matching subsets
| Parameters | Most-undersized group | Best-matched group | Most-oversized group |
|---|---|---|---|
| pTLC ratio (SD) | 0.80 (0.09)*,** | 0.99 (0.03)*,*** | 1.26 (0.10)**, *** |
| Number of patients | 10 | 10 | 10 |
| Number of tidal volumes and mechanical ventilation observations | 86 | 71 | 81 |
| Characteristics of mechanical ventilation | |||
| Pressure control (SD) | 21.5 (2.5) | 20.5 (3.3) | 20.4 (1.7) |
| Positive end-expiratory pressure (SD) | 8.6 (1.6) | 7.5 (1.7) | 8.0 (1.6) |
| FiO2 (SD) | 0.24 (0.1) | 0.23 (0.1) | 0.28 (0.1) |
| Peak pressure (SD) | 32.2 (3.6) | 30.2 (3.8) | 31.9 (3.9) |
| Tidal volumes (tidal volumes) | |||
| Tidal volumes (ml), (SD) | 552 (103) | 581 (107) | 582 (104) |
| Tidal volumes (ml/kg-predicted body weights), recipient (SD) | 8.8 (1.4) | 9.3 (1.1) | 9.8 (2.1) |
| Tidal volumes (ml/kg-predicted body weights), donor (SD) | 11.4 (3.1)*,** | 9.4 (1.2)* | 8.1 (2.1)** |
| Blood gas analysis | |||
| pH (SD) | 7.44 (0.07) | 7.42 (0.07) | 7.41 (0.07) |
| pCO2 (SD) | 36.4 (6.0) | 36.2 (5.7) | 36.7 (5.6) |
| pO2 (SD) | 77.5 (14) | 83.2 (18) | 75.7 (16) |
| PaO2/FiO2 ratio (SD) | 334.1(89)* | 367.4 (90)*** | 290.2 (92)*,*** |
| Ventilator mechanics | |||
| Dynamic compliance (SD) | 23.9 (6.2) | 24.8 (13) | 25.0 (6.1) |
| Driving pressure (SD) | 23.6 (2.8) | 22.4 (3.9) | 23.6 (4.8) |
*Significant (P < 0.05) difference between most-undersized and best-matched cohort.
**Significant (P < 0.05) difference between most-undersized and most-oversized cohort.
***Significant (P < 0.05) difference between most-oversized and best-matched cohort.
pTLC: predicted total lung capacity.
Figure 2:
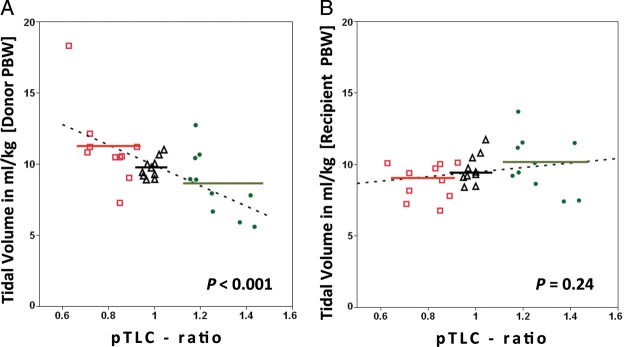
Scatter plot of tidal volumes in ml/kg against predicted total lung capacity (pTLC) ratio. For each patient (n = 30) the mean tidal volume is displayed. In (A) tidal volumes are expressed as ml/kg-predicted body weights of the donor. Tidal volumes in ml/kg [donor-predicted body weights] = 17.1 - (7.18 * pTLC ratio), P < 0.001. In (B) tidal volumes are expressed as ml/kg-predicted body weights of the recipient, P = 0.24. Red squares = most-undersized cohort (n = 10). Black triangles = best-matched cohort (n = 10). Green circles = most-oversized cohort (n = 10). Dotted lines represent regression lines. Solid lines represent mean tidal volumes for most-undersized cohort (red), best-matched cohort (black) and most-oversized cohort (green).
Figure 3:
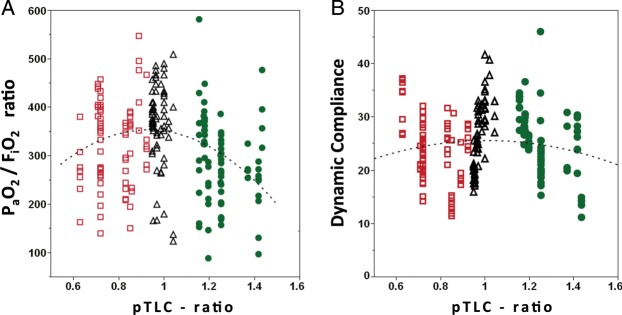
Scatter plot of PaO2/FiO2 ratio and dynamic compliance against pTLC ratio. For each patient (n = 30), all available observations are displayed. (A) PaO2/FiO2 ratio. Dotted curve represents polynomial regression curve (degree = 2), PaO2/FiO2 ratio = 418 − (69 * pTLC ratio) − (462 * [pTLC ratio − 1.006]2), P = 0.0003. (B) Dynamic compliance. Dotted curve represents polynomial regression curve (degree = 2), P = 0.33. Red squares = most-undersized cohort (n = 86 observations). Black triangles = best-matched cohort (n = 71 observations). Green circles = most-oversized cohort (n = 81 observations).
Table 3:
Complications and charges
| Complications and charges | Most-undersized group | Best-matched group | Most-oversized group |
|---|---|---|---|
| Number of patients | 10 | 10 | 10 |
| Postoperative characteristics | |||
| Extracorporeal membrane oxygenation | 0 (0%) | 0 (0%) | 0 (0%) |
| Re-exploration | 1(10%) | 0 (0%) | 0 (0%) |
| Primary graft dysfunction (≥grade 3) | 2(20%) | 0 (0%) | 0 (0%) |
| Duration of mechanical ventilation (h), median (IQR) | 37.5 (25–131) | 28 (20–39) | 35 (29–44) |
| Reintubation | 2 (20%) | 0 (0%) | 1 (10%) |
| Tracheostomy | 4 (40%)* | 0 (0%)* | 1 (10%) |
| Acute rejection during index hospitalization | 0 (0%) | 0 (0%) | 0 (0%) |
| Occurrence of acute rejection | 4 (40%) | 4 (40%) | 3 (30%) |
| Persistent atelectasis | 1 (10%) | 1 (10%) | 1 (10%) |
| Pleural complications | 3 (30%) | 3 (30%) | 5 (50%) |
| Pneumothorax | 2 (20%) | 2 (20%) | 4 (40%) |
| Pleural effusion | 2 (20%) | 1 (10%) | 1 (10%) |
| Empyema | 0 (0%) | 0 (0%) | 0 (0%) |
| Infection | 6 (60%) | 6 (60%) | 7 (70%) |
| Creatinine first 7 days, mean (SD) | 1.76 (0.55) | 1.50 (0.32) | 1.88 (1.05) |
| Acute kidney injury | 7 (70%) | 7 (70%) | 8 (80%) |
| Renal replacement therapy | 0 (0%) | 0 (0%) | 1 (10%) |
| Length of stay (LOS) and re-admissions | |||
| LOS ICU (days), median (IQR) | 4 (2–7.5) | 2.0 (2–4) | 2.5 (2–5) |
| LOS index hospitalization (days), median (IQR) | 26 (13.5–37.8) | 14 (10–22) | 15 (11–24) |
| Re-admissions during first year, median (IQR) | 3 (1–5) | 3.5 (1–5) | 3 (1–3) |
| Hospitalization charges | |||
| Index hospital charges (USD), median (IQR) | $204 666 ($161 393–$278 504) | $147 863 ($134 300–$171 439) | $162 134 ($134 494–191 109) |
| One year without index hospital charges, median (IQR) | $52 935 ($29 157–$227 175)* | $65 458 ($37 445–$118 591)** | $27 671 ($2 826–$41 581)*** |
| Total 1-year hospital charges, median (IQR) | $249 936 ($203 827–$330 406) | $233 411 ($186 609–$286 982) | $178 368 ($157 692–226 763) |
*Significant (P < 0.05) difference between most-undersized and best-matched cohort.
**Significant (P < 0.05) difference between most-oversized and best-matched cohort.
***Significant (P < 0.05) difference between most-undersized and most-oversized cohort.
IQR: interquartile range.
Table 4:
Allograft status
| Allograft status | Most-undersized group | Best-matched group | Most-oversized group |
|---|---|---|---|
| Follow-up | |||
| Number of patients | 10 | 10 | 10 |
| In hospital mortality | 0 (0%) | 0 (0%) | 0 (0%) |
| One-year mortality | 2 (20%) | 1 (10%) | 0 (0%) |
| Follow-up (days), median (IQR) | 648 (407–839) | 822 (460–1165) | 999 (714–1343) |
| Median survival (days) | 707 | 1082 | – |
| Occurrence of acute rejection | 4 (40%) | 4 (40%) | 3 (30%) |
| BOS (yes/no) | 7/3** | 5/5 | 2/8** |
| Time to BOS (years), (SD) | 0.9 (0.5)** | 2.6 (1.6) | 2.8 (1.6)** |
| Median BOS free time (years) | 1.2** | 1.4*** | 3.8**,*** |
| Allograft function at 1 year | |||
| Number of patients | 8 | 10 | 10 |
| FVC (l) | 2.88 (0.6) | 2.96 (1.1) | 2.78 (0.7) |
| FVC (% predicted) | 76.1 (18) | 71.2 (12) | 82.6 (20) |
| FEV1 (l) | 2.02 (0.2) | 2.22 (0.8) | 2.25 (0.5) |
| FEV1(% predicted) | 66.1 (10)** | 66.8 (14)*** | 84.1 (20)**,*** |
| FEV1/FVC | 0.72 (16)** | 0.78 (0.14) | 0.84 (6)** |
| Ve50 | 2.01 (1.2)*,** | 2.88 (1.6)* | 3.0 (1.2)** |
| Ve50/FVC | 0.74 (0.58)** | 1.03 (0.77)*** | 1.20 (0.67)**,*** |
*Significant (P < 0.05) difference between most-undersized and best-matched cohort.
**Significant (P < 0.05) difference between most-undersized and most-oversized cohort.
***Significant (P < 0.05) difference between most-oversized and best-matched cohort.
BOS: bronchiolitis obliterans syndrome; FEV1: forced expiratory volume in 1 second; FVC: forced vital capacity; IQR: interquartile range; Ve50: Maximal expiratory airflow at 50% of the vital capacity.
DISCUSSION
During mechanical ventilation after bilateral lung transplant patients, undersized allografts received relatively higher tidal volumes compared with oversized allografts when the tidal volumes were related to donor predicted body weights.
The difference in tidal volumes between the most-undersized and the most-oversized group could have clinical importance. In patients with no prior lung injury who received mechanical ventilation during bypass for cardiac surgery, larger tidal volumes were associated with higher inflammatory mediator levels [5]. Larger tidal volumes were associated with the development of ARDS in patients who came to the ICU without ARDS, but had risk factors for ARDS [6]. In patients with ARDS, the ARDS-Network tidal volume trial demonstrated a survival benefit of low tidal volumes ventilation (target tidal volumes 6 vs 12 ml/kg-predicted body weights) [1]. In the ARDS-Network trial, low tidal volumes ventilation was associated with a lower PaO2/FiO2 ratio on Days 1 and 3, which was similarly seen in the most-oversized cohort. In a randomized controlled trial comparing a low tidal volumes with a standard donor ventilation strategy, a significantly higher proportion of donor lungs could be utilized from the low tidal volumes group [7]. If a lower tidal volumes approach is protective before transplantation, the same may be true after transplantation. A study reported a higher risk of developing early allograft failure in recipients of undersized allografts, suggesting that hyperinflation of the allograft during mechanical ventilation was injurious [8]. In another study, recipients of undersized allografts were more likely to experience primary graft dysfunction [3]. This investigation has several limitations. It was a retrospective analysis of prospectively collected data at a single centre that examined a small patient population at the extremes of lung-size mismatch. Patients were ventilated using pressure assist-control ventilation. The undersized cohort allografts were probably smaller in size than the best-matched and oversized allografts, and thus could have had lower lung compliance and higher airway resistance. This could have protected the undersized lungs from excessive tidal volumes during pressure assist-control ventilation, as the mean driving pressures were comparable between groups. There was a trend towards lower absolute tidal volumes in the most-undersized group. If volume assist-control is used instead of pressure assist-control ventilation, and if the tidal volumes are set according to recipient body weight, the problem with tidal volumes to donor lung-size mismatch may be greater. The higher acuity and complexity of the most-undersized patients likely explain the differences in outcomes between groups. The pTLC ratio as a marker of allograft–thorax mismatch is imprecise. The pTLC is calculated via regression equations based on sex and height and is derived from population norms. The donor's pTLC is likely reflective of the allograft size. However, the recipient's pTLC might not accurately reflect the thorax size of a patient with end-stage lung disease of different aetiologies. Techniques such as optoelectronic plethysmography or computed tomography volumetry could provide more precise measurements [9]. Haemodynamic compromise during the period of mechanical ventilation in the early post-transplant phase could occur in the setting of a profoundly oversized allograft secondary to a compartment-syndrome-like picture occurring after chest wall closure. This is often recognized at the time of chest wall closure, and when present, an approach of delayed chest wall closure is often chosen. An open chest during the period of mechanical ventilation after lung transplant would significantly affect the airway pressures needed to achieve a goal tidal volume. However, none of the patients included in this study required delayed chest wall closure.
The clinical significance of the differences in tidal volumes expressed relative to donor characteristics remains unanswered by this study. The optimal strategy for mechanical ventilation after bilateral lung transplantation remains unclear and deserves further investigation.
SUPPLEMENTARY DATA
Supplementary material is available at ICVTS online.
Acknowledgements
George Arnaoutakis is the Irene Piccinini Investigator in Cardiac Surgery. We thank Gregory A. Schmidt for his helpful review of the manuscript.
Conflict of interest: none declared.
References
- 1.The ARDS Network. Ventilation with lower tidal volumes as compared with traditional tidal volumes for acute lung injury and the acute respiratory distress syndrome. N Engl J Med. 2000;342:1301–8. doi: 10.1056/NEJM200005043421801. [DOI] [PubMed] [Google Scholar]
- 2.Ranieri VM, Suter PM, Tortorella C, De Tullio R, Dayer JM, Brienza A, et al. Effect of mechanical ventilation on inflammatory mediators in patients with acute respiratory distress syndrome: a randomized controlled trial. JAMA. 1999;282:54–61. doi: 10.1001/jama.282.1.54. [DOI] [PubMed] [Google Scholar]
- 3.Eberlein M, Arnaoutakis GJ, Yarmus L, Feller-Kopman D, Dezube R, Chahla MF, et al. The effect of lung size mismatch on complications and resource utilization after bilateral lung transplantation. J Heart Lung Transplant. 2012;31:492–500. doi: 10.1016/j.healun.2011.12.009. [DOI] [PubMed] [Google Scholar]
- 4.Stewart S, Fishbein MC, Snell GI, Berry GJ, Boehler A, Burke MM, et al. Revision of the 1996 working formulation for the standardization of nomenclature in the diagnosis of lung rejection. J Heart Lung Transplant. 2007;26:1229–42. doi: 10.1016/j.healun.2007.10.017. [DOI] [PubMed] [Google Scholar]
- 5.Zupancich E, Paparella D, Turani F, Munch C, Rossi A, Massaccesi S, et al. Mechanical ventilation affects inflammatory mediators in patients undergoing cardiopulmonary bypass for cardiac surgery: a randomized clinical trial. J Thorac Cardiovasc Surg. 2005;130:378–83. doi: 10.1016/j.jtcvs.2004.11.061. [DOI] [PubMed] [Google Scholar]
- 6.Gajic O, Frutos-Vivar F, Esteban A, Hubmayr RD, Anzueto A. Ventilator settings as a risk factor for acute respiratory distress syndrome in mechanically ventilated patients. Intensive Care Med. 2005;31:922–6. doi: 10.1007/s00134-005-2625-1. [DOI] [PubMed] [Google Scholar]
- 7.Mascia L, Pasero D, Slutsky AS, Arguis MJ, Berardino M, Grasso S, et al. Effect of a lung protective strategy for organ donors on eligibility and availability of lungs for transplantation: a randomized controlled trial. JAMA. 2010;304:2620–7. doi: 10.1001/jama.2010.1796. [DOI] [PubMed] [Google Scholar]
- 8.Kozower BD, Meyers BF, Ciccone AM, Guthrie TJ, Patterson GA. Potential for detrimental hyperinflation after lung transplantation with application of negative pleural pressure to undersized lung grafts. J Thorac Cardiovasc Surg. 2003;125:430–2. doi: 10.1067/mtc.2003.139. [DOI] [PubMed] [Google Scholar]
- 9.Chen F, Kubo T, Shoji T, Fujinaga T, Bando T, Date H. Comparison of pulmonary function test and computed tomography volumetry in living lung donors. J Heart Lung Transplant. 2011;30:572–5. doi: 10.1016/j.healun.2010.11.019. [DOI] [PubMed] [Google Scholar]
Associated Data
This section collects any data citations, data availability statements, or supplementary materials included in this article.