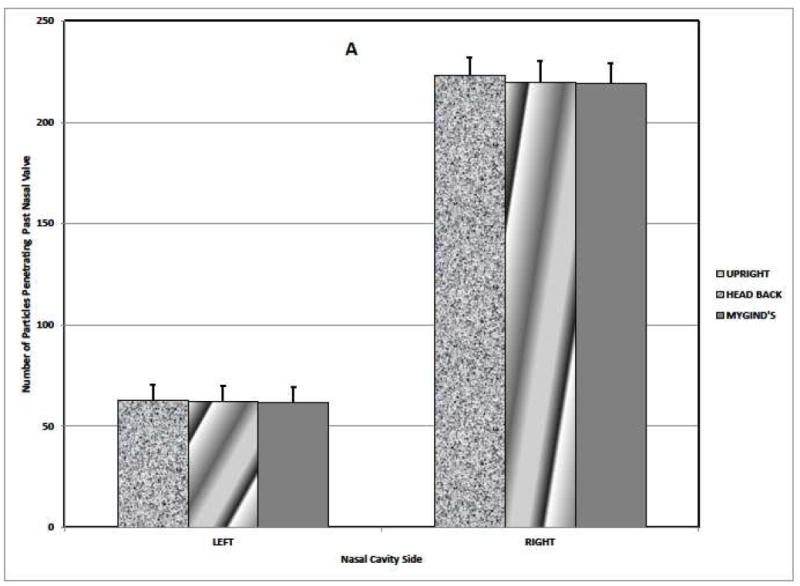
FIGURE 2.

Aerosol particle deposition posterior of the nasal valve area on the right and left (obstructed) sides of the airway. The bars indicate the means + standard deviation.
(A) Airflow Present.
(B) Airflow Absent.

Aerosol particle deposition posterior of the nasal valve area on the right and left (obstructed) sides of the airway. The bars indicate the means + standard deviation.
(A) Airflow Present.
(B) Airflow Absent.