Abstract
Capillary electrophoresis-SELEX (CE-SELEX) has previously been used to select aptamers for large molecule targets such as proteins, lipopolysaccharides and peptides. For the first time, we have performed CE-SELEX selection for a small molecule target, N-methyl mesoporphyrin (NMM), with a molecular weight of only 580 g/mol. DNA aptamers with high nanomolar to low micromolar dissociation constants were achieved after only three rounds of selection. This corresponds to an >50-fold improvement in affinity over the random library. Two out of eight randomly chosen aptamers were found to catalyze the metal insertion reaction of mesoporphyrin with 1.7 and 2.0-fold rate enhancements, respectively.
Introduction
Aptamers are in vitro selected short single stranded DNA (ssDNA) or RNA molecules that can bind certain targets with high affinity and specificity1. Despite comprising of four chemically similar subunits, they can fold into complex secondary and tertiary structures and form binding sites and catalytic cores similarly to proteins. A number of aptamers have been selected for various target molecules including proteins2–4, peptides5, 6, small molecules7, metal ions8, 9, and even organelles10 and entire cells11. Compared to their protein counterparts - antibodies, aptamers possess many advantages12. Aptamers can be selected in vitro and cost-effectively synthesized once their sequence is determined while the generation of antibodies requires in vivo immunization. They can work under non-physiological conditions that may be fatal for antibodies. They can be easily modified by a variety of functional groups and attached to solid phase substrates using various chemistries. Due to their excellent recognition and binding ability, aptamers have become important analytical tools, such as the stationary phase for affinity chromatography separations13, affinity probes for capillary electrophoresis detection14 and biosensors in microarray chips15. Moreover, researchers are finding applications in therapeutic areas. Aptamers targeting the vascular endothelial growth factor (VEGF) have been developed into drugs for treatment of age-related macular degeneration16.
The first step to all the various applications is to isolate the rare aptamers from the massive number of non-binding sequences in a random library. Aptamers are selected using a process referred to as systematic evolution of ligands by exponential enrichment (SELEX)17. In the SELEX process, iterative rounds of separation of bound sequences, PCR amplification and purification are employed to evolve aptamers with high affinity. Conventional SELEX makes use of affinity chromatography18, 19 or nitrocellulose filtration17, 20 as the separation technique and usually requires 8–12 rounds of selection. Recently, capillary electrophoresis has emerged to be a more efficient separation technique for SELEX due to its high resolution21. Aptamers have been selected using CE-SELEX in only 1–4 rounds greatly reducing the selection cycles and time needed22, 23. Furthermore, CE-SELEX allows the binding and separation to take place in free solution allowing the aptamers to interact with targets without steric hindrance. CE-SELEX is normally believed to be only suitable for isolating aptamers for large protein targets24–26 as it requires the aptamers to undergo a large mobility shift upon binding the targets. In a recent study, aptamers for a small peptide target neuropeptide Y (4272 Dalton) which is even smaller than the DNA itself (25 KDa) have also been successfully selected using CE-SELEX27 in only four rounds indicating the potential of using CE-SELEX for small molecule targets. In the case of small molecule targets, the mobility of the complex is expected to be changed only minimally from the non-binding sequences, resulting in only partial separation of the bound and unbound sequences. However, due to the fact that nucleic acids can be exponentially amplified by PCR, even if only a small portion of the complex can be collected, satisfactory enrichment can be achieved. Moreover, under the case of separation with low resolution, multiple iterative rounds of enrichment can still eventually evolve a high abundant pool with high affinity aptamers28.
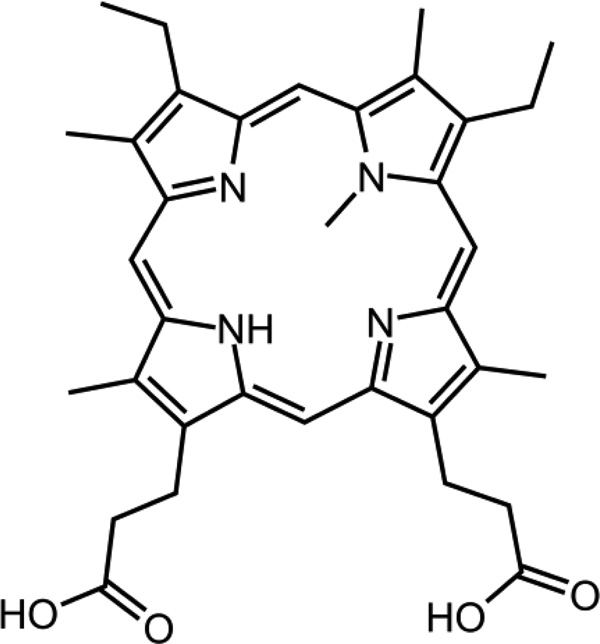
In this manuscript, we describe using CE-SELEX to select DNA aptamers for a small molecule target: N-methyl mesoporphyrin IX (NMM). NMM is a small organic compound with a molecular weight of only 580 g/mol which is nearly an order of magnitude smaller than neuropeptide Y. To our knowledge, CE-SELEX has never before been used to isolate apatamers for such small targets. Figure 1 illustrates the chemical structure of NMM. It takes a distorted planar structure due to the presence of the methyl group. The bent aromatic ring system mimics the transition state of the porphyrin during metallation and inhibits the corresponding metal insertion reaction catalyzed by porphyrin chelatase29. Both RNA30, 31 and DNA32–34 aptamers have been selected for NMM previously using affinity columns and found to be catalytic for porphyrin metallation reactions. We are now using CE-SELEX for the selection of NMM aptamers to investigate the limit of this technique in selecting aptamers with affinity for small molecule targets.
Figure 1.
Chemical structure of the target N-methyl mesoporphyrin IX (NMM), MW=580 g/mol
Experimental
Chemicals
N-Methyl Mesoporphyrin IX (NMM) was purchased from Frontier Scientific Inc. (Logan, Utah). The ssDNA library used for selection consisted of 40 random bases flanked by two primer regions (5’-AGC AGC ACA GAG GTC AGA TG (40 random bases) CCT ATG CGT GCT ACC GTG AA-3’). The ssDNA library, primers and selected aptamers were all synthesized by Integrated DNA Technologies, Inc. (Coralville, IA). dNTPs and 25 bp DNA ladder were obtained from Life Technologies (Grand Island, NY). Taq polymerase and ThermoPol buffer were obtained from New England Biolabs (Ipswich, CA). The gel loading dye was from Promega (Madison, WI). All other chemicals were purchased from Sigma-Aldrich (St. Louis, MO). All the samples and buffers were prepared using 0.2 µm membrane filtered water from Milli-Q water purification system (Millipore Corp., Billerica, MA).
Capillary electrophoresis selection
Before selection, ~100 µM ssDNA library was heated to 72 °C for 10 min in TGK buffer (25 mM Tris, 192 mM glycine, 5 mM KH2PO4, pH 8.3) and cooled down to room temperature. The target NMM was then added to the library to a final concentration of 1 µM for the first round and 100 nM for subsequent rounds of selection. The ssDNA library was allowed to incubate with the NMM at room temperature for at least 20 min to ensure that the binding reached equilibrium.
Capillary electrophoresis selection was performed using a 40.2 cm-long (with 30 cm to the detector), 50 µm-inner diameter, 360 µm-outer diameter uncoated fused silica capillary (Polymicro Technologies, Phoenix, AZ) on a P/ACE MDQ capillary electrophoresis system (Beckman Coulter Inc., Fullerton, CA). The capillary was first rinsed with 0.15 M NaOH and then the TGK buffer for 4 min under 30 psi pressure before injection of the incubation mixture at 1 psi for 4 s. The mixture was separated under 30 kV voltage (normal polarity) in TGK buffer at 25 °C and the separation was monitored under UV absorbance detection at 254 nm. The NMM-aptamer complex migrated off the capillary before the unbound ssDNA and was collected into a vial containing 48 µL separation buffer at the capillary outlet. After collecting the bound sequences, the voltage was turned off and the unbound sequences were washed off the capillary into a waste container using high pressure.
PCR amplification and ssDNA generation
The collected sequences were then PCR amplified to generate a new pool for the next round of selection. The PCR reaction master consisted of 200 µM dNTPs, 510 nM forward primer (5’-AGC AGC ACA GAG GTC AGA TG-3’), 510 nM biotinylated reverse primer (5’/biotin/-TTC ACG GTA GCA CGC ATA GG-3’), 0.025 unit/uL Taq polymerase and 7.5 mM MgCl2 in 1x ThermoPol PCR buffer (20 mM Tris-HCl, 10 mM (NH4)2SO4, 10 mM KCl, 2 mM MgSO4, 0.1% Triton X-100, pH 8.8). The high magnesium concentration helped improve the PCR efficiency of amplifying such a low concentration of the collected bound sequences. 20 cycles of denaturation (94 °C, 30 s), annealing (53 °C, 30 s) and extension (72 °C, 20 s) were performed and followed by a final 5 min extension period at 72 °C. The length and the yield of the PCR products were verified and estimated using electrophoresis on a 1.5% agarose gel stained with ethidium bromide and imaged using a UV transluminator (Spectroline, Westbury, NY).
The PCR products were purified and made single stranded using a streptavidin agarose resin (Pierce Biotechnology, Rockford, IL) and chromatography column (Bio-Rad, Hercules, CA). The PCR products were first incubated with streptavidin agarose resin in binding buffer (10 mM Tris, 50 mM NaCl and 1 mM EDTA, pH 7.5) for 30 min with periodical shaking. The column was then washed 10 times with 1 mL buffer to remove the PCR reagents while the amplified dsDNA was retained on the column through the interaction between streptavidin and the biotinylated strand. The desired forward DNA strand was eluted out of the column by incubating with 0.15 M NaOH for 10 min at 37 °C and desalted and concentrated by ethanol precipitation.
Dissociation constant Kd measurements
Dissociation constants Kd were measured by monitoring the increase of the fluorescence intensity of NMM after binding the aptamers35, 36. Aptamers of varying concentrations were mixed with 500 nM NMM after 10 min annealing at 72 °C and slowly cooling down to room temperature in TGK buffer. The fluorescence intensity of 15 µL of each mixture sample was measured in a 384-well microplate (Corning Inc., Corning, NY) using a Synergy 2 Microplate Reader (BioTek, Winooski, VT). Fluorescence was excited using a tungsten lamp with a 360/40 nm filter and measured at 610 nm emission. The net increase of the fluorescence intensity was then plotted against the aptamer concentration and the dissociation constant Kd can be determined by fitting the binding curve using the following equation:
| (1) |
where I and I0 are the fluorescence intensity of NMM in the presence and absence of aptamers respectively. Dissociation constant Kd and another constant p were obtained by non-linear fitting using the Origin v8.5 (OriginLab Corporation, Northampton, MA).
DNA cloning and sequencing
ssDNA sequences were cloned after 3 rounds and 6 rounds of selection using a TOPO TA Cloning kit from Invitrogen (Grand Island, NY). Aliquots of the two selected pools were PCR amplified under the same conditions described previously except using non-labeled reverse primer and 10 min final extension period. The PCR products were ligated onto pCR4-TOPO vectors and transformed into TOP10 Chemically Competent E.coli cells. Individual colonies were randomly picked and cultured in liquid LB broth (Invitrogen, Grand Island, NY) after growing the cells for 24 hours on a LB plate at 37 °C. Plasmid vectors containing selected sequences were extracted from the cells after overnight growth in LB broth at 37 °C using the plasmid miniprep kit from Invitrogen (Grand Island, NY). The vectors were sequenced by the BioMedical Genomics Center at the University of Minnesota (St. Paul, MN) using the T7 promoter primer.
Catalytic activity measurements
The initial rate of Cu (II) insertion into mesoporphyrin IX (MP) catalyzed by selected aptamers was measured by monitoring the absorbance at 561 nm of the reaction mixture in a clear 96-well microplate (Corning Inc., Corning, NY) using the Microplate Reader. 5 µM of the selected aptamers were initially annealed at 72 °C in kinetics buffer (25 mM Tris-OAc, 25 mM KCl, pH 7.5) for 10 min. After slowly cooling down to room temperature, Triton X-100, dimethyl sulfoxide (DMSO) and the MP were then added to final concentrations of 0.5% (w/v) Triton X-100, 1% (v/v) DMSO and 100 µM MP. The mixture was allowed to equilibrate for more than 20 min at room temperature before the addition of 200 µM Cu(OAc)2 to initiate the reaction. The reaction rate was calculated according to the molar absorption difference (ε = 18.6 mM−1cm−1)37 of MP and its product Cu-mesoporphyrin IX (Cu-MP). The UV absorbance spectra of MP and Cu-MP were also measured using the Microplate Reader. Cu-MP was synthesized by incubating 200 µM Cu(OAc)2 with 100 µM MP in dark for 24 hours.
Results and discussion
CE-SELEX selection
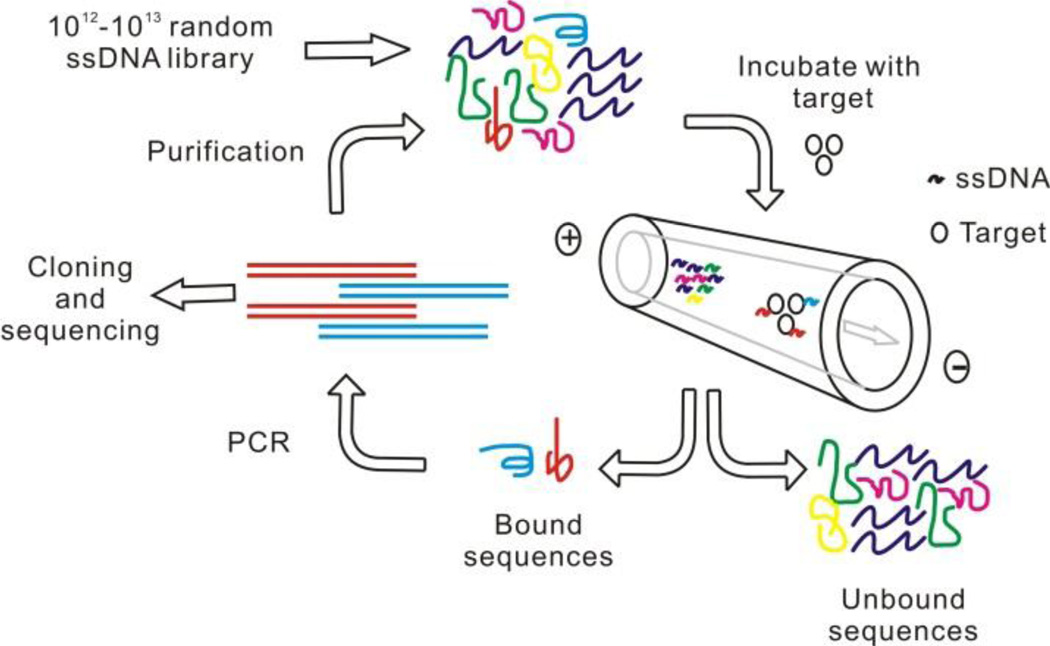
Figure 2 illustrates the overall selection scheme of CE-SELEX. Briefly, a random ssDNA library containing 1012–1013 sequences is incubated with a low concentration of target in free solution followed by CE separation. The bound sequences are separated from the unbound sequences and collected for PCR amplification. The bound fraction is thus enriched and then purified and made single stranded again for next round of selection. This process repeats until there is no more affinity improvement in the selected pools. Finally the sequences can be determined by cloning and sequencing the selected pools.
Figure 2.
Schematic illustration of CE-SELEX process.
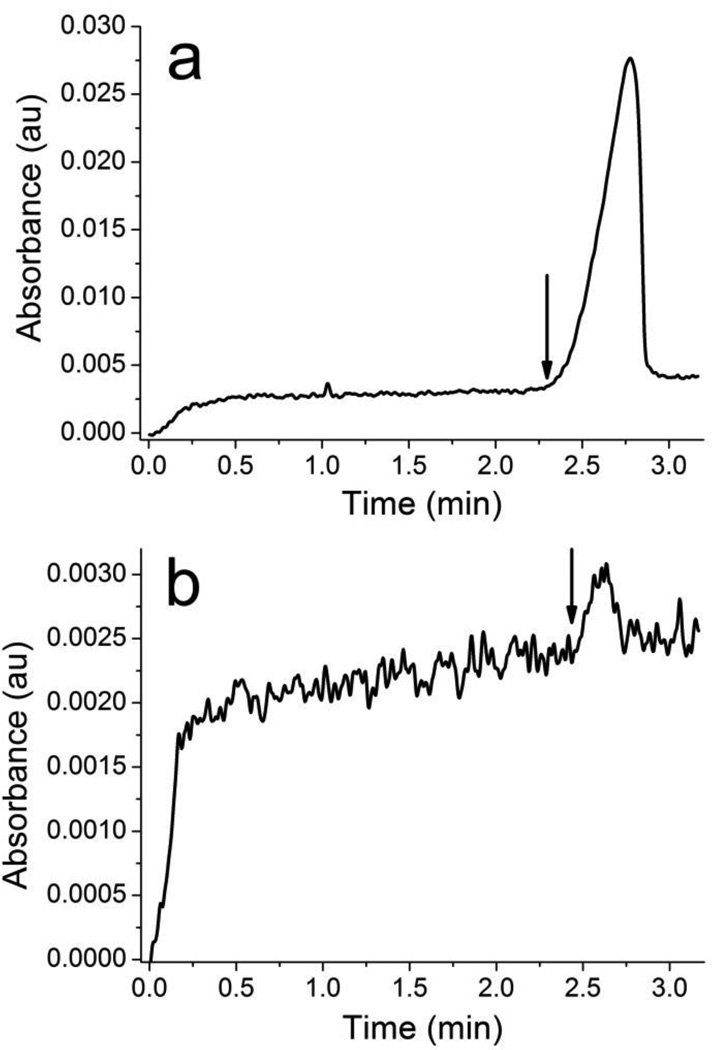
In the presence of electroosmotic flow (EOF), the unbound ssDNA migrates off the capillary as a single peak while the aptamer-NMM complex would be expected to migrate off the capillary earlier due to the larger size and lower electrophoretic mobility. Due to the small size of NMM, the change in the electrophoretic mobility of the ssDNA upon binding the target is expected to be small and the complex may not be completely resolved from the unbound peak. Taking this into account a collection window was chosen immediately before the leading edge of the free ssDNA peak (see Figure 3). The single peak observed in the electropherogram is the large excess of unbound ssDNA. Binding sequences were collected up to the time point marked with the arrow. We anticipate CE-SELEX would be successful even if the bound and unbound ssDNA are not completely resolved since the leading edge of the unresolved peak would be biased toward the bound sequences. In this case more rounds of selection may be necessary to fully enrich the ssDNA pool with binding aptamers.
Figure 3.
Selection electropherograms for: a) 1st round of selection and b) 2nd round of selection. The selection electropherograms for rounds 3 through 6 are similar to the 2nd round.
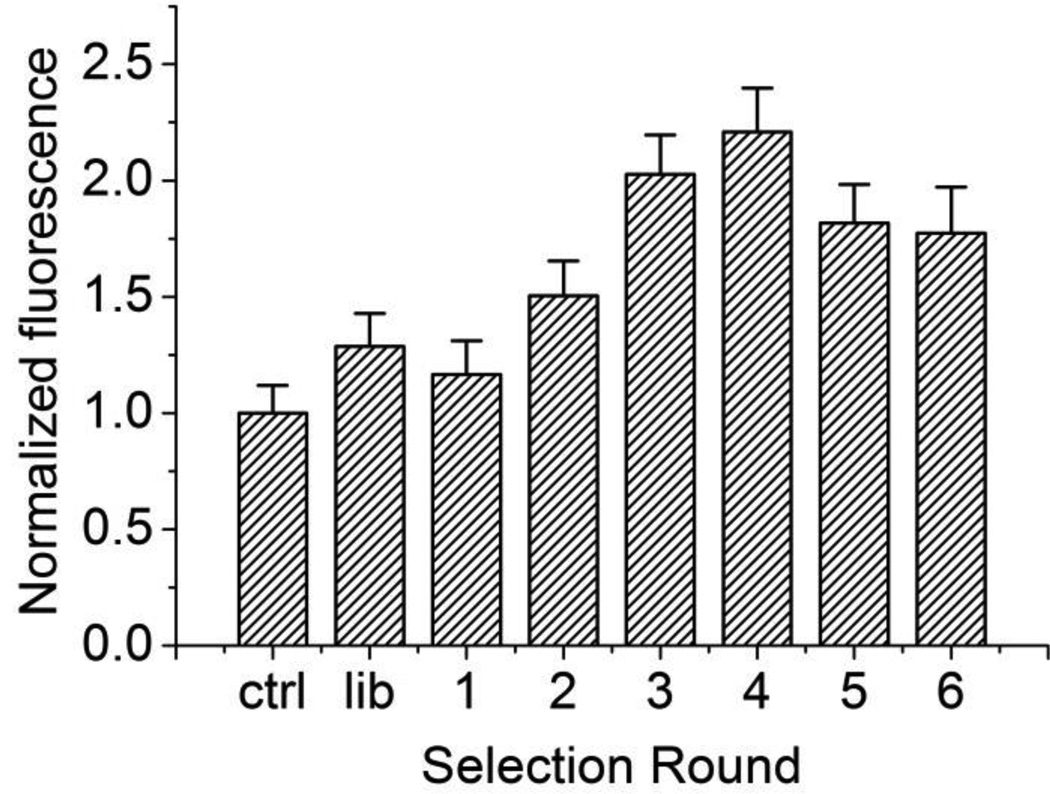
The affinity of the enriched pool was assessed after each round to determine if further rounds of selection were needed. Previously reported aptamers for NMM are capable of increasing the fluorescence of NMM by over 20-fold upon binding36, 38. Therefore a similar fluorescence assay was chosen to assess the affinities of the selected pools for NMM. The dissociation constants of aptamers for small molecules such as NMM typically range from the high nanomolar to low micromolar range30–32, 39. The amount of ssDNA recovered after each selection round was limited, preventing us from obtaining a complete binding curve with the µM NMM concentrations necessary to saturate the aptamers. Instead, the fluorescence of only one sample containing 500 nM NMM and 2-fold diluted (~1 µM) ssDNA from each selected pool was used to estimate the binding affinity. Figure 4 shows the normalized fluorescence intensity of NMM upon binding each selected pool. From the 1st round through the 4th round, the affinity of the selected pools improves with increasing rounds of selection. After 3 rounds of selection, the fluorescence of the complex increases by over 2-fold. However, after 4 rounds of selection, instead of increasing, the overall fluorescence intensity decreases slightly for the 5th and 6th rounds. This indicates there is no more affinity improvement for 5th and 6th round of selection.
Figure 4.
Normalized fluorescence intensity of NMM upon binding each selected pool. The first column is the fluorescence intensity of native NMM in the absence of ssDNA. All other measurements were normalized to this control. Error bars represents the standard deviation.
The ssDNA pools from the 3rd and 6th rounds were cloned and sequenced after the selection. 20 sequences from the 3rd round pool and 35 sequences from the 6th round pool were identified. The detailed sequence information is summarized in Table S1 of the supporting information. Note that sequence heterogeneity in the pools remains high throughout the selection, a characteristic common for CE-SELEX. Although no single common sequence motif was identified, we observed that the sequences from the 3rd round pool all contain 30–40% guanines, which is statistically higher than the 25% percentage predicted in a random library. 80% of the sequences have 4 continuous guanines (-GGGG-) and 40% of sequences have 4 double guanines (-GG-) sequences. This suggests that these sequences are potentially capable of forming either inter- or intra-molecular G-quadruplex structures. This feature is in good agreement with previously selected NMM aptamers, which also adopt G-quadruplex structures32, 36, 40. However, the sequences from the 6th round deviate from the previous trend with only 8% -GGGG- and 17% four double guanines (-GG-) in a given sequence. The overall percentage of guanine in one sequence also drops to 25%. We attribute this deviation to the difficulty PCR amplifying sequences with high guanine percentages. It was noticed that the PCR yield for the 5th and 6th round of selection was much higher than the previous rounds probably due to the decrease in the guanine percentage.
Dissociation constants of selected aptamers
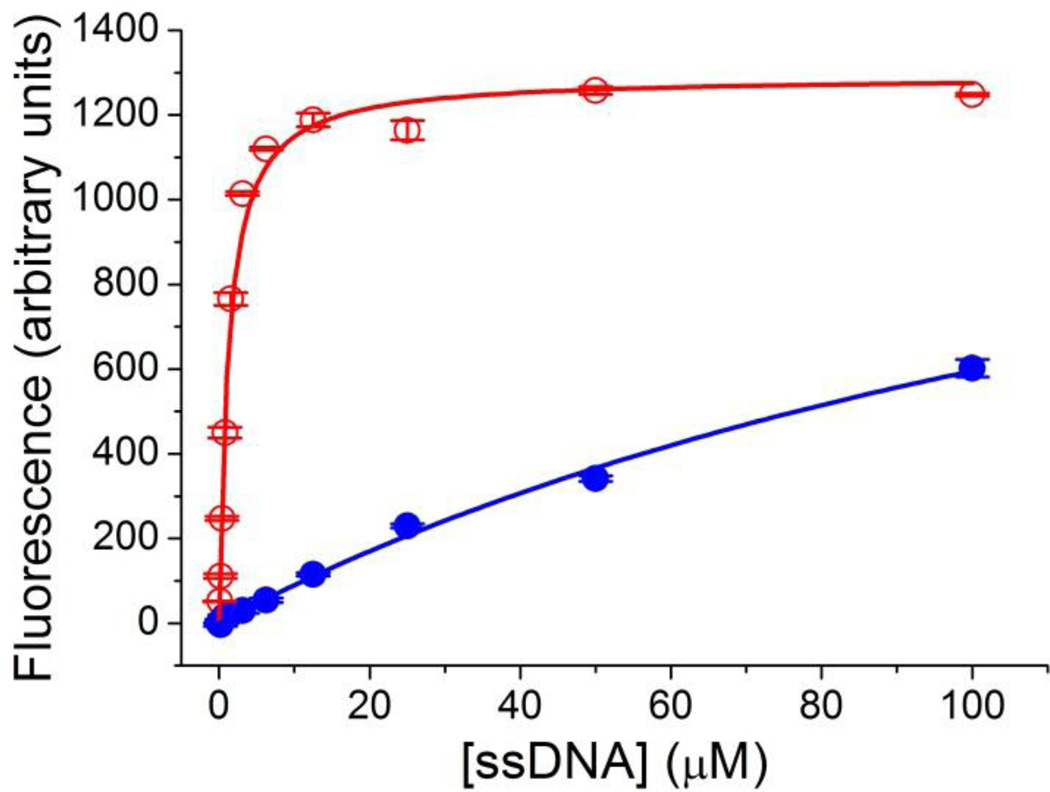
Four sequences were randomly chosen from each of the sequenced pools for further characterization. Two sequences from 6th round pool that appeared twice in the cloning results were chosen since these sequences may be present in higher abundance. The dissociation constants for these sequences were determined by measuring the fluorescence enhancement of NMM upon binding DNA aptamers. Figure 5 shows a representative binding curve of one of the clones and a similar curve for the starting library. The fluorescence intensity of NMM-clone 6.23 complex (red) reaches saturation in the presence of approximately 12.5 µM aptamer while even in the presence of 100 µM library, the fluorescence intensity of NMM is less than half of the maximum and it is still continuously increasing according to the trend (blue). Clearly there is a substantial improvement in the binding affinity for the selected clones.
Figure 5.
Binding curves for clone 6.23 (red open circles) and the random ssDNA library (blue solid circles). The error bar represents the standard deviation. The Kd determined for clone 6.23 is 1.2 ± 0.1 µM. The Kd for the unselected library is estimated to be > 50 µM.
The dissociation constants of all the synthesized clones are summarized in Table 1. All the clones from the 3rd round pool bind the NMM with Kd values ranging from hundreds of nanomolar to several micromolar. This is again in good accordance with previously reported Kd values for NMM aptamers30–32. It also demonstrates that DNA aptamers binding NMM can be evolved after only 3 rounds of CE-SELEX selection. However, for sequences from the 6th round, only clone 6.23 binds the NMM with a similar Kd of 1.2 µM. Clone 6.4 binds the NMM with a fairly high Kd of 43 µM and all the other clones are not fully bound even at the highest DNA concentration assessed (40 µM or 100 µM). This deterioration in the binding efficiency of the pool is probably driven by the PCR bias for sequences with lower guanine content. As the selection goes on and the abundance of binding sequences gets higher, PCR efficiency may play a more important role, impacting the selection more than the CE separation. Another possibility is that the non-responsive clones from the 6th round pool may bind the NMM but could not be measured using the above method if binding did not induce an enhancement in fluorescence.
Table 1.
Dissociation Constants (Kd) of Sequences Chosen at Random from Table S1.
| Sequences | Kd (µM)* |
|---|---|
| Clone 3.2 | 5.1 ± 0.9 |
| Clone 3.5 | 0.88 ± 0.12 |
| Clone 3.12 | 3.0 ± 0.5 |
| Clone 3.14 | 6.4 ± 0.6 |
| Clone 6.4 | 43 ± 32 |
| Clone 6.6 | > 50 |
| Clone 6.8 | > 50 |
| Clone 6.12 & 6.22 | > 20 |
| Clone 6.20 & 6.34 | > 20 |
| Clone 6.23 | 1.2 ± 0.1 |
| Library | > 50 |
Errors represent the standard error.
Enzymatic activity
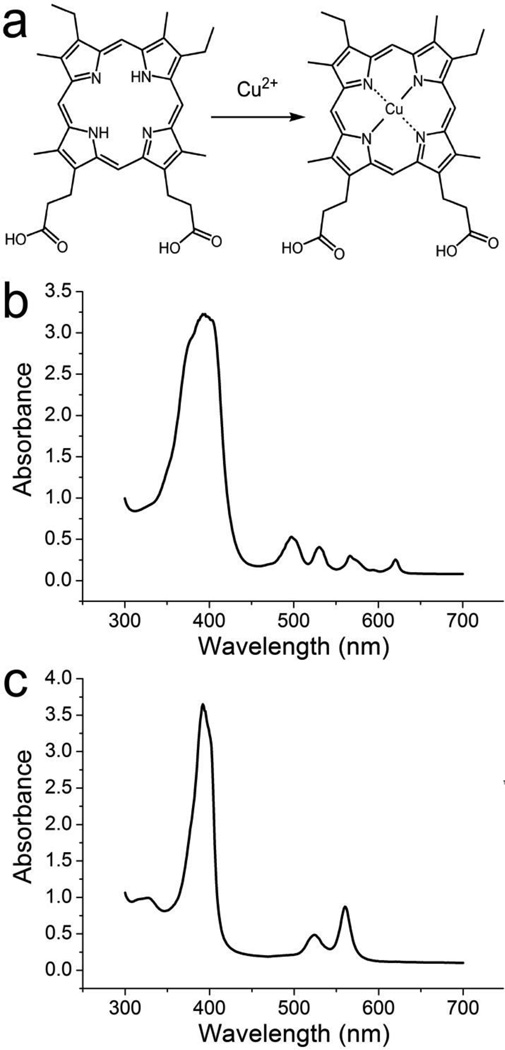
NMM is a distorted porphyrin ring that has been used as a transition state analog for the porphyrin metallation reaction29. Previous studies have found that NMM binding aptamers are also capable of catalyzing the corresponding metal insertion reaction by stabilizing the transition state of the reaction30, 31, 33, 34. In order to test whether the DNA aptamers selected by CE-SELEX are also catalytic, we studied the insertion reaction of Cu (II) into mesoporphyrin IX (MP). Figure 6a illustrates the overall reaction equation. The inserted Cu (II) coordinates the four nitrogen atoms and results in a structure with a higher degree of symmetry. This changes the electronic structure and thus the UV-Vis spectra of the porphyrin. Figure 6b and 6c show the UV-Vis absorption spectra of the substrate MP and the product Cu-MP. Upon metallation, the intense B band around 400 nm narrows and the intensity increases slightly. The four Q bands from 500 to 700 nm collapse into two more intense bands (λ = 525 nm and 561 nm). The overall reaction rate was measured at 561 nm due to the higher signal to noise ratio.
Figure 6.
a. Insertion reaction of Cu (II) into mesoporphyrin IX (MP); b, c: UV-Vis spectra of MP (b) and Cu-MP (c).
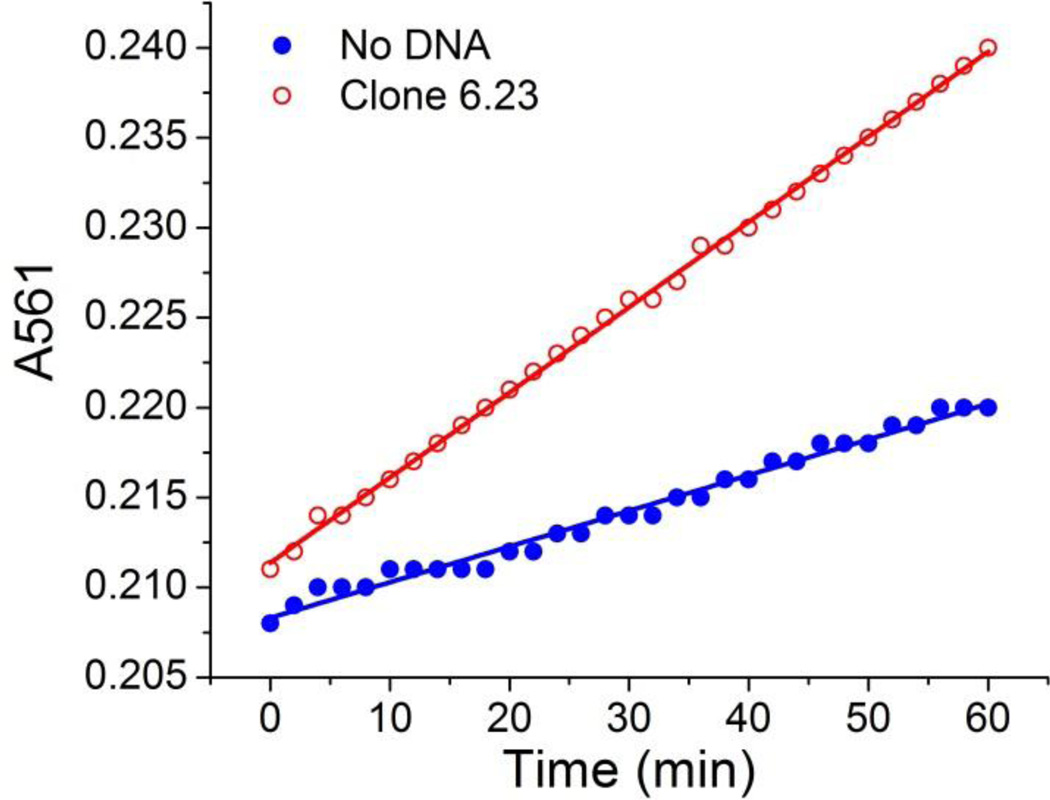
Figure 7 shows the increase of absorbance at 561 nm over the first 60 min of reaction. Clearly, the metalloporphyrin forms faster in the presence of clone 6.23 (red open circles) than in the absence of the DNA aptamers (blue solid circles). Among all the clones selected by CE-SELEX, clone 3.5 and clone 6.23 were found to accelerate the reaction by 1.7 and 2.0 fold, respectively (Table 2). All other clones listed in Table 1 were found to be non-catalytic. Similarly, the random library does not catalyze the reaction. It was found that the two catalytic clones are also the two with the lowest dissociation constants (0.88 µM for clone 3.5 and 1.2 µM for clone 6.23). This suggests that the catalytic activity depends strongly on how tightly the aptamers can bind the transition state. We have also measured the reaction rate in the presence of a 18mer aptamer (5’-GTG GGT TGG GTG GGT TGG-3’) that has previously been shown to bind NMM and accelerate the reaction41 for comparison. The 18mer aptamer shows 7.1-fold rate enhancement under the same reaction conditions. The dissociation constant of the 18mer aptamer was measured to be 0.7 µM using the fluoresence method as described above. Apparently aptamers with Kd values of about 1 µM or even lower are required to catalyze this reaction. For all the other selected aptamers with Kd values significantly larger than 1.0 µM, we assume that the energy released upon binding the transition state is not sufficient to accelerate the reaction considering the low fraction of bound species under the reaction condition.
Figure 7.
Absorbance at 561 nm in the presence (red open circles) and absence (blue solid circles) of clone 6.23.
Table 2.
Catalytic Activity of Selected Aptamers
| Sequence | Vobs (µM/min)* |
|---|---|
| Clone 3.5 | 0.0441 ± 0.0005 |
| Clone 6.23 | 0.0538 ± 0.0003 |
| background | 0.0264 ± 0.0003 |
| library | 0.0272 ± 0.0006 |
| 18mer | 0.187 ± 0.001 |
Errors represent the standard error.
Conclusions
We have used CE-SELEX to successfully isolate DNA aptamers for a small molecule target NMM with high nM to low µM affinity in only three rounds of selection. Among the selected aptamers, the strongest binders also exhibit catalytic activity for the porphyrin metallation reaction. Conventionally, selection of aptamers for small molecule targets like NMM requires being attached to solid phase support and subjected to affinity column separation. Compared to the affinity chromatography method, CE-SELEX greatly reduces the selection time and the number of cycles needed (3 vs 10–12 rounds). It also eliminates the necessity of solid phase attachment, reducing the potential for non-specific interactions. The free solution environment for binding and separation allows the aptamers to access the target from all directions facilitating the discovery of binders using various approaches. More importantly, this study demonstrates the feasibility of applying CE-SELEX for small molecule targets which contain a class of important compounds for cell signaling and regulation. The characteristic of nucleic acids of being able to be amplified by PCR makes even partial separation adequate for CE-SELEX to be carried out. It broadens the scope of targets for CE-SELEX and also provides a new technique for selection of aptamers towards small molecule targets. Therefore, we believe CE-SELEX is a more versatile technique than previously perceived.
Supplementary Material
Acknowledgement
This work is funded by the National Institutes of Health (GM063533) and the University of Minnesota.
Footnotes
Supporting information:
Additional information as noted in text. This material is available free of charge via the Internet at http://pubs.acs.org.
References
- 1.Famulok M, Mayer G, Blind M. Acc. Chem. Res. 2000;33:591–599. doi: 10.1021/ar960167q. [DOI] [PubMed] [Google Scholar]
- 2.Bock LC, Griffin LC, Latham JA, Vermaas EH, Toole JJ. Nature. 1992;355:564–566. doi: 10.1038/355564a0. [DOI] [PubMed] [Google Scholar]
- 3.Wiegand TW, Williams PB, Dreskin SC, Jouvin MH, Kinet JP, Tasset D. J. Immunol. 1996;157:221–230. [PubMed] [Google Scholar]
- 4.Ruckman J, Green LS, Beeson J, Waugh S, Gillette WL, Henninger DD, Claesson-Welsh L, Janjic N. J. Biol. Chem. 1998;273:20556–20567. doi: 10.1074/jbc.273.32.20556. [DOI] [PubMed] [Google Scholar]
- 5.Nieuwlandt D, Wecker M, Gold L. Biochemistry. 1995;34:5651–5659. doi: 10.1021/bi00016a041. [DOI] [PubMed] [Google Scholar]
- 6.Faulhammer D, Eschgfaller B, Stark S, Burgstaller P, Englberger W, Erfurth J, Kleinjung F, Rupp J, Vulcu SD, Schroder W, Vonhoff S, Nawrath H, Gillen C, Klussmann S. RNA. 2004;10:516–527. doi: 10.1261/rna.5186504. [DOI] [PMC free article] [PubMed] [Google Scholar]
- 7.Famulok M. Curr. Opin. Struct. Biol. 1999;9:324–329. doi: 10.1016/S0959-440X(99)80043-8. [DOI] [PubMed] [Google Scholar]
- 8.Ciesiolka J, Yarus M. RNA. 1996;2:785–793. [PMC free article] [PubMed] [Google Scholar]
- 9.Hofmann HP, Limmer S, Hornung V, Sprinzl M. RNA. 1997;3:1289–1300. [PMC free article] [PubMed] [Google Scholar]
- 10.Ringquist S, Jones T, Snyder EE, Gibson T, Boni I, Gold L. Biochemistry. 1995;34:3640–3648. doi: 10.1021/bi00011a019. [DOI] [PubMed] [Google Scholar]
- 11.Shangguan D, Li Y, Tang Z, Cao Z, Chen H, Mallikaratchy P, Sefah K, Yang C, Tan W. Proc. Natl. Acad. Sci. U.S.A. 2006;103:11838–11843. doi: 10.1073/pnas.0602615103. [DOI] [PMC free article] [PubMed] [Google Scholar]
- 12.Jayasena SD. Clin. Chem. 1999;45:1628–1650. [PubMed] [Google Scholar]
- 13.Deng Q, German I, Buchanan D, Kennedy RT. Anal. Chem. 2001;73:5415–5421. doi: 10.1021/ac0105437. [DOI] [PubMed] [Google Scholar]
- 14.German I, Buchanan DD, Kennedy RT. Anal. Chem. 1998;70:4540–4545. doi: 10.1021/ac980638h. [DOI] [PubMed] [Google Scholar]
- 15.Cho EJ, Collett JR, Szafranska AE, Ellington AD. Anal. Chim. Acta. 2006;564:82–90. doi: 10.1016/j.aca.2005.12.038. [DOI] [PubMed] [Google Scholar]
- 16.Siddiqui MAA, Keating GM. Drugs. 2005;65:1571–1577. doi: 10.2165/00003495-200565110-00010. [DOI] [PubMed] [Google Scholar]
- 17.Tuerk C, Gold L. Science. 1990;249:505–510. doi: 10.1126/science.2200121. [DOI] [PubMed] [Google Scholar]
- 18.Ellington AD, Szostak JW. Nature. 1990;346:818–822. doi: 10.1038/346818a0. [DOI] [PubMed] [Google Scholar]
- 19.Mannironi C, DiNardo A, Fruscoloni P, TocchiniValentini GP. Biochemistry. 1997;36:9726–9734. doi: 10.1021/bi9700633. [DOI] [PubMed] [Google Scholar]
- 20.Hesselberth JR, Miller D, Robertus J, Ellington AD. J. Biol. Chem. 2000;275:4937–4942. doi: 10.1074/jbc.275.7.4937. [DOI] [PubMed] [Google Scholar]
- 21.Mendonsa SD, Bowser MT. J. Am. Chem. Soc. 2004;126:20–21. doi: 10.1021/ja037832s. [DOI] [PubMed] [Google Scholar]
- 22.Mendonsa SD, Bowser MT. Anal. Chem. 2004;76:5387–5392. doi: 10.1021/ac049857v. [DOI] [PubMed] [Google Scholar]
- 23.Mosing RK, Mendonsa SD, Bowser MT. Anal. Chem. 2005;77:6107–6112. doi: 10.1021/ac050836q. [DOI] [PubMed] [Google Scholar]
- 24.Berezovski M, Drabovich A, Krylova SM, Musheev M, Okhonin V, Petrov A, Krylov SN. J. Am. Chem. Soc. 2005;127:3165–3171. doi: 10.1021/ja042394q. [DOI] [PubMed] [Google Scholar]
- 25.Drabovich A, Berezovski M, Krylov SN. J. Am. Chem. Soc. 2005;127:11224–11225. doi: 10.1021/ja0530016. [DOI] [PubMed] [Google Scholar]
- 26.Mallikaratchy P, Stahelin RV, Cao Z, Cho WH, Tan W. Chem. Commun. 2006:3229–3231. doi: 10.1039/b604778e. [DOI] [PubMed] [Google Scholar]
- 27.Mendonsa SD, Bowser MT. J. Am. Chem. Soc. 2005;127:9382–9383. doi: 10.1021/ja052406n. [DOI] [PubMed] [Google Scholar]
- 28.Bowser MT. Analyst. 2005;130:128–130. doi: 10.1039/b412492h. [DOI] [PubMed] [Google Scholar]
- 29.Cochran AG, Schultz PG. Science. 1990;249:781–783. doi: 10.1126/science.2389144. [DOI] [PubMed] [Google Scholar]
- 30.Conn MM, Prudent JR, Schultz PG. J. Am. Chem. Soc. 1996;118:7012–7013. [Google Scholar]
- 31.Kawazoe N, Teramoto N, Ichinari H, Imanishi Y, Ito Y. Biomacromolecules. 2001;2:681–686. doi: 10.1021/bm000148a. [DOI] [PubMed] [Google Scholar]
- 32.Li Y, Geyer CR, Sen D. Biochemistry. 1996;35:6911–6922. doi: 10.1021/bi960038h. [DOI] [PubMed] [Google Scholar]
- 33.Li Y, Sen D. Nat. Struct. Biol. 1996;3:743–747. doi: 10.1038/nsb0996-743. [DOI] [PubMed] [Google Scholar]
- 34.Li Y, Sen D. Biochemistry. 1997;36:5589–5599. doi: 10.1021/bi962694n. [DOI] [PubMed] [Google Scholar]
- 35.Oh SS, Plakos K, Lou X, Xiao Y, Soh HT. Proc. Natl. Acad. Sci. U.S.A. 2010;107:14053–14058. doi: 10.1073/pnas.1009172107. [DOI] [PMC free article] [PubMed] [Google Scholar]
- 36.Arthanari H, Basu S, Kawano TL, Bolton PH. Nucleic Acids Res. 1998;26:3724–3728. doi: 10.1093/nar/26.16.3724. [DOI] [PMC free article] [PubMed] [Google Scholar]
- 37.Falk JE. Porphyrins and metalloporphyrins: their general, physical and coordination chemistry, and laboratory methods. New York: Elsevier; 1964. [Google Scholar]
- 38.Hu D, Huang ZZ, Pu F, Ren JS, Qu XG. Chem. Eur. J. 2011;17:1635–1641. doi: 10.1002/chem.201001331. [DOI] [PubMed] [Google Scholar]
- 39.Wilson DS, Szostak JW. Annu. Rev. Biochem. 1999;68:611–647. doi: 10.1146/annurev.biochem.68.1.611. [DOI] [PubMed] [Google Scholar]
- 40.Ren J, Chaires JB. Biochemistry. 1999;38:16067–16075. doi: 10.1021/bi992070s. [DOI] [PubMed] [Google Scholar]
- 41.Sugimoto N, Toda T, Ohmichi T. Chem. Commun. 1998:1533–1534. [Google Scholar]
Associated Data
This section collects any data citations, data availability statements, or supplementary materials included in this article.


