

Abstract
We combined the high MR signal enhancement achieved using dissolution dynamic nuclear polarization (DNP) with a pulsed gradient double spin echo diffusion MR sequence to rapidly and accurately measure the diffusion coefficients of various hyperpolarized 13C molecules in solution. Furthermore, with a diffusion-weighted imaging sequence we generate diffusion coefficient maps of multiple hyperpolarized metabolites simultaneously. While hyperpolarized experiments can measure rapid, non-equilibrium processes by avoiding signal averaging, continuous signal loss due to longitudinal relaxation (T1) complicates quantitation. By correcting for this signal loss, we demonstrate the feasibility of using hyperpolarized 13C diffusion weighted MR to accurately measure real-time (seconds) molecular transport phenomena. Potential applications include rapidly measuring molecular binding, cellular membrane transport, in vivo metabolite distribution and establishing a magnetic field independent hyperpolarized parameter.
Diffusion MR has a variety of applications in solution, and is central to modern biomedical imaging. Many variations of the pulsed gradient spin echo experiment originally developed by Stejskal and Tanner1 have been used to measure diffusion coefficients2, compartment size3, as well as molecular transport4 and molecular exchange5. Diffusion measurements often suffer from low sensitivity and require time-intensive signal averaging to obtain a sufficient signal to noise ratio (SNR) for reliable measurements. Long experimental times also require samples to be at steady state, since any signal perturbations other than molecular motion can skew measured diffusion constants. Since sensitivity has traditionally been limiting for diffusion MR experiments, 1H has been used more frequently than other spin-1/2 nuclei (e.g, 13C, 15N, 31P) that have low gyromagnetic ratios and natural abundance. Hyperpolarized gasses, most notably 3He and 129Xe, circumvent this low signal problem and allow for rapid diffusion measurements6,7. Unfortunately, these inert gasses are not typically involved in chemical reactions or metabolic pathways of interest.
In this paper, we combine diffusion MR with dissolution dynamic nuclear polarization (DNP)8 hyperpolarized 13C and thereby lay the foundation for making real-time, non-equilibrium diffusion measurements. The signal gain provided by hyperpolarization and the chemical shift sensitivity of 13C will allow for diffusion studies to be carried-out on the time scale of chemical reactions9 or metabolic processes10. Since both diffusion MR and hyperpolarized experiments are characterized by a time-decay constant, the experimental setup for diffusion measurements of hyperpolarized molecules must allow for the quantitative separation of these two factors.
Dissolution DNP is typically used to polarize 13C nuclei with long spin-lattice (T1) relaxation times (tens of seconds) and, upon dissolution, a solution of hyperpolarized spins is obtained. A conventional NMR spectrum of this solution can exhibit a signal enhancement of greater than 10,000-fold8 when compared to a spectrum of a similar solution at its thermal equilibrium polarization in a typical magnetic field of an NMR at ambient temperature. Hyperpolarized [1-13C] pyruvate has been used most extensively to study various cancers by monitoring [1-13C] lactate generation11,12. Additionally, numerous other molecules have also been polarized to monitor other reactions and metabolic processes13,14,15,16, either as single agents or in combination17. The challenge in combining hyperpolarization with diffusion MR lies in the non-renewable nature of the hyperpolarized spin state and its fast decay, where small imperfections in data acquisition can lead to large NMR signal modulations and thereby increase diffusion measurement error. When correctly implemented, the merging of these two techniques will provide significant advances in numerous fields, including molecular biding, cellular transport studies and in vivo diffusion weighted MRI.
To perform diffusion MR of hyperpolarized 13C molecules, we used a pulsed gradient double spin echo sequence (Fig. 1a). The 10° excitation pulse allows for continuous sampling of the non-renewable hyperpolarized signal and enables precise quantitation. The pair of adiabatic 180° refocusing pulses are evenly spaced within the sequence’s echo time (TE), the time from the excitation pulse to maximum signal at the echo. Given the high SNR typical of hyperpolarized experiments, no signal averaging was necessary.
Fig. 1.

(a) The pulsed gradient double spin echo pulse sequence used for hyperpolarized diffusion experiments, with a 10° excitation pulse and adiabatic 180° pulses. (b) Representative spectra for which the apparent T1 (black) and hyperpolarized diffusion measurements (red) are interleaved. Correcting the hyperpolarized diffusion weighted spectra for the T1 enables an accurate calculation of diffusion coefficient for the hyperpolarized molecules.
All experiments were done on a Varian 600 MHz 1H/150 MHz 13C micro-imaging system at 27°C. For more detailed methods, see electronic supplementary information.
Hyperpolarized experiments consisted of interleaved acquisitions to measure both the hyperpolarized molecule’s apparent T1 and its diffusion coefficient. Diffusion acquisitions with increasing gradient strengths (Fig. 1b, red lines) were interspersed with T1 acquisitions with small crusher gradients (Fig. 1b, black lines). Diffusion coefficients were calculated by fitting the diffusion spectra with the following equation:
where D is the diffusion coefficient (mm2/s) and b, commonly referred to as the b-value, is the diffusion weighting defined by 2γ2G2δ2(Δ−δ/3). Gradient (G) durations (δ) were 5 ms, gradient separations (Δ) were 20 ms, and γ is the gyromagnetic ratio for 13C. The cosine term corrects the data for multiple excitations (n) of the hyperpolarized magnetization with a flip angle θ. Individual spectra are corrected for T1-dependent signal loss based on a per-time basis (t). Since the TE (50 ms) for all experiments was kept constant, any T2-weighting was a constant across all spectra and datasets and therefore was not needed to calculate the reported diffusion coefficients.
This approach for measuring diffusion coefficients relies on correcting for the effects of T1 relaxation since hyperpolarized experiments are characterized by a T1-dependant signal loss. While determining the T1 of a hyperpolarized molecule in solution is trivial, accurate T1 measurements become more difficult in complex environments, such as with molecular binding or in tissue.
The simulation presented in Fig. 2a illustrates the dependence of the calculated diffusion coefficient on both the apparent T1 of the hyperpolarized spin used to correct the dataset and the total diffusion measurement time required for the experiment. As the ratio of the total diffusion measurement time to the true relaxation time decreases (i.e., darker regions in Fig. 2a), the calculated diffusion coefficient becomes less sensitive to errors in the apparent T1 used to correct the hyperpolarized diffusion dataset. Since long T1 carbon species are typically used in hyperpolarized experiments (on the order of 30–60s), the diffusion measurement time can be significantly shorter than signal loss due to relaxation. The acquisition is also further accelerated due to the increased signal intensity afforded by hyperpolarization of the molecule of interest. Furthermore, while the decay nature of hyperpolarized signal complicates these experiments, within experimental tolerances, this can be addressed to generate reliable diffusion measurements.
Fig. 2.

(a) A simulation for hyperpolarized 13C urea shows how a short total diffusion measurement time relative to the T1 makes calculations of the diffusion coefficient less sensitive to the apparent T1 accuracy. The white line represents the (total diffusion measurement time)/true T1 ratio used in our hyperpolarized 13C urea experiments, where errors of up to 25% in apparent T1 only result in less than 5% errors in the diffusion coefficient. (b) Diffusion coefficients of 13C urea at 27°C, measured using thermal equilibrium polarization and hyperpolarization. b-value is a measure of the degree of diffusion weighting.
To confirm our ability to accurately measure the diffusion coefficient of a hyperpolarized molecule, we compared measurements of 13C urea both at its thermal equilibrium polarization and hyperpolarized, polarized to 8.4% ± 0.6. As seen in Fig. 2b the diffusion coefficients of thermally polarized and hyperpolarized 13C urea were 1.58×10⁻³ ± 0.04 and 1.54×10⁻³ ± 0.06 mm2/s, respectively, and not statistically different. In a similar fashion, we measured the diffusion coefficients of 13C pyruvate and 13C lactate (Table 1), polarized to 18.5% ± 0.7 and 2.9% ± 0.5, respectively.
Table 1.
Diffusion Coefficients (D) and relaxation times (T1) of hyperpolarized 13C molecules measured in aqueous solution.
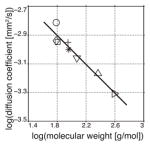
| Molecule | MW [g/mol] | T1 [s]a | D [10−3 mm2/s]b | Literature D [10−3 mm2/s]c | |
|---|---|---|---|---|---|
| 13C urea (○) | 61.05 | 35.3±2.6 | 1.54±0.06 | 1.4518 |
|
| [1-13C] acetate (⋄) | 61.04 | 46.2±0.7 | 1.15±0.03 | 1.1519 | |
| [1-13C,d3] acetate (□) | 64.04 | 49.9±1.7 | 1.13±0.02 | — | |
| [1-13C] pyruvate (+) | 89.05 | 43.8±3.3 | 1.12±0.04 | — | |
| [1-13C] lactate (✳) | 91.07 | 32.3±0.7 | 1.00±0.01 | 1.1220 | |
| N-[acetyl-1-13C] glycine (▽) | 118.10 | 16.9±0.8 | 0.87±0.07 | 1.11*,21 | |
| N-[acetyl-1-13C,d3] triglycine (△) | 232.20 | 9.9±0.7 | 0.68±0.04 | 0.70*,21 | |
| N-[acetyl-1-13C,d3] RGD (▷) | 391.37 | 5.4±0.8 | 0.49±0.03d | — |
T1 relaxation times are at 14.1 T/150 MHz for 13C.
Measurements at 27°C.
Literature references cite diffusion coefficients of either exactly the compound or a similar compound (marked with *), e.g., the diffusion coefficient for triglycine as compared to N-acetyl-triglycine. All literature values were adjusted for temperature using the Stokes-Einstein equation.
A 12 hr diffusion acquisition of thermally polarized N-acetyl-RGD (0.47×10⁻³ mm2/s) corresponds with this diffusion coefficient. Mean ± SD, n = 3.
We extended the technique developed here to measuring diffusion coefficients of larger molecules. Utilizing secondary hyperpolarization9, we generated hyperpolarized amino acids and peptides, achieving signal enhancements similar to those previously reported. The technique reacts hyperpolarized [1,1-13C] acetic anhydride (polarized to 2.4% ± 0.2) with nucleophilic amine termini. In this manner, we measured the diffusion coefficients of 13C acetate and 13C N-acetyl-glycine at 27°C in aqueous solution (Table 1). To lengthen the T1 of larger secondarily hyperpolarized peptides, we polarized perdeuterated [1,1-13C,d6] acetic anhydride (polarized to 2.9% ± 0.5), which avoids cross-relaxation between the carbonyl carbon and methyl protons. Reacting this with triglycine, we measured the diffusion coefficients of perdeuterated 13C acetate and 13C N-acetyl-triglycine (Table 1). Finally, we reacted the cell integrin adhesion peptide arginine-glycine-aspartic acid peptide (RGD) with perdueterated 13C acetic anhydride to measure the diffusion coefficient of 13C N-acetyl-RGD (Table 1). This experiment shows the feasibility of using hyperpolarized diffusion measurements to studying the translational motion and interaction of biologically relevant small peptides.
To demonstrate the feasibility of using diffusion MR of hyperpolarized metabolites in the clinical setting, we added a concentric echo planar imaging readout to the pulsed gradient double spin echo to generate diffusion coefficient maps (Fig. 3). Here, the diffusion coefficient maps of hyperpolarized 13C urea (1.55×10⁻³ ± 0.07 mm2/s), 13C pyruvate (1.12×10⁻³ ± 0.06 mm2/s) and 13C lactate (0.98×10⁻³ ± 0.04 mm2/s), measured simultaneously with frequency specific excitation pulses, match values acquired with hyperpolarized diffusion NMR.
Fig. 3.
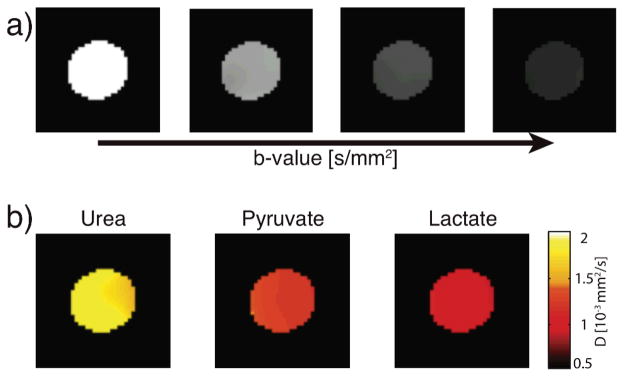
Diffusion weighted MRI of three hyperpolarized metabolites, acquired simultaneously. (a) Representative T1 corrected diffusion weighted images with increasing diffusion weighting (b-values 1.7, 173, 693 and 1560 s/mm2) used to simultaneously generate diffusion coefficient maps (b) of 13C urea, 13C pyruvate and 13C lactate.
Hyperpolarized diffusion NMR can allow for rapid measurements of real-time, non-equilibrium chemical process. For example, molecular binding can be measured using a pulsed gradient spin echo approach22. These experiments require time intensive signal averaging and today commonly utilize signal enhancement via the nuclear Overhauser effect (NOE)23. Conversely, hyperpolarized diffusion NMR would greatly reduce the measurement times of these experiments, would not be complicated by NOE polarization transfers24 when using 13C and would allow for the simultaneous observation of any changes in chemical shifts.
Like non-steady state chemical kinetics, assessment of metabolic flux requires rapid measurement, since metabolism occurs on the order of seconds. Closely associated with a metabolic pathway’s activity is the cellular membrane transport of these metabolites. Prior diffusion NMR studies took advantage of differences in metabolite diffusivity in the intra- and extracellular environments to measure intracellular metabolite concentrations25. This approach used diffusion NMR as a filter, but because of the need for signal averaging, it could solely measure steady state metabolites. The hyperpolarized diffusion NMR technique developed here can be extended for use as a diffusion filter to measure real-time membrane transport of various hyperpolarized metabolites. For example, the intra-versus extracellular localization of the hyperpolarized 13C lactate produced in cancer cells could help elucidate aggressiveness and metastatic potential26. Of course, hyperpolarized diffusion filters could be used to measure cellular transport from a variety of metabolites, especially when applying these studies to bioreactors27.
While diffusion-weighted MRI has become a standard clinical tool for assessing anatomy, combining it with hyperpolarized substrates has the potential to inform on metabolism localization in the cellular microenvironment. Larson et al. recently developed a super stimulated echo sequence to suppress vascular hyperpolarized 13C signal28. By only imaging hyperpolarized 13C lactate in the tissue, this technique improved the delineation of primary tumors in vivo. Extending this technique to create a diffusion filter could allow for measurement of both the generation of hyperpolarized metabolites and their tissue distribution, similar to how cell studies would elucidate membrane transport kinetics. Furthermore, hyperpolarized 13C diffusion MRI could measure apparent diffusion coefficient (ADC) maps for hyperpolarized metabolites. Noteworthy is that such ADC maps are magnetic field independent, a particular benefit since hyperpolarized 13C signal intensities change according to initial polarization levels and magnetic field dependent T1 relaxation.
In summary, we present the foundations for carrying out fast diffusion studies with dissolution DNP hyperpolarized 13C molecules. The SNR gain provided by hyperpolarization and the chemical shift sensitivity of 13C allows for diffusion studies to be carried-out on the time scale of chemical reactions or metabolic processes, where both products and reactants can be measured simultaneously. Our technique demonstrates how to robustly sample dynamic hyperpolarized magnetization in order to obtain quantitatively accurate diffusion measurements. Given this, hyperpolarized 13C diffusion MR has far reaching applicability in areas such as binding studies, metabolomics, clinical diagnoses and many more.
Acknowledgments
The authors would like to acknowledge the valuable advice of Mark Van Criekinge, M.S., and Subramaniam Sukumar, Ph.D., as well as support from National Institute of Health grants, K99 EB014328 (KRK), R00 EB012064 (PL), R01 CA166766 (DW) and P41 EB013598 (JK).
Footnotes
Electronic Supplementary Information (ESI) available: Experimental details, including acquisitions, sample preparations, polarization procedures and calculations. See DOI: 10.1039/b000000x/
Notes and references
- 1.Stejskal E, Tanner J. J Chem Phys. 1965;42:288. [Google Scholar]
- 2.Price WS, Ide H, Arata Y. J Phys Chem A. 1999;103:448–450. [Google Scholar]
- 3.Codd S, Callaghan P. J Magn Reson. 1999;137:358–372. doi: 10.1006/jmre.1998.1679. [DOI] [PubMed] [Google Scholar]
- 4.Benga G, Chapman BE, Gallagher CH, Cooper D, Kuchel PW. Comparative Biochemistry and Physiology Part A: Physiology. 1993;104:799–803. doi: 10.1016/0300-9629(93)90157-y. [DOI] [PubMed] [Google Scholar]
- 5.Price WS, Elwinger F, Vigouroux CC, Stilbs P. Magn Reson Chem. 2002;40:391–395. [Google Scholar]
- 6.Patyal BR, Gao JH, Williams RF, Roby J, Saam B, Rockwell BA, Thomas RJ, Stolarski DJ, Fox PT. J Magn Reson. 1997;126:58–65. doi: 10.1006/jmre.1997.1159. [DOI] [PubMed] [Google Scholar]
- 7.Chen XJ, Möller HE, Chawla MS, Cofer GP, Driehuys B, Hedlund LW, Johnson GA. Magn Reson Med. 1999;42:721–728. doi: 10.1002/(sici)1522-2594(199910)42:4<721::aid-mrm14>3.0.co;2-d. [DOI] [PubMed] [Google Scholar]
- 8.Ardenkjær-Larsen J, Fridlund B, Gram A, Hansson G, Hansson L, Lerche M, Servin R, Thaning M, Golman K. P Natl Acad Sci Usa. 2003;100:10158. doi: 10.1073/pnas.1733835100. [DOI] [PMC free article] [PubMed] [Google Scholar]
- 9.Wilson DM, Hurd RE, Keshari K, Van Criekinge M, Chen AP, Nelson SJ, Vigneron DB, Kurhanewicz J. P Natl Acad Sci Usa. 2009;106:5503–5507. doi: 10.1073/pnas.0810190106. [DOI] [PMC free article] [PubMed] [Google Scholar]
- 10.Golman K, int Zandt R, Thaning M. P Natl Acad Sci Usa. 2006;103:11270–11275. doi: 10.1073/pnas.0601319103. [DOI] [PMC free article] [PubMed] [Google Scholar]
- 11.Albers M, Bok R, Chen A, Cunningham C, Zierhut M, Zhang V, Kohler S, Tropp J, Hurd R, Yen Y. Cancer Research. 2008;68:8607. doi: 10.1158/0008-5472.CAN-08-0749. [DOI] [PMC free article] [PubMed] [Google Scholar]
- 12.Day S, Kettunen M, Gallagher F, Hu D, Lerche M, Wolber J, Golman K, Ardenkjaer-Larsen J, Brindle K. Nat Med. 2007;13:1382–1387. doi: 10.1038/nm1650. [DOI] [PubMed] [Google Scholar]
- 13.Keshari KR, Wilson DM, Chen AP, Bok R, Larson PEZ, Hu S, Van Criekinge M, Macdonald JM, Vigneron DB, Kurhanewicz J. J Am Chem Soc. 2009;131:17591–17596. doi: 10.1021/ja9049355. [DOI] [PMC free article] [PubMed] [Google Scholar]
- 14.Gabellieri C, Reynolds S, Lavie A, Payne G, Leach M, Eykyn T. J Am Chem Soc. 2008;130:4598–4599. doi: 10.1021/ja8001293. [DOI] [PubMed] [Google Scholar]
- 15.Witney TH, Kettunen MI, Hu D-E, Gallagher FA, Bohndiek SE, Napolitano R, Brindle KM. British Journal of Cancer. 2010;103:1400–1406. doi: 10.1038/sj.bjc.6605945. [DOI] [PMC free article] [PubMed] [Google Scholar]
- 16.Keshari KR, Kurhanewicz J, Bok R, Larson PEZ, Vigneron DB, Wilson DM. Proceedings of the National Academy of Sciences. 2011;108:18606–18611. doi: 10.1073/pnas.1106920108. [DOI] [PMC free article] [PubMed] [Google Scholar]
- 17.Wilson DM, Keshari KR, Larson PEZ, Chen AP, Hu S, Van Criekinge M, Bok R, Nelson SJ, Macdonald JM, Vigneron DB, Kurhanewicz J. J Magn Reson. 2010;205:141–147. doi: 10.1016/j.jmr.2010.04.012. [DOI] [PMC free article] [PubMed] [Google Scholar]
- 18.Gosting LJ, Akeley DF. J Am Chem Soc. 1952;74:2058–2060. [Google Scholar]
- 19.Kida J, Uedaira H. J Magn Reson. 1977;27:253–259. [Google Scholar]
- 20.Lundberg P, Kuchel PW. Magn Reson Med. 1997;37:44–52. doi: 10.1002/mrm.1910370108. [DOI] [PubMed] [Google Scholar]
- 21.Longsworth L. J Am Chem Soc. 1953;75:5705–5709. [Google Scholar]
- 22.Fielding L. Progress in Nuclear Magnetic Resonance Spectroscopy. 2007;51:219–242. [Google Scholar]
- 23.Chen A, Shapiro MJ. J Am Chem Soc. 1998;120:10258–10259. [Google Scholar]
- 24.Chen A, Shapiro M. J Am Chem Soc. 1999;121:5338–5339. [Google Scholar]
- 25.Van Zijl PC, Moonen CT, Faustino P, Pekar J, Kaplan O, Cohen JS. P Natl Acad Sci Usa. 1991;88:3228–3232. doi: 10.1073/pnas.88.8.3228. [DOI] [PMC free article] [PubMed] [Google Scholar]
- 26.Bhujwalla ZM, Artemov D, Ballesteros P, Cerdan S, Gillies RJ, Solaiyappan M. NMR in Biomedicine. 2002;15:114–119. doi: 10.1002/nbm.743. [DOI] [PubMed] [Google Scholar]
- 27.Keshari K, Kurhanewicz J, Jeffries R, Wilson D, Dewar B, Van Criekinge M, Zierhut M, Vigneron D, Macdonald J. Magn Reson Med. 2010;63:322–329. doi: 10.1002/mrm.22225. [DOI] [PMC free article] [PubMed] [Google Scholar]
- 28.Larson PEZ, Kerr AB, Reed GD, Hurd RE, Kurhanewicz J, Pauly JM, Vigneron DB. IEEE Trans Med Imaging. 31:265–275. doi: 10.1109/TMI.2011.2168235. [DOI] [PMC free article] [PubMed] [Google Scholar]