Abstract
Methylglyoxal, a reactive, toxic dicarbonyl, is generated by the spontaneous degradation of glycolytic intermediates. Methylglyoxal can form covalent adducts with cellular macromolecules, potentially disrupting cellular function. We performed experiments using the model organism Saccharomyces cerevisiae grown in media containing low, moderate, and high glucose concentrations to determine the relationship between glucose consumption and methylglyoxal metabolism. Normal growth experiments and glutathione depletion experiments showed that metabolism of methylglyoxal by log-phase yeast cultured aerobically occurred primarily through the glyoxalase pathway. Growth in high-glucose media resulted in increased generation of the methylglyoxal metabolite D-lactate and overall lower efficiency of glucose utilization as measured by growth rates. Cells grown in high-glucose media maintained higher glucose uptake flux than cells grown in moderate-glucose or low-glucose media. Computational modeling showed that increased glucose consumption may impair catabolism of triose phosphates as a result of an altered NAD+/NADH ratio.
Keywords: methylglyoxal, D-lactate, glycation, glycolysis, NAD+
INTRODUCTION
The dicarbonyl methylglyoxal is produced biologically primarily by the spontaneous degradation of the triose phosphate intermediates of glycolysis (Phillips and Thornalley, 1993). Approximately 0.1–0.3% of glycolytic flux has been estimated to result in methylglyoxal production in metabolically active Saccharomyces cerevisiae (Martins, et al., 2001a; Ponces Freire, et al., 2003). Methylglyoxal can react with cellular nucleophiles to form potentially harmful adducts (Dhar, et al., 2009; Gomes, et al., 2005; Oya, et al., 1999). The resulting adducts belong to a heterogeneous group of sugar-derived moieties known as advanced glycation end products (AGEs). Methylglyoxal-derived adducts include Nε-carboxyethyllysine, Lys-Lys dimer, and argpyrimidine (Mendez, et al., 2010; Thornalley, 2007; Yamagishi, 2008). Formation of AGE adducts on proteins may impair protein function.
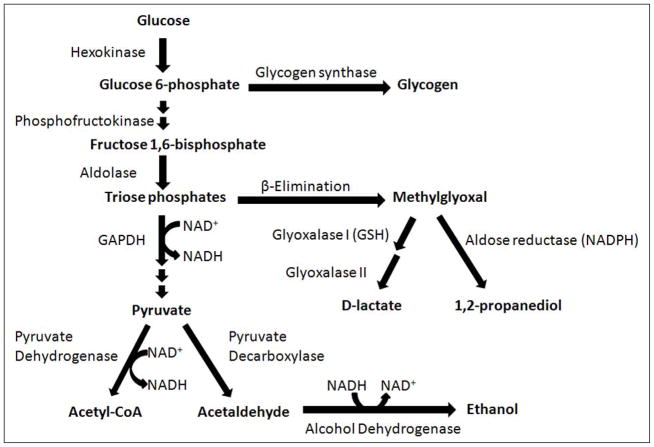
In S. cerevisiae, methylglyoxal is metabolized through the glutathione-dependent glyoxalase pathway and by the NADPH-dependent enzyme aldose reductases encoded by GRE3 and GRE2 (Aguilera and Prieto, 2001; Chen, et al., 2003; Inoue, et al., 2011; Vander Jagt, et al., 2001; Vander Jagt and Hunsaker, 2003). The glyoxalase pathway consists of the enzymes glyoxalase I and glyoxalase II. Glyoxalase I catalyzes the formation of S-D-lactoylglutathione from methylglyoxal and reduced glutathione (GSH), and glyoxalase II recycles GSH and releases D-lactate (Martins, et al., 2001a; Martins, et al., 2001b). D-lactate is a specific metabolite of methylglyoxal, and can be used as an indicator of methylglyoxal production over time because it accumulates at much higher levels than methylglyoxal (Paoli, et al., 2010; Talasniemi, et al., 2008). Aldose reductase encoded by GRE3 catalyzes the two-step reduction of methylglyoxal to 1,2-propanediol with acetol (hydroxyacetone) as an intermediate, while the aldose reductase encoded by GRE2 uses NADPH as an electron donor and metabolizes methylglyoxal to lactaldehyde (Chen, et al., 2003). Aldose reductase has been reported to reduce the aldehyde carbonyl of methylglyoxal when glutathione is present at high levels, while reducing the ketone carbonyl when glutathione is limiting (Vander Jagt, et al., 2001). Methylglyoxal can also be be metabolized by NADH-dependent alcohol dehydrogenase in yeast (Chen, et al., 2003). The relative contributions of the glyoxalase pathway and aldose reductase to methylglyoxal detoxification remain poorly characterized and likely vary depending on strains selected and growth conditions (Pallotta, 2012). Figure 1 provides an overview of the major metabolic pathways associated with methyglyoxal production and metabolism in S. cerevisiae as a consequence of glucose metabolism.
FIGURE 1.
Metabolic pathways associated with methylglyoxal production and detoxification as a result of glucose metabolism in S. cerevisiae. GAPDH, glyceraldehyde 3-phosphate dehydrogenase.
S. cerevisiae has been widely used as a model to study the biochemistry of methylglyoxal metabolism and AGE formation (Inoue, et al., 2011; Martins, et al., 2001a; Martins, et al., 2001b; Penninckx, et al., 1983; Ponces Freire, et al., 2003). As a Crabtree-positive yeast, S. cerevisiae can utilize respiro-fermentative metabolism when grown under aerobic conditions in the presence of glucose (Diaz-Ruiz, et al., 2011). Elevated glycolytic flux associated with the Crabtree effect is expected to increase cellular methyglyoxal formation. Despite its primary dependence on glycolysis in the presence of glucose, S. cerevisiae is remarkably resistant to damage by protein glycation (Ponces Freire, et al., 2003), i.e. under normal conditions the concentration of glycating agents such as methylglyoxal are tightly regulated. Using a combination of experimental and computational techniques, we sought to characterize the effects of media glucose concentration and intracellular GSH availability on methylglyoxal production and metabolism in yeast grown aerobically in media containing glucose as the sole carbon source.
MATERIALS AND METHODS
Yeast Growth Experiments
Saccharomyces cerevisiae strain S288C was obtained from the American Type Culture Collection (ATCC, Manassas, VA). Yeast was grown in SD minimal media (6.7 g yeast nitrogen base without amino acids per liter) containing 0.5%, 2%, or 5% glucose (27.8, 111, and 278 mM, respectively) at 30° C with shaking at 230 rpm in a Gyrotory Water Bath Shaker (New Brunswick Scientific). Cells were cultured in Corning 250 mL vented cap culture flasks. Cell density was measured as absorbance at 600 nm using a SpectraMax Plus 384 microplate spectrophotometer (Molecular Devices, Sunnyvale, CA). Cell numbers were calculated using a standard curve generated to correlate OD600 with cell number obtained by counting serially diluted yeast cells on a hemocytometer. Cell suspensions were diluted in media as necessary to give absorbance values within the linear region of the standard curve. Cells were acclimatized by growth in the appropriate experimental media for at least 24 hours before metabolism experiments were started. Experiments were initiated by diluting acclimatized cells into fresh media and growing to log-phase. Log-phase cells were inoculated into fresh media for metabolism experiments. All experiments were performed in triplicate.
For 2% glucose and initial GSH depletion experiments, cells were grown aerobically in media containing 2% glucose, 2% glucose with 0.5 mM of the GSH-depleting agent diethyl maleate (DEM), or 2% glucose with 1 mM DEM. DEM was added as a stock solution in DMSO. As a vehicle control, 100 μL DMSO was added to the 2% glucose cell cultures. Immediately after cell inoculation and each hour thereafter, 6 mL cell culture was removed for analysis. Four mL of cell suspension was frozen in liquid nitrogen and stored at −80 °C for subsequent analysis. Two mL of the cell suspension was filtered, using 0.45 μm spin filters, and the culture media was collected for analysis. The cell pellets were collected by washing the filters in 2 mL sterile water. Collected cells were pelleted by centrifugation at 4500 rpm in a benchtop centrifuge. Pellets were washed twice with 2 mL sterile water, re-suspended in 1 mL sterile water and frozen in liquid nitrogen for storage at −80 °C.
For glucose consumption and total GSH depletion experiments, cells were acclimatized overnight in media containing 0.5% glucose, 5% glucose, or 2% glucose with 10 mM of the GSH synthesis inhibitor buthionine sulfoximine (BSO). For metabolism experiments, acclimatized cells were inoculated into the appropriate media type. For total GSH depletion, DEM was immediately added to a final concentration of 2 mM. One hundred μL DMSO was added as a vehicle control to the 0.5% and 5% glucose cultures. Culture media aliquots were collected and processed as described above immediately after inoculation and subsequently at 45 minute intervals for a period of 8 hours. A sampling interval of 45 minutes was selected for these experiments due to the rapid depletion of glucose from the 0.5% glucose media and the need for an adequate number of time points prior to glucose depletion in order to calculate accurate flux values.
Glucose and Metabolite Measurements
Media glucose was measured for each time point using a 4.6 × 150 mm Agilent Zorbax Carbohydrate Analysis column (Agilent, Technologies, Santa Clara, CA). HPLC separation and detection were performed using an Agilent 1100 instrument equipped with diode array and refractive index detectors. HPLC conditions were as follows: injection volume, 20 μL; flow rate, 1 mL/min; column thermostat, 30 °C; mobile phase A: water; mobile phase B: acetonitrile. Separations were performed with isocratic flow consisting of 25% mobile phase A and 75% mobile phase B with a run time of 15 minutes. Glucose was measured using a refractive index detector, and glucose standards were measured to generate standard curves for correlation of concentrations with peak areas. The concentrations of ethanol and glycerol were quantified by refractive index detection using a fermentation column (Aminex HPX-87H Column, BioRad) with isocratic flow using 1 mM sulfuric acid as the mobile phase. Analysis conditions were as follows: injection volume, 50 μL; flow rate, 0.6 mL/minute, column thermostat, 60 °C, analysis time of 15 min. Metabolites were identified by comparison of metabolite retention times with retention times of authentic standards, and metabolite concentrations were calculated using standard curves generated by measurement of the appropriate standards.
Methylglyoxal Measurement
Methylglyoxal was derivatized to 2-methylquinoxaline using a modification of the procedure of Wang et al. (Wang, et al., 2004). Briefly, equal volumes of cell suspension and 1 M perchloric acid were vortex mixed and incubated on ice for 10 minutes. Samples were centrifuged for 10 minutes at 14,000 rpm at 4° C. The supernatant was collected in clean tubes and 1 M ortho-phenylenediamine in 5 M perchloric acid was added to give a final concentration of 100 mM. Derivatization was allowed to proceed in the dark at room temperature for 24 hours. Derivatization reactions were extracted using C18 solid phase extraction (SPE) columns. HPLC Analysis was performed using the procedure of Dhar (Dhar, et al., 2009). HPLC conditions were as follows: Injection volume, 20 μL; flow rate: 1.00 mL/minute; isocratic elution with 20% acetonitrile and 80% water; detection at 315 nm; and column thermostat, 30 °C.
Acetol and 1,2-Propanediol Measurement
Media acetol was measured by derivatization with 2,4-dinitrophenylhydrazine and HPLC analysis as previously described by Cassaza (Casazza and Fu, 1985). Media 1,2-propanediol was derivatized with p-toluenesulfonyl isocyanate and measured by HPLC according to the method of Zhou (Zhou, et al., 2007).
Tietze Glutathione Assay
One hundred μL of 5% 5-sulfosalicylic acid (w/v in water) was added to 300 μL of cells resuspended in water. The mixture was vortex mixed for 30 seconds and incubated on ice for 10 minutes. The mixture was then clarified by centrifugation at 14,000 rpm for 10 minutes at 4° C. A reaction mix was made containing the following reagents: 6.14 mL NaH2PO4-EDTA Buffer, pH 7.5; 2.94 mL of 1 mM DTNB; 3.93 mL of 1 mM NADPH; and 20 Units of GSH reductase. To each well in a 96-well plate, 50 μL sample and 100 μL reaction mix were added with a multi-channel pipette. The plate was read immediately at 405 nm using kinetic read parameters for 5 minutes. GSH and GSSG standards were added to each plate to generate standard curves.
D-Lactate Microplate Assay
Media D-lactate was measured using a modification of the method of Talasniemi (Talasniemi, et al., 2008). Briefly, a reaction mix was made consisting of the following reagents: 10 mL of glycylglycine buffer, pH 10.0; 2 mL of 50 mM NAD+ in water, and 200 μL of glutamate-pyruvate transaminase (143 units/mL in 50 mM ammonium acetate; glutamate-pyruvate transaminase was added to remove pyruvate generated by metabolism of D-lactate by D-lactate dehydrogenase and thereby drive the assay reaction). To each well of a 96 well plate was added 100 μL cell culture media, D-lactate standard, or blank and 100 μL reaction mix followed by 10 μL of 94.4 U/mL D-lactate dehydrogenase. The reaction plate was incubated in a plate reader for 1 hour at 37° C with kinetic read at 340 nm with reads every 2 minutes.
Glyoxalase I and Aldose Reductase Activity Assays
Cells were grown in 0.5%, 2%, or 5% glucose SD media for 6 hours. Cells were permeabilized with digitonin to a final concentration of 0.05%, and assayed for enzymatic activity using the procedures reported for glyoxalase I (Ispolnov, et al., 2008) and aldose reductase (Gomes, et al., 2005). For glyoxalase I assays, 5 mM GSH was mixed with 2 mM methylglyoxal and incubated for 10 minutes at 30 °C to generate substrate. Formation of S-D-lactoylglutathione was measured at 240 nm for 4 minutes and metabolism rates were calculated using a molar extinction coefficient of 2930 M−1 cm−1. For aldose reductase activity assays, NADPH was added to the reaction mixture to a final concentration of 0.1 mM and methylglyoxal was added at concentration of 2 mM. Disappearance of NADPH was monitored at 340 nm for 2.5 minutes, and metabolism rates were calculated using a molar extinction coefficient of 6200 M−1 cm−1
Measurement of Yeast 14C-Methylglyoxal Incorporation by Accelerator Mass Spectrometry
Cells were grown in 2% glucose SD media until log phase was reached, at which time 50 μL of labeling solution was added to 50 mL of cell culture. Labeling solution consisted of 1 mM methylglyoxal (Sigma, St. Louis, MO) and 0.28 nCi (1.86 nM) [2-14C]-methylglyoxal (American Radiolabeled Chemicals, Inc., St. Louis, MO). Cell density was recorded immediately and each hour thereafter until 4 hours after addition of labeled methylglyoxal. Cell culture aliquots of 10 mL were removed at each time point and cells and media were separated as described above. Cell pellets and media were then frozen in liquid nitrogen and stored at −80 °C for subsequent analysis. Aliquots of cells and media were converted to graphite and analyzed by accelerator mass spectrometry as previously described (Henle, 2005; Stewart, et al., 2010). The 14C specific activity of the dosing solution was measured by liquid scintillation counting.
Flux calculations
Yeast doubling times were calculated using the equation:
Where Td = doubling time, Tf = final time, Ti = initial time, Df = final cell density, Di = initial cell density. Yeast specific growth rates were calculated using the equation:
Metabolite consumption and production fluxes were calculated using the equation described by Chen (Chen, et al., 2011). The general equation for flux calculations is:
Where μ = specific growth rate, Cf = final metabolite concentration, Ci = initial metabolite concentration, Df = final cell density, and Di = initial cell density. Fluxes were calculated as nmol metabolite/(million cells × hour).
Statistical Analysis
GraphPad Prism 5 software was used to generate graphs and perform 1-way ANOVAs with Tukey’s post test for comparison of all treatments (GraphPad Software, La Jolla, CA).
Computational Modeling
The full-scale model of glycolysis in S. cerevisiae (Hynne, et al., 2001) was downloaded in SBML format (Finney and Hucka, 2003; Hucka, et al., 2003) from the JWS online- model database (Olivier and Snoep, 2004). The model of glycolysis was augmented using the MathSBML program (version 2.7.0) package (Shapiro, et al., 2004) for Mathematica (version 7.0, Wolfram Research Inc. Champaign, IL, 2007) to include the pathways for metabolism of methylglyoxal as implemented by Gomes et al. (Gomes, et al., 2005). The latter model was modified to account for the transient changes in the concentrations of NAD+ and NADH. For modified models simulating metabolic changes associated with the Crabtree effect, the adjustment in activities of glycolytic enzymes were effected via varying the V values.
RESULTS AND DISCUSSION
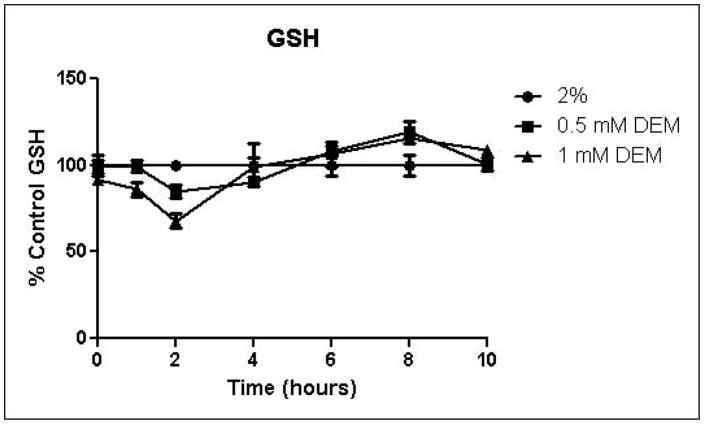
Because the enzyme glyoxalase I is dependent on GSH for detoxification of methylglyoxal, depletion of GSH by DEM would be expected to impair metabolism of methylglyoxal through the glyoxalase pathway. By eliminating one possible detoxification pathway, GSH depletion should increase the contribution of other possible methylglyoxal detoxification pathways. To determine the effects of GSH depletion on methylglyoxal detoxification, yeast cultures were grown in minimal medium containing 2% glucose and 2% glucose with 0.5 mM or 1 mM DEM. Cell growth curves are shown in Figure 2A. Cell treatment with DEM resulted in maximal GSH depletion at 2 hours, followed by rapid recovery of GSH concentrations. GSH was depleted by 15% by 0.5 mM DEM and 32% of control cell GSH in cells treated with 1 mM DEM. Relative GSH levels for the duration of the experiment are shown in Figure 2D (Control mean = 71 pmol/million cells, control standard deviation = 14).
FIGURE 2.
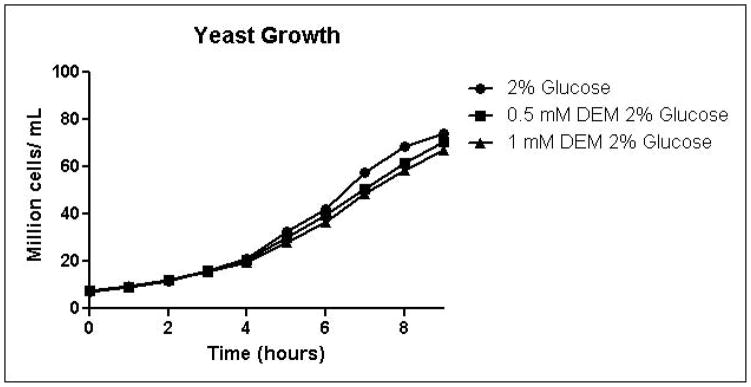
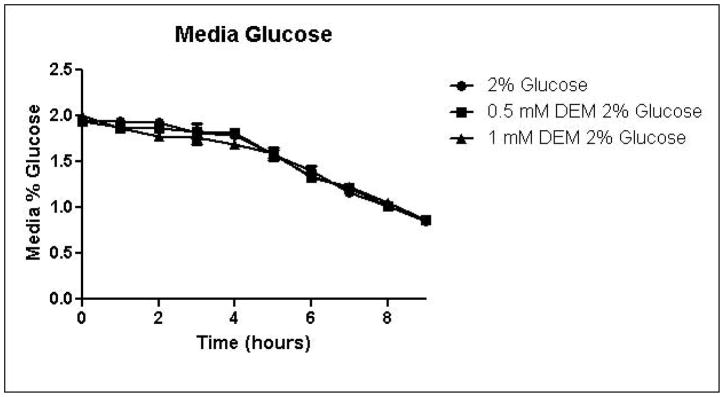
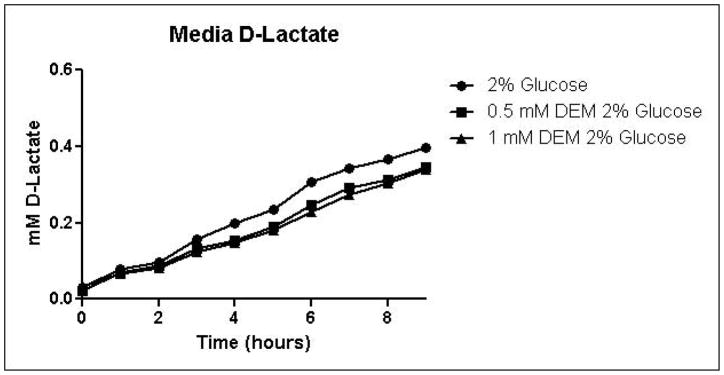
A. Growth curves for yeast grown in minimal media containing 2% glucose, 2% glucose with 0.5 mM DEM, or 2% glucose with 1 mM DEM. B. Media glucose depletion over time. C. Media D-lactate accumulation over time as a consequence of methylglyoxal detoxification via the glyoxalase pathway. D. Glutathione levels over time, expressed as percent control. Mean values for three independent experiments are plotted for each time point with error bars showing standard error of the mean.
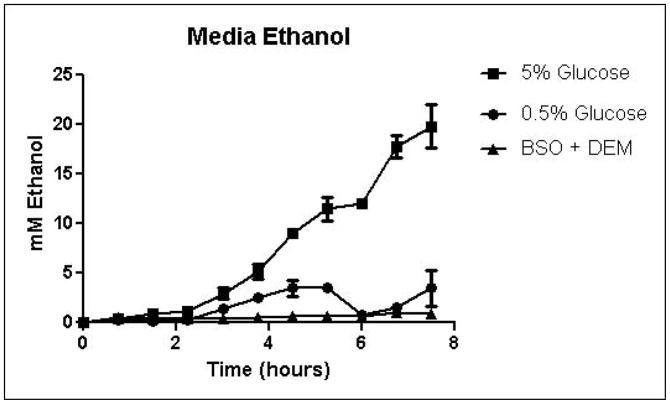
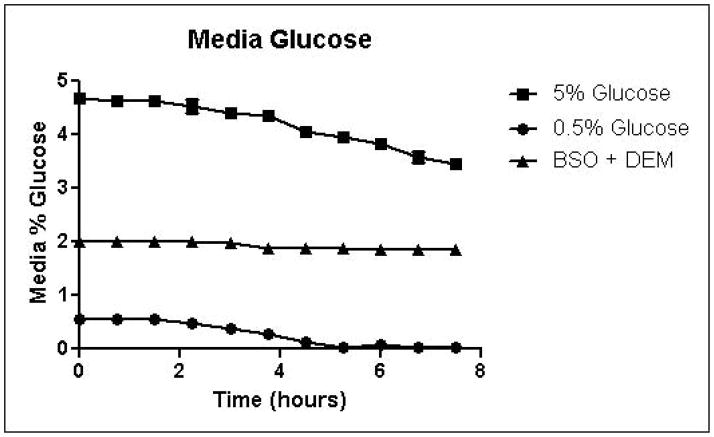
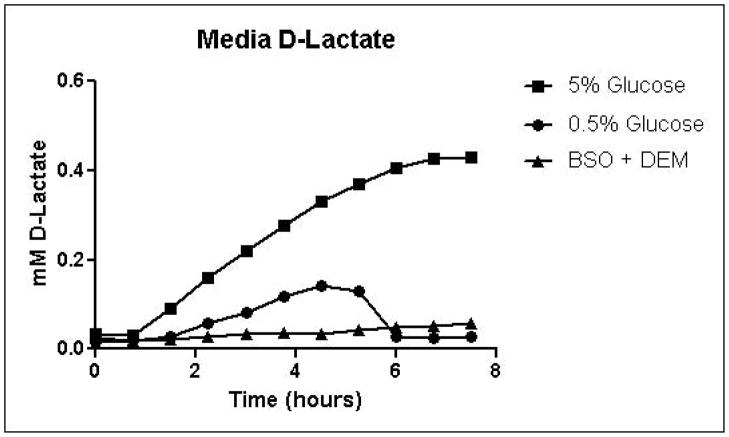
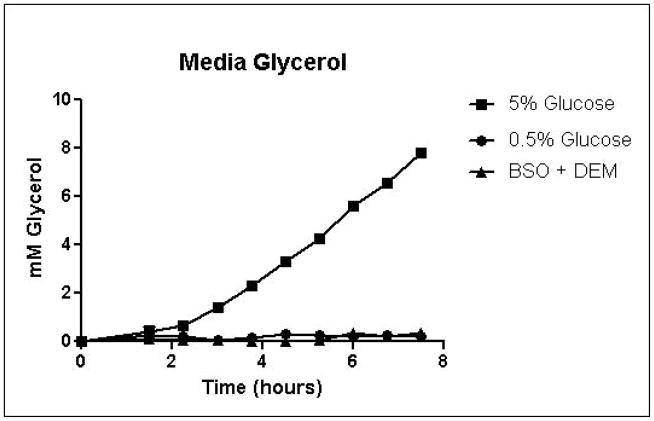
Cells were grown in SD minimal medium containing 0.5% or 5% glucose to characterize the effects of media glucose concentration on methylglyoxal metabolism. Experiments were also performed to determine the effect of total GSH depletion on methylglyoxal metabolism. Growth curves for yeast grown in 0.5% and 5% glucose were comparable until 5.25 hours, when glucose was depleted in the 0.5% glucose cultures (Figure 3A). Cells treated with 1 mM DEM and 10 mM BSO showed extreme impairment of growth (Figure 3A), but remained viable and recovered to normal growth rates after approximately 24 hours (data not shown). Media glucose measurements showed that cells grown in 0.5% glucose SD media consumed all available glucose by 5.25 hours. Total glucose consumption by 5.25 hours was approximately 20% higher for cells grown in 5% glucose than for cells grown in 0.5% glucose (Figure 3B). GSH-depleted cells showed minimal glucose consumption beginning around 4 hours (Figure 3B). Cells grown in 5% glucose SD media produced 2.4-fold more D-lactate by 4.5 hours than cells grown in 0.5% glucose media (Figure 3C). Mitochondrial metabolism of D-lactate has been reported (Pallotta, 2012), but is unlikely to contribute to depletion of accumulating D-lactate while glucose is present based on the observation that in all experiments D-lactate continued to accumulate in media of cells grown in the presence of glucose until media glucose was depleted. When glucose was depleted from the media, cells then utilized D-lactate as a carbon source (Figure 3C). In cells treated with both BSO and DEM, no GSH could be detected (data not shown), but GSH-depleted cells produced small quantities of D-lactate as glucose was metabolized (Figure 3C). Cells grown in 5% glucose produced significantly more ethanol (Figure 3D) than cells grown in 0.5% glucose, a result indicative of the Crabtree effect. Glycerol production was also elevated in cells grown in 5% glucose (Figure 3E), suggesting an altered redox state compared to cells grown in 0.5% glucose.
FIGURE 3.
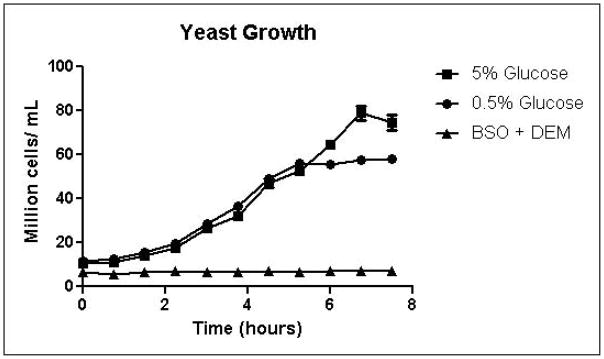
A. Growth curves for yeast grown in minimal media containing 5% glucose, 0.5% glucose, or 2% glucose with 10 mM BSO and 2 mM DEM. B. Media glucose depletion over time. C. Media D-lactate accumulation over time as a consequence of methylglyoxal detoxification via the glyoxalase pathway. D. Media accumulation of ethanol over time. E. Media accumulation of glycerol. Mean values for three independent experiments are plotted for each time point with error bars showing standard error of the mean.
Specific growth rates, glucose consumption fluxes, production fluxes for D-lactate, ethanol, and glycerol are shown in Table 1. Calculation of specific growth rates and metabolic fluxes allows comparison of experiments performed on different days. Varying media glucose concentration did not significantly affect specific growth rates, but glutathione depletion impaired growth in a concentration-dependent manner. Specific growth rates were reduced by approximately 12.5% for 0.5 mM and 1 mM DEM cultures compared to 2% glucose cultures, while the specific growth rate for total GSH depleted cultures was approximately 3% of the rate of the 2% glucose cultures. Glucose consumption fluxes were positively correlated with media glucose concentration. Glucose fluxes in cells grown in 0.5% glucose were approximately 20% lower than fluxes in cells grown in the presence of 2% glucose. Glucose consumption fluxes in cells grown in 2% and 5% glucose were similar. D-lactate production fluxes increased with increasing media glucose concentrations. Mild GSH depletion with 0.5 or 1 mM DEM produced modest reductions D-lactate flux, while total GSH depletion with BSO and DEM reduced D-lactate flux by nearly 50% compared to cells cultured in 2% glucose SD media. Ethanol and glycerol production fluxes were elevated nearly 5-fold in cells grown in 5% glucose compared to cells grown in 0.5% glucose. Increased ethanol production is indicative of respiro-fermentative metabolism (Postma, et al., 1989). Glycerol production flux was approximately 10-fold higher in yeast cultured with 5% glucose compared to cells grown in 0.5% glucose (Table 1). Increased glycerol production from dihydroxyacetone phosphate in yeast has been reported as a mechanism for regeneration of NAD+ through the activity of glycerol-3-phosphate dehydrogenase under metabolic conditions that deplete NAD+, such as ethanol stress (Vriesekoop, et al., 2009). Thus, the dramatic increases in glycerol and ethanol production in cells grown in 5% glucose are indicative of an altered intracellular redox state.
TABLE 1.
Specific growth rates and metabolic fluxes. Specific growth rates have units of hours−1. Metabolite fluxes are calculates as nanomoles metabolite per million cells per hour. Mean and standard deviation (SD) of three independent experiments are shown. ND, flux not determined.
| Specific Growth Rate | Glucose Flux | D-Lactate Flux | Ethanol Flux | Glycerol Flux | ||||||
|---|---|---|---|---|---|---|---|---|---|---|
| Growth Condition | mean | SD | mean | SD | mean | SD | mean | SD | mean | SD |
| 0.5% Glucose | 0.32 | 0.002 | 214.48 | 7.48 | 1.14 | 0.01 | 17.03 | 2.29 | 3.06 | 0.23 |
| 2% Glucose | 0.32 | 0.009 | 268.53 | 17.42 | 1.52 | 0.09 | ND | ND | ND | ND |
| 5% Glucose | 0.3 | 0.007 | 287.49 | 18.32 | 1.92 | 0.09 | 84.4 | 11.21 | 31.69 | 1.61 |
| 0.5 mM DEM | 0.28 | 0.002 | 270.01 | 4.54 | 1.31 | 0.06 | ND | ND | ND | ND |
| 1 mM DEM | 0.28 | 0.002 | 286.76 | 27.21 | 1.35 | 0.05 | ND | ND | ND | ND |
| BSO + DEM | 0.01 | 0.005 | 246.07 | 76.71 | 0.85 | 0.11 | 13.68 | 1.15 | 4.75 | 4.43 |
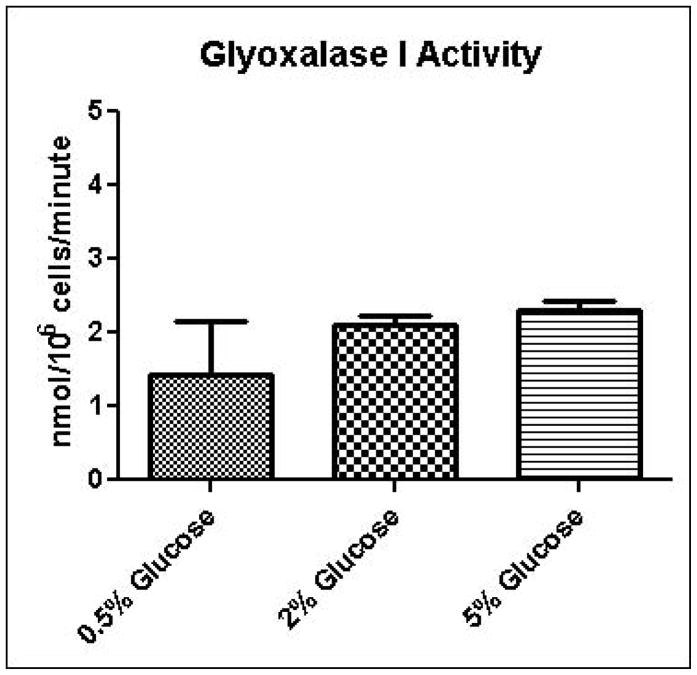
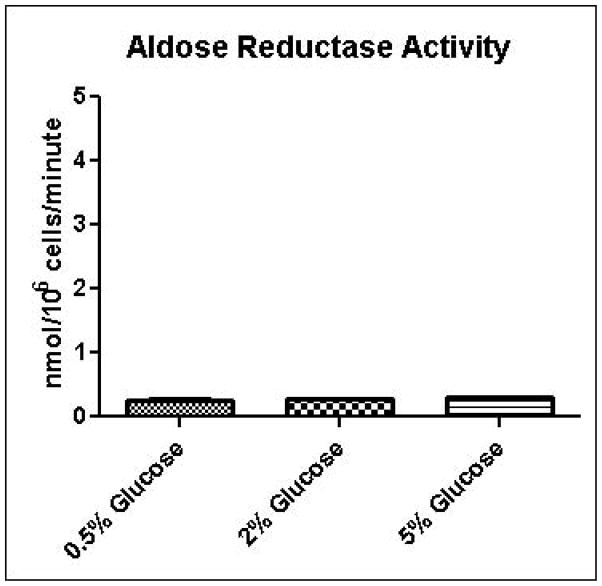
Experimental results provide evidence that methylglyoxal is formed and subsequently metabolized to D-lactate by the glyoxalase pathway at a higher rate in yeast grown in high glucose media compared to yeast grown in low glucose media (Table 1). Increased media glucose concentrations correlated with increased glucose consumption rates, but not increased cell growth rates (Table 1). In order to gain added insights into metabolic changes that could account for experimental measurements, we coupled a full-scale kinetic model of glycolysis in S. cerevisiae (Hynne, et al., 2001) that includes the major pathways for non-oxidative regeneration of NAD+ to a model of methylglyoxal metabolism (Gomes, et al., 2005). The latter model assumes that the concentrations of GSH and NADPH are tightly regulated and constant. We instituted the model with these same assumptions; however we augmented the model to account for transient rates of methylglyoxal production depending on concentrations of triose-phosphates. The unified model was used to examine in low and high media glucose concentrations: a) if the observed metabolic behavior can be simulated using only one set of kinetic parameters (i.e. without any changes in the activities of glycolytic enzymes); b) the rate and pathways of methyglyoxal formation and degradation; c) the redox states of the cells; and d) the efficiency of carbon usage. To assist modeling of methylglyoxal metabolism, the activities of glyoxalase I and aldose reductase for metabolism of methylglyoxal were measured in cells grown in 0.5%, 2%, or 5% glucose and permeabilized with 0.05% digitonin. As shown in Figures 4A and 4B, the measured activity of glyoxalase I was approximately 10-fold higher in all samples than the activity of aldose reductase, and no significant differences were observed in metabolic rates among growth conditions. This observation of the relative activities of glyoxalase I and aldose reductase is in contrast to results of sensitivity analysis experiments using gene knockouts reported by Gomes, in which aldose reductase was expected to contribute to 40% of methylglyoxal metabolism (Gomes, et al., 2005). This discrepancy may be due to differences in growth conditions used for the respective experiments.
FIGURE 4.
A. Glyoxalase I activity assay for determination of methylglyoxal metabolism in permeabilized cells grown in 0.5%, 2%, or 5% glucose SD media. B. Aldose reductase activity assay for determination of methylglyoxal metabolism in permeabilized cells grown in 0.5%, 2%, or 5% glucose SD media.
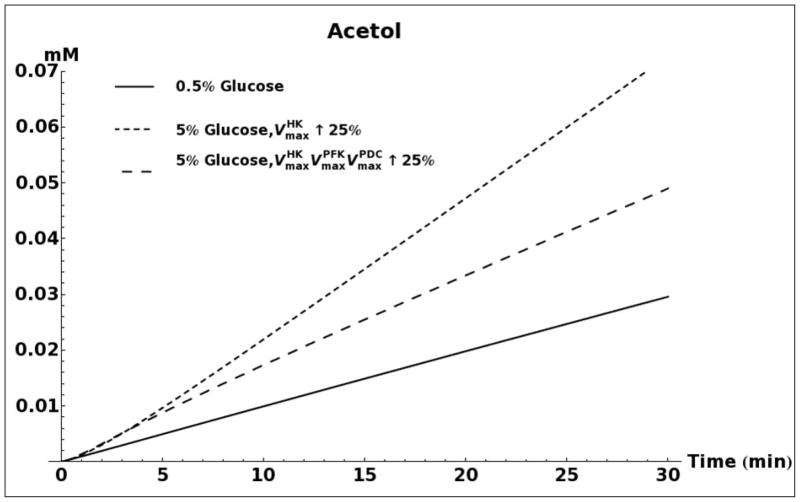
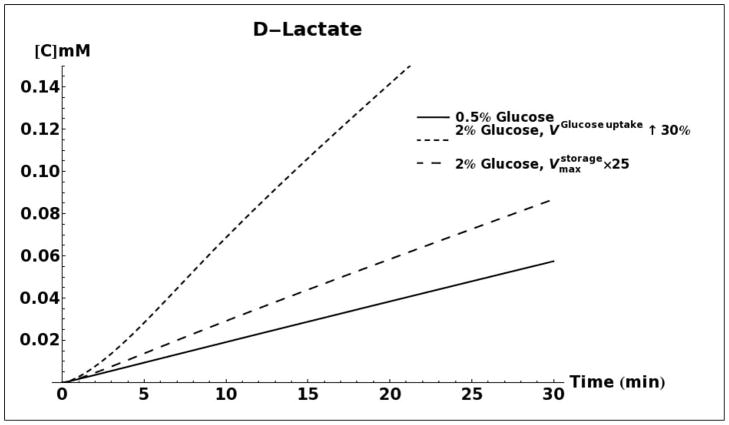
D-lactate production as a result of methylglyoxal metabolism through the glyoxalase system was modeled for 0.5%, 2% and 5% glucose media conditions (Figure 5A). When using the same set of kinetic parameters as reported by Hynne (Hynne, et al., 2001) for all three conditions, the model does not predict any difference in the rate of D-lactate production. However, increasing the activity of hexokinase enzyme (HK), as has been observed for conditions of glucose-induced repression of oxidative metabolism in yeast (Diaz-Ruiz, et al., 2011), leads to increased production of methylglyoxal and D-lactate. An increase in activity of phosphofructokinase (PFK), either alone or in tandem with an increase in activity of HK does not significantly alter the rate of D-lactate production (results not shown). It has been shown that onset of the Crabtree effect in yeasts also leads to overexpression and increased activity of the enzyme pyruvate decarboxylase (PDC) (Diaz-Ruiz, et al., 2011). As can be seen in Figure 5A, elevated activity of this enzyme leads to a decrease in production of D-lactate. We attribute this decrease to an increase in rate of NAD+ regeneration that would increase the flux through the glyceraldehyde 3-phosphate dehydrogenase enzyme and siphon triose phosphates away from the pathway of methyglyoxal formation (Figure 1).
FIGURE 5.
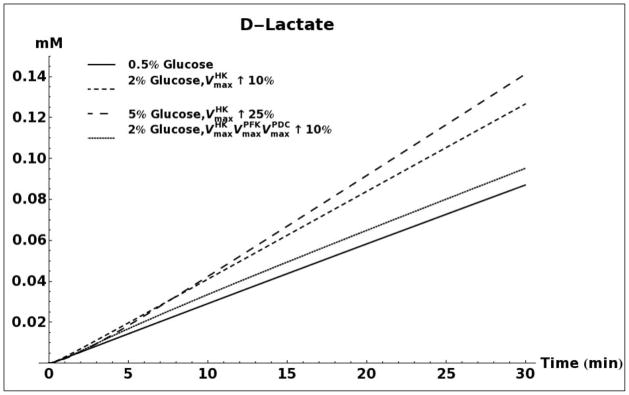
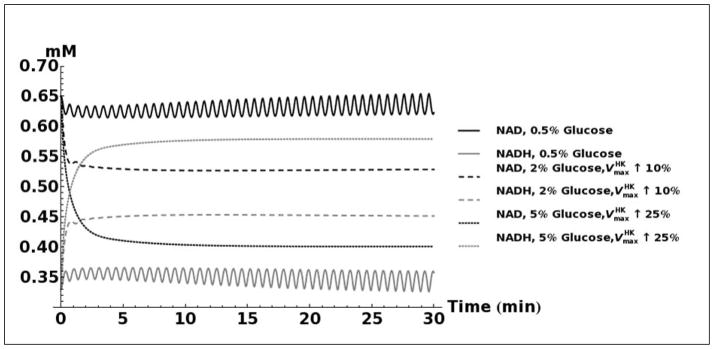
A. Kinetic model simulation of D-lactate production based on different media glucose concentrations and increases in the activities of glycolytic enzymes. B. Model simulation of acetol production when assuming that the enzyme aldose reductase is active with reported kinetic characteristics (Gomes, et al., 2005). C. Model simulation of cytosolic NAD+ and NADH concentrations as a consequence of elevated glucose consumption rates. D. Model predicted rate of D-lactate production with and without increased rate of carbon storage.
Figure 5B shows the predicted media accumulation of acetol/1,2-propanediol assuming that aldose reductase is active with the kinetic characteristics that were reported by Gomes (Gomes, et al., 2005). The model predicts that for such a case, a measurable quantity of 1,2-propanediol should be present in the medium. However, due to the absence of measurable 1,2-propanediol accumulation in all experiments, and the low measured activity of aldose reductase, the activity of this enzyme was removed from subsequent kinetic models.
Modeling the transient changes in the concentrations of NAD+ and NADH as a result of cellular glucose consumption indicates that the NAD+/NADH ratio is decreased in cells grown in high glucose media (Figure 5C). Due to sample preparation methods used, it was not possible to measure NAD+ and NADH in these experiments, but our previous experiments under similar conditions have shown that cells grown in 2% glucose do indeed have a lower NAD+/NADH ratio than cells grown in 0.5% glucose (Sporty, et al., 2009; Sporty, et al., 2008). Our simulations also show that the majority of the additionally imported glucose may be shunted toward production of glycogen. If nearly all of the imported glucose is converted into triose-phosphates, then based on reported kinetic characteristics of the methylglyoxal pathway (Gomes, et al., 2005) it would be expected that the rate of production D-lactate would be substantially higher than the quantity actually measured (Figure 5D). Increased glycogen production may therefore explain the observed levels of D-lactate.
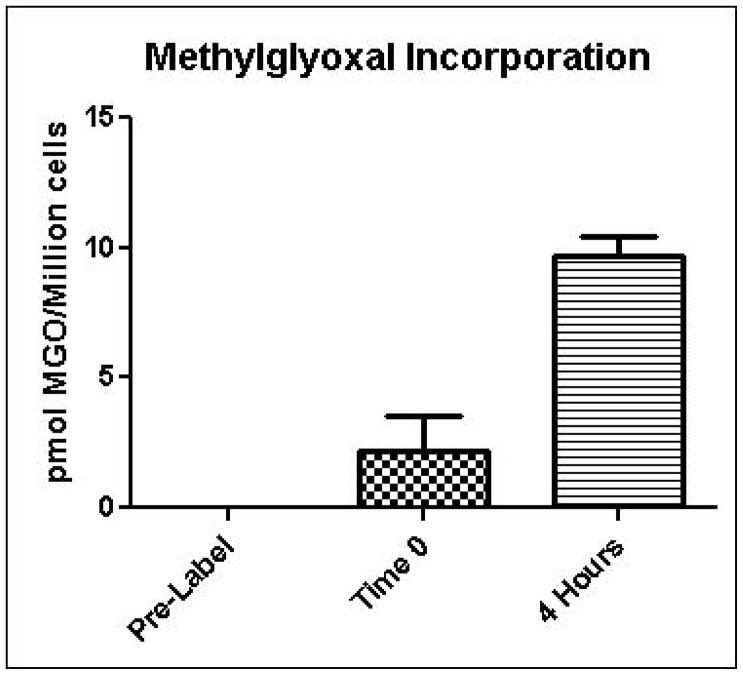
Glycation of cellular macromolecules by methylglyoxal is the primary process by which methylglyoxal ultimately exerts adverse effects on cells. Therefore, increased methylglyoxal production in cells is expected to have little effect on cellular physiology unless increased glycation also occurs. In order to estimate the rate of protein glycation by methylglyoxal in intact yeast, a microtracer experiment was performed in which cells were grown in the presence of 14C-labeled methylglyoxal. Unlabeled methylglyoxal was added to ensure that the fate of the 14C label was representative of total methylglyoxal. Figure 6 shows that approximately 0.04% of the administered 14C methylglyoxal was incorporated into cells after a 4 hour exposure period. These results suggest that cellular detoxification systems are normally very effective in preventing glycation of cellular macromolecules by methylglyoxal.
FIGURE 6.
Incorporation of 14C-methylglyoxal into yeast as an indication of protein glycation. Values are reported as picomoles of methylglyoxal incorporated per million cells. Mean values for three independent experiments are plotted for each time point with error bars showing standard error of the mean.
CONCLUSIONS
We demonstrated that glucose availability directly affects glucose consumption and production of the methylglyoxal metabolite D-lactate in the yeast S. cerevisiae. Measurement of methylglyoxal formation in living organisms is difficult due to the chemical reactivity of methylglyoxal and the presence of multiple, incompletely characterized metabolic pathways capable of methylglyoxal detoxification. While use of D-lactate as a surrogate for methylglyoxal is likely to underestimate actual methylglyoxal generation, experimental evidence in this work and elsewhere (Lu, et al., 2011; Paoli, et al., 2010; Talasniemi, et al., 2008) suggest that accumulation of D-lactate is useful for a first approximation of in vivo methylglyoxal production. We performed computational modeling using experimental data to identify potential mechanisms for apparent increased methyglyoxal formation in cells cultured in high-glucose media (Figure 5). Modeling showed that increased methylglyoxal formation rates were likely due to an increase in the activity of enzymes for the first (energy-consuming) phase of glycolysis coupled with a decrease in the cellular NAD+/NADH ratio. Increased formation of methylglyoxal results from an increase in the spontaneous degradation of higher levels of triose phosphates, which in turn may be caused by decreased availability of cytosolic NAD+ for use as a cofactor by glyceraldehyde-3-phosphate dehydrogenase (see Figure 1). This is in agreement with previous reports that increased media glucose availability decreases the cytosolic NAD+/NADH ratio in S. cerevisiae grown under aerobic conditions (Sporty, et al., 2009; Sporty, et al., 2008). Taken as a whole, our results suggest that increased glucose uptake by cells grown in a glucose-rich environment results in a decreased NAD+/NADH ratio, causing impaired catabolism of triose phosphates and increased generation of methylglyoxal with subsequent metabolism to D-lactate.
Acknowledgments
This work was performed under the auspices of the U.S. Department of Energy by Lawrence Livermore National Laboratory under Contract DE-AC52-07NA27344 with funding from National Institutes of Health, National Center for Research Resources, Biomedical Technology Program grant #P41 RR13461 and LLNL LDRD 09-ERI-002. LLNL Release Number: LLNL-JRNL-528472.
References
- Aguilera J, Prieto JA. The Saccharomyces cerevisiae aldose reductase is implied in the metabolism of methylglyoxal in response to stress conditions. Curr Genet. 2001;39:273–83. doi: 10.1007/s002940100213. [DOI] [PubMed] [Google Scholar]
- Casazza JP, Fu JL. Measurement of acetol in serum. Anal Biochem. 1985;148:344–8. doi: 10.1016/0003-2697(85)90238-6. [DOI] [PubMed] [Google Scholar]
- Chen CN, Porubleva L, Shearer G, Svrakic M, Holden LG, Dover JL, Johnston M, Chitnis PR, Kohl DH. Associating protein activities with their genes: rapid identification of a gene encoding a methylglyoxal reductase in the yeast Saccharomyces cerevisiae. Yeast. 2003;20:545–54. doi: 10.1002/yea.979. [DOI] [PubMed] [Google Scholar]
- Chen X, Alonso AP, Allen DK, Reed JL, Shachar-Hill Y. Synergy between (13)C-metabolic flux analysis and flux balance analysis for understanding metabolic adaptation to anaerobiosis in E. coli. Metab Eng. 2011;13:38–48. doi: 10.1016/j.ymben.2010.11.004. [DOI] [PubMed] [Google Scholar]
- Dhar A, Desai K, Liu J, Wu L. Methylglyoxal, protein binding and biological samples: are we getting the true measure? J Chromatogr B Analyt Technol Biomed Life Sci. 2009;877:1093–100. doi: 10.1016/j.jchromb.2009.02.055. [DOI] [PubMed] [Google Scholar]
- Diaz-Ruiz R, Rigoulet M, Devin A. The Warburg and Crabtree effects: On the origin of cancer cell energy metabolism and of yeast glucose repression. Biochim Biophys Acta. 2011;1807:568–76. doi: 10.1016/j.bbabio.2010.08.010. [DOI] [PubMed] [Google Scholar]
- Finney A, Hucka M. Systems biology markup language: Level 2 and beyond. Biochem Soc Trans. 2003;31:1472–3. doi: 10.1042/bst0311472. [DOI] [PubMed] [Google Scholar]
- Gomes RA, Sousa Silva M, Vicente Miranda H, Ferreira AE, Cordeiro CA, Freire AP. Protein glycation in Saccharomyces cerevisiae. Argpyrimidine formation and methylglyoxal catabolism. FEBS J. 2005;272:4521–31. doi: 10.1111/j.1742-4658.2005.04872.x. [DOI] [PubMed] [Google Scholar]
- Henle T. Protein-bound advanced glycation endproducts (AGEs) as bioactive amino acid derivatives in foods. Amino Acids. 2005;29:313–22. doi: 10.1007/s00726-005-0200-2. [DOI] [PubMed] [Google Scholar]
- Hucka M, Finney A, Sauro HM, Bolouri H, Doyle JC, Kitano H, Arkin AP, Bornstein BJ, Bray D, Cornish-Bowden A, Cuellar AA, Dronov S, Gilles ED, Ginkel M, Gor V, Goryanin II, Hedley WJ, Hodgman TC, Hofmeyr JH, Hunter PJ, Juty NS, Kasberger JL, Kremling A, Kummer U, Le Novere N, Loew LM, Lucio D, Mendes P, Minch E, Mjolsness ED, Nakayama Y, Nelson MR, Nielsen PF, Sakurada T, Schaff JC, Shapiro BE, Shimizu TS, Spence HD, Stelling J, Takahashi K, Tomita M, Wagner J, Wang J. The systems biology markup language (SBML): a medium for representation and exchange of biochemical network models. Bioinformatics. 2003;19:524–31. doi: 10.1093/bioinformatics/btg015. [DOI] [PubMed] [Google Scholar]
- Hynne F, Dano S, Sorensen PG. Full-scale model of glycolysis in Saccharomyces cerevisiae. Biophys Chem. 2001;94:121–63. doi: 10.1016/s0301-4622(01)00229-0. [DOI] [PubMed] [Google Scholar]
- Inoue Y, Maeta K, Nomura W. Glyoxalase system in yeasts: structure, function, and physiology. Semin Cell Dev Biol. 2011;22:278–84. doi: 10.1016/j.semcdb.2011.02.002. [DOI] [PubMed] [Google Scholar]
- Ispolnov K, Gomes RA, Silva MS, Freire AP. Extracellular methylglyoxal toxicity in Saccharomyces cerevisiae: role of glucose and phosphate ions. J Appl Microbiol. 2008;104:1092–102. doi: 10.1111/j.1365-2672.2007.03641.x. [DOI] [PubMed] [Google Scholar]
- Lu J, Zello GA, Randell E, Adeli K, Krahn J, Meng QH. Closing the anion gap: contribution of D-lactate to diabetic ketoacidosis. Clin Chim Acta. 2011;412:286–91. doi: 10.1016/j.cca.2010.10.020. [DOI] [PubMed] [Google Scholar]
- Martins AM, Cordeiro CA, Ponces Freire AM. In situ analysis of methylglyoxal metabolism in Saccharomyces cerevisiae. FEBS Lett. 2001a;499:41–4. doi: 10.1016/s0014-5793(01)02519-4. [DOI] [PubMed] [Google Scholar]
- Martins AM, Mendes P, Cordeiro C, Freire AP. In situ kinetic analysis of glyoxalase I and glyoxalase II in Saccharomyces cerevisiae. Eur J Biochem. 2001b;268:3930–6. doi: 10.1046/j.1432-1327.2001.02304.x. [DOI] [PubMed] [Google Scholar]
- Mendez JD, Xie J, Aguilar-Hernandez M, Mendez-Valenzuela V. Molecular susceptibility to glycation and its implication in diabetes mellitus and related diseases. Mol Cell Biochem. 2010;344:185–93. doi: 10.1007/s11010-010-0541-3. [DOI] [PubMed] [Google Scholar]
- Olivier BG, Snoep JL. Web-based kinetic modelling using JWS Online. Bioinformatics. 2004;20:2143–4. doi: 10.1093/bioinformatics/bth200. [DOI] [PubMed] [Google Scholar]
- Oya T, Hattori N, Mizuno Y, Miyata S, Maeda S, Osawa T, Uchida K. Methylglyoxal modification of protein. Chemical and immunochemical characterization of methylglyoxal-arginine adducts. J Biol Chem. 1999;274:18492–502. doi: 10.1074/jbc.274.26.18492. [DOI] [PubMed] [Google Scholar]
- Pallotta ML. Mitochondrial involvement to methylglyoxal detoxification: D: -Lactate/Malate antiporter in Saccharomyces cerevisiae. Antonie Van Leeuwenhoek; 2012. [DOI] [PubMed] [Google Scholar]
- Paoli T, Faulkner J, O’Kennedy R, Keshavarz-Moore E. A study of D-lactate and extracellular methylglyoxal production in lactate re-utilizing CHO cultures. Biotechnol Bioeng. 2010;107:182–9. doi: 10.1002/bit.22757. [DOI] [PubMed] [Google Scholar]
- Penninckx MJ, Jaspers CJ, Legrain MJ. The glutathione-dependent glyoxalase pathway in the yeast Saccharomyces cerevisiae. J Biol Chem. 1983;258:6030–6. [PubMed] [Google Scholar]
- Phillips SA, Thornalley PJ. The formation of methylglyoxal from triose phosphates. Investigation using a specific assay for methylglyoxal. Eur J Biochem. 1993;212:101–5. doi: 10.1111/j.1432-1033.1993.tb17638.x. [DOI] [PubMed] [Google Scholar]
- Ponces Freire A, Ferreira A, Gomes R, Cordeiro C. Anti-glycation defences in yeast. Biochem Soc Trans. 2003;31:1409–12. doi: 10.1042/bst0311409. [DOI] [PubMed] [Google Scholar]
- Postma E, Verduyn C, Scheffers WA, Van Dijken JP. Enzymic analysis of the crabtree effect in glucose-limited chemostat cultures of Saccharomyces cerevisiae. Appl Environ Microbiol. 1989;55:468–77. doi: 10.1128/aem.55.2.468-477.1989. [DOI] [PMC free article] [PubMed] [Google Scholar]
- Shapiro BE, Hucka M, Finney A, Doyle J. MathSBML: a package for manipulating SBML-based biological models. Bioinformatics. 2004;20:2829–31. doi: 10.1093/bioinformatics/bth271. [DOI] [PMC free article] [PubMed] [Google Scholar]
- Sporty J, Lin SJ, Kato M, Ognibene T, Stewart B, Turteltaub K, Bench G. Quantitation of NAD+ biosynthesis from the salvage pathway in Saccharomyces cerevisiae. Yeast. 2009;26:363–9. doi: 10.1002/yea.1671. [DOI] [PMC free article] [PubMed] [Google Scholar]
- Sporty JL, Kabir MM, Turteltaub KW, Ognibene T, Lin SJ, Bench G. Single sample extraction protocol for the quantification of NAD and NADH redox states in Saccharomyces cerevisiae. J Sep Sci. 2008;31:3202–11. doi: 10.1002/jssc.200800238. [DOI] [PMC free article] [PubMed] [Google Scholar]
- Stewart BJ, Navid A, Turteltaub KW, Bench G. Yeast dynamic metabolic flux measurement in nutrient-rich media by HPLC and accelerator mass spectrometry. Anal Chem. 2010;82:9812–7. doi: 10.1021/ac102065f. [DOI] [PMC free article] [PubMed] [Google Scholar]
- Talasniemi JP, Pennanen S, Savolainen H, Niskanen L, Liesivuori J. Analytical investigation: assay of D-lactate in diabetic plasma and urine. Clin Biochem. 2008;41:1099–103. doi: 10.1016/j.clinbiochem.2008.06.011. [DOI] [PubMed] [Google Scholar]
- Thornalley PJ. Dietary AGEs and ALEs and risk to human health by their interaction with the receptor for advanced glycation endproducts (RAGE)--an introduction. Mol Nutr Food Res. 2007;51:1107–10. doi: 10.1002/mnfr.200700017. [DOI] [PubMed] [Google Scholar]
- Vander Jagt DL, Hassebrook RK, Hunsaker LA, Brown WM, Royer RE. Metabolism of the 2-oxoaldehyde methylglyoxal by aldose reductase and by glyoxalase-I: roles for glutathione in both enzymes and implications for diabetic complications. Chem Biol Interact. 2001;130–132:549–62. doi: 10.1016/s0009-2797(00)00298-2. [DOI] [PubMed] [Google Scholar]
- Vander Jagt DL, Hunsaker LA. Methylglyoxal metabolism and diabetic complications: roles of aldose reductase, glyoxalase-I, betaine aldehyde dehydrogenase and 2-oxoaldehyde dehydrogenase. Chem Biol Interact. 2003;143–144:341–51. doi: 10.1016/s0009-2797(02)00212-0. [DOI] [PubMed] [Google Scholar]
- Vriesekoop F, Haass C, Pamment NB. The role of acetaldehyde and glycerol in the adaptation to ethanol stress of Saccharomyces cerevisiae and other yeasts. FEMS Yeast Res. 2009;9:365–71. doi: 10.1111/j.1567-1364.2009.00492.x. [DOI] [PubMed] [Google Scholar]
- Wang X, Desai K, Clausen JT, Wu L. Increased methylglyoxal and advanced glycation end products in kidney from spontaneously hypertensive rats. Kidney Int. 2004;66:2315–21. doi: 10.1111/j.1523-1755.2004.66034.x. [DOI] [PubMed] [Google Scholar]
- Yamagishi S. Advanced glycation end products (AGEs) and their receptor (RAGE) in health and disease. Curr Pharm Des. 2008;14:939. doi: 10.2174/138161208784139756. [DOI] [PubMed] [Google Scholar]
- Zhou T, Zhang H, Duan G. Simultaneous determination of diethyleneglycol and propylene glycol in pharmaceutical products by HPLC after precolumn derivatization with p-toluenesulfonyl isocyanate. J Sep Sci. 2007;30:2620–7. doi: 10.1002/jssc.200700097. [DOI] [PubMed] [Google Scholar]


