

Abstract
Simultaneously combining the complementary assets of EEG, functional MRI (fMRI), and transcranial magnetic stimulation (TMS) within one experimental session provides synergetic results, offering insights into brain function that go beyond the scope of each method when used in isolation. The steady increase of concurrent EEG-fMRI, TMS-EEG, and TMS-fMRI studies further underlines the added value of such multimodal imaging approaches. Whereas concurrent EEG-fMRI enables monitoring of brain-wide network dynamics with high temporal and spatial resolution, the combination with TMS provides insights in causal interactions within these networks. Thus the simultaneous use of all three methods would allow studying fast, spatially accurate, and distributed causal interactions in the perturbed system and its functional relevance for intact behavior. Concurrent EEG-fMRI, TMS-EEG, and TMS-fMRI experiments are already technically challenging, and the three-way combination of TMS-EEG-fMRI might yield additional difficulties in terms of hardware strain or signal quality. The present study explored the feasibility of concurrent TMS-EEG-fMRI studies by performing safety and quality assurance tests based on phantom and human data combining existing commercially available hardware. Results revealed that combined TMS-EEG-fMRI measurements were technically feasible, safe in terms of induced temperature changes, allowed functional MRI acquisition with comparable image quality as during concurrent EEG-fMRI or TMS-fMRI, and provided artifact-free EEG before and from 300 ms after TMS pulse application. Based on these empirical findings, we discuss the conceptual benefits of this novel complementary approach to investigate the working human brain and list a number of precautions and caveats to be heeded when setting up such multimodal imaging facilities with current hardware.
Keywords: TMS, EEG, fMRI, multimodal neuroimaging
the empirical study of the human brain has seen an unparalleled advance in recent decades. Using brain imaging methods such as functional magnetic resonance (MR) imaging (fMRI) and EEG, we can now noninvasively investigate the working human brain in a wide variety of experimental conditions. Because of their different advantages, drawbacks, and applications, EEG and fMRI are in many aspects complementary in the study of human neurocognition.
fMRI measures vascular responses, most often using the blood oxygenation level-dependent (BOLD) signal, which has a relatively low temporal resolution in the order of seconds. Conversely, fMRI has a spatial resolution in the order of cubic millimeters and offers whole-brain coverage. In contrast, due to volume conductance and the inverse problem, EEG has low spatial resolution (in the order of centimeters) and spatial uncertainties. EEG mainly reflects activity on the surface of the brain and is not sensitive to some aspects of neuronal activity and certain populations. For example, some interneuron types (e.g., stellate cells) and many subcortical structures have a closed field structure in which electrical currents cancel each other out (Nunez and Srinivasan 2005). However, because neuronal activity is picked up with millisecond resolution, EEG can be used to map out exactly how brain activity changes over time in response to an event (event-related potential; ERP). In addition, advances in signal analysis methods have widely expanded the range of neural population behavior that can be evaluated with EEG, including frequency analyses from low- to very-high-frequency bands (Freyer et al. 2009), evaluation of power and phase of oscillations within or across regions, or the coupling of oscillatory behavior across frequency bands.
Considering these complementary assets, it seems valuable to combine fMRI and EEG. At the most basic level, the same question can be addressed in separate fMRI and EEG experiments, using the same paradigm, stimuli, and subjects. However, subjects will be in different environments and mental states in the two experiments, and many tasks include time-dependent effects, e.g., learning and adaptation. In contrast, simultaneous fMRI-EEG measurement data will reflect the exact same stimulation and cognitive/behavioral performance, which allows for an active integration of the two data sets. For example, changes in frequency-specific oscillatory power over time can be transformed into a predictor for the fMRI data set, allowing one to correlate directly the BOLD signal in each region to the changes in brain oscillations (Scheeringa et al. 2009).
Although invaluable, fMRI and EEG merely correlate brain operations to mental/behavioral processes. Brain interference techniques, such as transcranial magnetic stimulation (TMS), can manipulate brain activity as an independent variable, transiently inducing “virtual lesions,” enhancing or decreasing cortical excitability, stimulating neural populations, or even inducing local oscillations. Unfortunately, TMS is principally a black-box method if used in isolation: without concurrent imaging, its neural effects and their extent remain unknown. Recent TMS studies indicate that focal TMS does not exclusively affect neural activity directly under the stimulation coil but extends its neural consequences to remote and interconnected brain regions (Bestmann et al. 2003a; Blankenburg et al. 2008; Bohning et al. 2000; Denslow et al. 2005; Rushworth et al. 2002; Sack et al. 2007; Taylor et al. 2007), both cortical and subcortical as shown in the earliest applications of simultaneous TMS-fMRI (Baudewig et al. 2001; Bestmann et al. 2004). This is not surprising considering that a TMS pulse basically stimulates a neuron population and thus effectively inserts energy into a brain system, which might propagate throughout the anatomic (Boorman et al. 2007) and functional (Sack 2006) network. By using concurrent brain imaging, this spread of activity can be tracked, and thus connectivity measured, in corticocortical and corticosubcortical networks.
These remote effects of TMS in the BOLD signal can even depend on the task the subject is performing (Sack et al. 2007). For example, in a previous TMS-fMRI study from our group, the behavioral impairment of a focal TMS-induced neural disruption was found to be paralleled and caused by specific neural activity changes within remote brain regions that are part of a functional network subserving successful behavior (Sack et al. 2007). These results highlight the potential of concurrent functional imaging and magnetic brain stimulation not only to reveal a causal relationship between one specific brain area and a particular cognitive function, but also to identify directly a whole network of functionally related and behaviorally relevant brain areas [see also Bestmann et al. 2008b; Blankenburg et al. 2008; Ruff et al. 2008; see Ruff et al. (2009) for review].
Similar to the above-mentioned TMS-fMRI studies, there are a score of questions about human brain functioning that can be addressed using EEG imaging as dependent variable and TMS pulses as “system probes” (e.g., Ilmoniemi et al. 1997). Next to the impact of TMS on stimulus-evoked ERP components, its influence on neural oscillation patterns has been increasingly studied. In an interesting application, Massimini et al. (2005) probed brain connectivity in awake vs. sleeping human subjects using simultaneous TMS-EEG. Rosanova and colleagues (2009) explored the “natural frequencies” of different areas in the human brain by probing them with TMS pulses and evaluating the frequency bands in the EEG signal in which these pulses reverberated. Considering the crucial role that oscillatory behavior (Buzsáki 2006) and cross-frequency coupling (Jensen and Colgin 2007) play in large-scale integration and communication, the combined use of TMS-EEG is likely to be of great value for the mapping of brain connectivity.
In sum, concurrently combining EEG-fMRI is thus a powerful approach to study brain network dynamics with both high spatial and temporal resolution (Debener et al. 2006), whereas combining fMRI or EEG with TMS provides information on causal dependencies within these networks (for a recent review on multimodal TMS, see Reithler et al. 2011). Indeed, all these pairwise combinations have provided useful results (see, for example, Laufs et al. 2008; Ruff et al. 2009; Thut and Miniussi 2009 for reviews). It follows that the simultaneous use of all three methods would allow studying fast and brain-wide interactions in the perturbed system. The unique capacity of such a three-way method combination lies in the ability to monitor causal changes in spatiotemporal neural network dynamics at the single-trial level, which is particularly useful in designs with large trial variations (due to, e.g., brain state or learning effects) and are therefore not repeatable across measurement sessions. However, despite these prospective gains, to date, this full multimethod integration has not been demonstrated due to the technical challenges associated with it. This is not surprising, given the technological prowess that was required to implement all three pairwise combinations successfully in the past. It therefore was a challenging question whether the three-way combination of TMS-EEG-fMRI would yield additional problems or constraints. Difficulties might include superadditive hardware strain, signal quality deterioration, and/or subject discomfort.
In the present study, we for the first time tested the feasibility of simultaneous TMS-EEG-fMRI measurements using current commercially available hardware components. We report the results from various safety and quality assurance tests, performed on both a phantom and human volunteers. The gist of our findings is that concurrent TMS-EEG-fMRI measurements are safe (as indexed by continuous temperature monitoring) and feasible in terms of subject comfort and signal quality (while noting the limitation that with the currently available hardware used here, EEG signals could be compromised up to 300 ms post-TMS).
MATERIALS AND METHODS
The feasibility of simultaneously combining TMS, EEG, and fMRI in the same experimental session was studied by performing quality assurance measurements on a phantom as well as by collecting data from human subjects. The latter measurements included two different experimental paradigms: probing the excitability of the cerebral motor network during resting state via TMS to the premotor cortex as well as parietal TMS during an active auditory oddball detection task. Finally, to assess the effect of the MR environment on the TMS-induced EEG response, we performed a control study in which the same active auditory oddball detection paradigm was employed in a simultaneous TMS-EEG setup outside the scanner.
Experimental Setup
Phantom (f)MRI.
All initial quality assurance tests were performed on a spherical phantom [no. 47 62 311; Siemens, Erlangen, Germany; diameter = 170 mm, content: 2,572 ml of 1.25 g of nickel sulfate (NiSO4·6H2O) per 1,000 g of distilled water solution]. Images were acquired on a 3-T, head-only Magnetom Allegra MR scanner (Siemens) using a standard birdcage coil (USA Instruments, Aurora, OH; for applied image acquisition sequences, see below and see Table 1).
Table 1.
Overview of the used magnetic resonance sequences constituting the test battery for quality assurance testing
| Sequence no. | Name | TR, ms | TE, ms | FA | Bandwidth, Hz/Px | Voxel Size, mm3 | No. Slices | Slice Orientation | Scan Time, min:s | Remarks |
|---|---|---|---|---|---|---|---|---|---|---|
| 1 | RF field | 300 | 17 | 720° | 130 | 1.2×1.2×5 | 1 | Sagittal* | 1:19 | Spin echo |
| 2 | Signal-to-noise ratio | 1,000 | 3.6 | 15° | 260 | 1×1×5 | 12 | Sagittal* | 4:16 | Gradient echo |
| 2.5-mm Gap between slices | ||||||||||
| 3 | RF noise spikes | 24 | 1 | NA | 130 | 2×2×10 | 1 | Sagittal* | 0:06 | |
| 4 | RF noise† | 1,400 | 1 | NA | 39 | 0.4×0.4×1 | 50 | Transverse | 5:58 | |
| 5 | Weisskoff (1996) EPI | 2,000 | 30 | 90° | 2,112 | 3.5×3.5×3.5 | 25 | Transverse | 10:44 | Temporal stability estimation |
| 6 | Field map | 704 | 5.11 7.57 | 60° | 260 | 3.5×3.5×3.5 | 21 | Transverse | 1:33 | B0 inhomogeneity estimation Magnitude and phase images |
| 7 | EPI with reference amplitude set to “0 V” | 2,250 | 30 | 78° | 2,112 | 3.5×3.5×3.5 | 21 | Transverse | 1:53 | 50% Phase oversampling‡ 750-ms Gap between consecutive volumes |
| 8 | “Paradigm” EPI§ | 2,250 | 30 | 78° | 2,112 | 3.5×3.5×3.5 | 21 | Transverse | 1:53 | 50% Phase oversampling‡ 750-ms Gap |
| TMS pulses were applied in TMS+EEG setupa Reference amplitude: 104.4 V | ||||||||||
| 9 | MPRAGE | 2,250 | 2.6 | 9° | 200 | 1×1×1 | 192 | Sagittal | 8:26 | T1-weighted anatomic image |
Sagittal slice in line with main horizontal axis at center of transcranial magnetic stimulation (TMS) coil.
Radio frequency (RF) noise check in which the receiver chain of the system was set to a high receiver gain and symmetrically stepped through a bandwidth up to 250 kHz relative to the Larmor frequency of the system (i.e., 127.7 MHz) in steps of 10 kHz (i.e., 50 steps in total covering a range of 500 kHz).
50% Phase oversampling to reduce ghost artifacts of TMS coil (Bestmann et al. 2008a). §This echo-planar imaging (EPI) is similar to that used in the resting-state human data collection except that in the latter more volumes were collected and intensity was set to 80% of the stimulator output.
In TMS-EEG setup, each 9–27 s (average of 18 s), a TMS pulse (at 100% maximum stimulator output) was delivered in-between acquisitions. TR, repetition time; TE, echo time; FA, flip angle; NA, not applicable; B0, static magnetic field.
EEG equipment.
EEG data were recorded using a 64-electrode (including 1 electrooculogram and 1 electrocardiogram electrode), MR-compatible EEG cap (EasyCap, Herrsching, Germany) with equidistantly spaced sintered Ag/AgCl ring electrodes equipped with current-limiting 5-kΩ resistors with low-power dissipation. Electrodes were filled with 150 ml of conductive gel (Abralyte 2000), and their cables were combined within a single-cable tree (superoposteriorly located), connected to 2 MR-compatible BrainAmp MR Plus amplifiers (16-bit analog-to-digital conversion; 0.5-μV resolution; ±16.384-mV operating range; 5,000-Hz sampling; 0.1- to 250-Hz band pass) with associated rechargeable PowerPacks (Brain Products, Munich, Germany). Both amplifiers were placed next to the rear end of the scanner such that short wires (total length of 1.2 m) could be used from the electrodes to the amplifiers. These flat-wire cables were positioned in a straight line along the main z-axis of the scanner and were fixed with sandbags to prevent cable motion. EEG acquisition was synchronized to the internal clock of the MRI scanner driving the gradient-switching system using a SyncBox Interface (Brain Products). Data recording was performed using the BrainVision Recorder (v. 1.2) software running on a PC (Dell OptiPlex 755 with 2 GB of RAM and a 3-GHz Core 2 Duo Processor running 32-bit Windows XP Pro) outside of the MRI room to which the amplified signals were transmitted via fiber-optic cables (through a waveguide).
TMS hardware.
The TMS setup consisted of an MR-compatible double 70-mm figure-of-eight TMS coil (Magstim D70mm MRI Coil without any custom modifications; up to 1-T maximum output) connected via a 5-m cable to a filter box (operating in “auto” mode; Magstim Innovations, Whitland, Wales) located in the cabinet room and directly attached to a waveguide running through the wall of the MRI room. The other end of the filter box was connected to a Rapid2 stimulator with a dual-power supply module (Magstim). Besides precluding radio frequency (RF) noise entering the scanner room, the filter box additionally ensures that no artificial MR signal changes are induced due to leakage currents originating from the TMS stimulator (Weiskopf et al. 2009). The TMS coil was placed onto the posterior surface of the phantom (Fig. 1) and tightly fixed with cushions.
Fig. 1.

Position of transcranial magnetic stimulation (TMS) coil and regions of interest (ROIs). Anatomic image of the used phantom in which the TMS coil position is shown together with the ROIs used for computations of the signal-to-noise ratio (SNR) and for extraction of echo-planar imaging (EPI) time courses. B0, static magnetic field.
Temperature measurement equipment.
One of the possible effects of the TMS pulse and MR gradients on the EEG equipment is heating at the EEG electrodes, potentially harming the subject. To test this possibility, we performed continuous temperature measurements simultaneously from four positions using four digital thermometer sensors (DS18S20; Maxim, Sunnyvale, CA). Three sensors were placed on the EEG electrode rings (covering the electrode lead connection) at the following electrode positions according to the International 10-20 System of Electrode Placement: Cz (directly underneath the middle of the TMS coil for the combined setup), C4 (∼7 cm to the right of the TMS coil center), and ∼7 cm anterior to Fz on the Fz-Cz line (i.e., at the “nasion” of the phantom; as a reference position far away from the TMS coil). The fourth sensor was placed on the EEG cap at the location where all EEG leads are bundled to form the cable tree heading toward the EEG amplifiers. The applied temperature sensors made use of a one-wire bus communication interface connected to a laptop USB port (using a DS9490R type converter; Maxim) via a 6.5-m cable running through a waveguide. Temperatures at each measurement point were recorded with 0.5°C accuracy (within −10 to +85°C range) at ∼0.5 Hz and 9-bit resolution. Data acquisition for all three setups (phantom only, phantom+EEG, phantom+EEG+TMS) started 2 min before MR scanning [using the echo-planar imaging (EPI) sequence described below (Table 1, sequence 8); lasting 5.6 min] and continued for 2 min after scanning was stopped. For the combined EEG+TMS setup, temperatures were additionally recorded during two longer consecutive EPI runs (2 × 9.4 min) while also firing TMS pulses (pulses were spaced by 18 s on average at 100% maximum stimulator output) to monitor whether the temperature changes would be influenced by active TMS delivery.
Performed Measurements
The combined EEG-fMRI setup described above had already been established at our institute (see, e.g., De Martino et al. 2010; Debener et al. 2007; Strobel et al. 2008). Similarly, the concurrent use of TMS and fMRI had been extensively tested beforehand in close collaboration with Magstim related to preparations for dedicated experiments. Therefore, stress (single TMS pulses up to 15-Hz triplets at maximum stimulator intensity) and endurance (prolonged repeated TMS delivery up to 3 Hz at maximum stimulator output) tests had already been successfully performed in the scanner, ensuring the physical integrity of the TMS coil casing during operation in the MR environment even with stimulation parameters exceeding the intended use on humans.
Quality assurance tests (phantom).
The quality assurance tests described below were run under three different circumstances. First, phantom-only baseline measurements under standard operating conditions (i.e., without any of the additional equipment being present) were performed to serve as a reference for the other configurations. Second, the EEG cap was placed on the phantom, and all 64 electrodes were filled with conductive gel (∼150 ml in total). Additional elastic tubular net bandages (Elastofix; BSN Medical, Hamburg, Germany) were placed on top of the cap to ensure direct contact between the electrodes and the surface of the phantom. The cap was connected to the two amplifiers, and they in turn were connected to a PC in the console room, acquiring data throughout the test session. Finally, in the third step, the TMS equipment was added. The TMS coil was placed onto the posterior surface of the phantom (Fig. 1). The stimulator was set to 100% of maximum output intensity and “enabled” mode (i.e., the stimulator was fully ready to produce a TMS pulse) to have conditions identical to (or even exceeding in terms of intensity) an in vivo experiment. Note that TMS and fMRI are generally combined in an interleaved fashion such that TMS pulses are applied either in-between single-slice acquisitions or during temporal gaps between subsequent imaging volumes (see, e.g., Bestmann et al. 2008a). Therefore, also in human experiments, fMRI data will only be acquired while the TMS stimulator is not actually producing output yet is in an active (enabled) state awaiting the next TMS event to be elicited by external triggering. We applied TMS pulses in-between volume acquisitions during functional measurements (Table 1, sequence 8), similar to the sessions with the human volunteers.
A number of imaging protocols were run in all three conditions described above (phantom; phantom+EEG; phantom+EEG+TMS). An overview of the entire test battery can be found in Table 1. We repeated the quality assurance tests in an additional session to establish the robustness of our initial estimates.
Experiments with Human Subjects
TMS during resting state.
To evaluate the signal quality and subject comfort under normal operating conditions, we performed two functional measurements. In the first, we applied single-pulse TMS to the premotor cortex of a healthy volunteer (male, 30 yr). The setup was similar to the concurrent EEG+TMS setup in the phantom measurements except that: 1) the TMS coil was placed over the right premotor cortex; 2) the stimulator was set to 80% of the maximum output intensity; and 3) electromyography (EMG) was monitored to detect any motor-evoked potentials (MEPs) that might have occurred from TMS stimulation. Note that with the current stimulator intensity and TMS coil position, we did not expect any MEPs (Rossini et al. 1994), and indeed no MEPs were elicited. The TMS coil was positioned in two steps. First, the right primary motor cortex hot spot was determined through mapping of the resting motor threshold. The hot spot was defined as the stimulation site resulting in a visible movement of the resting contralateral thumb in 50% of the trials when stimulated. Subsequently, the TMS coil was positioned 2 cm anteriorly and 1 cm more medially relative to this localization to target dorsal premotor cortex (e.g., Johansen-Berg et al. 2002). Single TMS pulses were delivered every 13.5 s (11.25–15.75 s) on average at 80% of maximum stimulator output. TMS administration was triggered by transistor-transistor logic (TTL) pulses sent by a stimulus presentation software package (Presentation; Neurobehavioral Systems, Albany, CA) time-locked to the onsets of the MR volume acquisitions (i.e., taking place 500–600 ms after EPI acquisition offset). EMG recordings were performed using sintered Ag/AgCl ring electrodes placed at the left first dorsal interosseus and at the left processus styloideus radius for reference. Their signal was amplified by an additional BrainAmp ExG amplifier (Brain Products) and integrated with the EEG recordings using BrainVision Recorder.
Electrode impedance was kept <20 kΩ for all electrodes. Four runs of 250 volumes were measured using a sequence identical to sequence 8 from the quality assurance tests (Table 1). In addition, a field map was acquired (identical to sequence 6, Table 1).
TMS during auditory oddball detection (TMS-EEG-fMRI/TMS-EEG).
To assess the quality of ERPs, we performed a second measurement in which TMS was applied to the center of the right intraparietal sulcus of healthy participants either inside the MR environment (1 female, 24 yr) or outside the scanner (1 female, 23 yr) performing an active auditory oddball detection task. We used neuronavigation for TMS coil placement. The TMS target site definition was based on results from an earlier EEG-fMRI study by Strobel et al. (2008) in which the same task was used.
In each of 4 runs, 150 tones were presented via MR-compatible headphones in-between MR volume acquisitions (i.e., 100–200 ms after EPI acquisition offset). The stimuli were rarely (1,000 Hz; probability 10%) and frequently (500 Hz; 90%) occurring sine tones (400-ms stimulus duration), and the subject had to press a button as soon as a rare tone was presented. Rare tones were interspersed by 8, 9, or 10 frequent tones (each spacing occurred equally often). A TMS pulse was delivered 20 ms before stimulus onset of the rare tone in 66% of the cases. The period in-between volume acquisitions was 900 ms, leading to a total repetition time of 2,320 ms (17 slices, 3.5 × 3.5 × 4.0 mm3 voxel size). Otherwise, the used sequences as well as the rest of the setup were identical to the human measurement described in the previous section. All procedures were approved by the Medical Ethical Committee of the Maastricht University Medical Centre.
Data Analyses
Quality assurance tests (phantom).
fMRI data were analyzed using standard techniques for MRI quality estimation. In short, results of the measurements summarized in Table 1 were quantified as follows.
RF FIELD.
B1 field mapping of the baseline, EEG, and EEG+TMS setup were visually inspected for deformations. To visualize further the distortion differences between the RF field in the three different setups, images of the three setups were pairwise subtracted using ImageJ (National Institutes of Health, Bethesda, MD).
SIGNAL-TO-NOISE RATIO.
The signal-to-noise ratio is given by SNR = C(I/SDair), where I is the mean signal intensity in a region of interest (ROI) in the phantom and SDair is the standard deviation in a ROI outside the phantom (ROIair). Finally, C = 0.655, which is included to compensate for the skewed instead of normal distribution of noise, resulting from the Fourier transformation and construction of a magnitude image (which only contains positive values; Kaufman et al. 1989). To ensure that we did not miss any artifacts in more remote areas relative to the TMS coil, data quality was assessed not only in a ROI directly under the center of the TMS coil (ROIvertex), but also in a second ROI in the center of the phantom (ROIcenter). Note that these two ROIs, depicted in Fig. 1, were also used in Fig. 5. SNRs were computed for each of the two ROIs in every setup of the two measurement sessions, and values were statistically compared using paired t-tests.
Fig. 5.
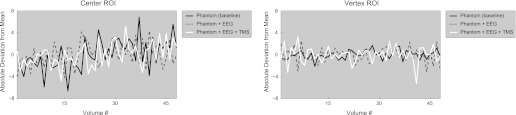
EPI data. Time course of absolute deviations from the mean as derived from the 2nd EPI run shown for the center (left) and vertex (right) ROI and for all 3 setup configurations (separate lines). Note that in relative terms, all shown deviations from the mean are <0.5%.
RF NOISE SPIKES.
RF noise-spike tests were performed in the three different setups, and resulting images were carefully inspected for presence of any spikes.
RF NOISE.
Given that discrete interfering RF signals would show up in the noise images as bright stripes, the resulting data were checked via visual inspection while browsing through the acquired stack of images (as is routinely performed to evaluate these kinds of data). In addition, we calculated the mean pixel intensity and standard deviation (across the x-direction of the images) for each pixel position and each 10-kHz frequency step, providing summary measures for the imaged volume to facilitate quantitative comparisons.
SPATIOTEMPORAL NOISE CORRELATION.
To measure the temporal stability across multiple functional MR images, a series of 320 EPI volumes was acquired for all 3 setup configurations and analyzed according to the procedure described by Weisskoff (1996). Briefly, the single-image SNR was calculated by taking the ratio across all images between the mean intensity in a 15 × 15 ROI in the middle of the phantom divided by the standard deviation of an equally sized background ROI outside of the phantom. Next, the standard deviation over time was determined for several ROIs with increasing size (from 1 × 1 to 15 × 15 pixels in steps of 2) in the middle of the phantom and divided by the mean intensity across all 320 images per ROI size [“Fn” in Weisskoff (1996), with subscript referring to ROI size]. These empirically determined fluctuations could now be compared with the theoretically achievable ideal case based on the previously determined single-image SNR [“Fn,t” in Weisskoff (1996), obtained by dividing 1 by the product of ROI size × single-image SNR].
B0 FIELD MAP.
To estimate MR susceptibility distortions, field maps (Table 1, sequence 6) were acquired in the three setups, and the displacement of each voxel was estimated using the FieldMap toolbox (Hutton et al. 2002) implemented in SPM8b (Wellcome Department of Cognitive Neurology, London, United Kingdom). In the human data sets, the estimated voxel displacement maps were subsequently used to correct image distortions in the functional images (Andersson et al. 2001).
The first EPI measurement was performed with the amplitude of the RF excitation pulses set to 0 V (see Moisa et al. 2009). Given that no signal is transmitted in this way, potential noise sources could be detected, as the resulting images should ideally be devoid of any structured content. This was verified through visual inspection and by numerical checks on the image intensities. From the second EPI run (identical acquisition parameters except for the reference voltage), mean signal time courses were extracted from the center and vertex ROI to assess the signal stability when scanning with typical settings used in a combined TMS-fMRI measurement.
The anatomic data set was visually inspected for any irregularities.
Human data.
Preprocessing of fMRI data included slice scan-time correction, linear trend removal, high-pass filtering, and three-dimensional motion correction as implemented in the BrainVoyager QX software package (version 2.3; Brain Innovation, Maastricht, The Netherlands). The first two volumes of each run were discarded to remove T1 saturation effects. Functional data (resampled to 3 × 3 × 3 mm3 voxel resolution) were not spatially smoothed, but a temporal high-pass filter was applied to remove frequencies lower than 2 and 4 cycles per time course for the resting-state and oddball data, respectively. The intrasession anatomic image was aligned to a high-resolution cortex reconstruction (Kriegeskorte and Goebel 2001) of the subject acquired in a separate session. TMS-evoked hemodynamic responses were modeled with a boxcar function convolved with a theoretical 2-γ hemodynamic response function (Friston et al. 1998). Next, this model was subjected to a whole-brain, voxelwise, multiple-regression analysis.
To provide an impression of the raw EEG data quality, recorded EEG traces are presented without any filtering or artifact correction in the corresponding figures.
RESULTS
During the measurements, we did not encounter any difficulties or hardware malfunctioning, and all recordings could be completed as planned.
fMRI Data Quality
To assess the reliability of our quality assurance tests, we replicated all tests in an additional session 2 wk later. Test-retest correlations for the SNR, RF noise spikes, and RF noise measurements were high [mean r = 0.95, SD = 0.04, when discarding the measurement of RF noise spikes in the baseline setup of the 2nd session (see Fig. 2C, left) as outlier], suggesting a good reliability of these quality assurance tests. Throughout the remainder of this paper, we will focus on results of the 2nd session.
Fig. 2.

Raw magnetic resonance (MR) images of the mapped radio frequency (RF) field contribution (A), SNR sequence (B; the vertex and center slices correspond to the transverse slices used for ROI SNR calculations; see Fig. 1), and RF noise spikes measurement (C).
RF Field, SNR, and RF Noise Spikes
Figure 2A shows the mapped RF field in the three different setups. The patterns created by the dielectrical resonance of water in the phantom (left) are distorted in the EEG setup (middle), especially in parts where electrode leads were bundled. However, adding the TMS coil to the setup did not give rise to additional distortions (right). A similar effect was found for the SNR images (Fig. 2B): the presence of the EEG electrodes, the gel they contained, and the bundling of leads did lead to an increased variation in pixel intensities and an elevation of the mean intensity for the vertex ROI (Fig. 2B; Table 2, Mean ROI Signal Intensity). When adding the TMS coil, pixel intensity variance (but not mean) in the vertex ROI was further increased. Most importantly, however, the standard deviation remained constant across all three setups for the center ROI, and SNR only changed slightly (∼9%). At a quantitative level, on average, the SNR across the two slices did not differ between setups (Wilcoxon test; all P > 0.1; see Table 2, Mean ROI Signal Intensity, for SNR values).
Table 2.
Signal intensity, signal-to-noise ratio, and voxel displacement in regions of interest
| Phantom | Phantom+EEG | Phantom+EEG+TMS | |
|---|---|---|---|
| Mean ROI Signal Intensity (SD) | |||
| ROIvertex | 81.2 (2.6) | 148.2 (12.3) | 114.6 (21.5) |
| ROIcenter | 172.5 (3.5) | 163.8 (4.1) | 158.1 (3.5) |
| ROIair | 1.4 (0.8) | 1.2 (0.8) | 1.2 (0.8) |
| Signal-to-Noise Ratio | |||
| ROIvertex | 66.5 | 121.4 | 93.9 |
| ROIcenter | 141.2 | 134.1 | 129.4 |
| Estimated Voxel Displacements | |||
| Mean | −0.02 | 0.01 | −0.04 |
| SD | 0.24 | 0.32 | 0.51 |
| Min. | −1.99 | −2.78 | −4.31 |
| Max. | 0.92 | 1.94 | 3.35 |
Top rows: mean signal intensity (and SD) across the vertex, center, and air regions of interest (ROIs; see Fig. 1) in the 3 different setups. Middle rows: signal-to-noise ratio in the vertex and center ROIs (rows) across the 3 different setups (columns). Bottom rows: mean and range of the voxel displacements across all slices estimated by the B0 inhomogeneity correction procedure. Min., minimum; Max., maximum.
Finally, we did not see any spatial oscillations indicating the presence of spikes in any of the three setups (Fig. 2C).
Noise Check
Visual inspection of the acquired noise images did not reveal the presence of any stripes or other irregularities for any of the three tested setup configurations, indicative for the absence of unwanted RF noise sources. RF noise interference was quantified by calculating the mean pixel intensity and the standard deviation across the x-direction of the images (note that a bright stripe would lead to a large mean value and a concomitant aberration in the standard deviation). The mean pixel intensity was highly consistent for all 10-kHz steps of the probed receiver bandwidth (see summary plots in Fig. 3). In addition, the calculated standard deviations were similar across setups (on average: baseline = 38.24, EEG = 46.09, EEG+TMS = 44.03). Overall, these data show that the use of the introduced EEG and TMS equipment was not accompanied by the presence of interfering RF noise.
Fig. 3.
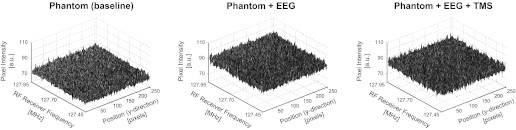
RF noise measurements. Summary plots of the mean pixel intensity averaged across the x-direction of the images to visualize the possible presence of interfering RF noise (i.e., a bright stripe indicating RF noise in the raw images would show up here as a peak in the plotted surface). No RF noise was detected for any of the tested setups (i.e., all 3 plots show rather homogeneous surfaces without isolated peaks in mean intensity values). a.u., Arbitrary units.
Spatiotemporal Noise Correlation Measurements
When calculating the single-image SNR, relative reductions in SNR of 11.03 and 11.87% compared with baseline were found for the EEG and EEG+TMS setup, respectively. These numbers are in good agreement with the SNR measurements reported above and further indicate that adding TMS on top of EEG has negligible effects on SNR. In addition, when plotting the relative intensity fluctuations over time as a function of ROI size (Fig. 4), it becomes apparent that the deviation between Fn (representing the empirically determined reduction in signal fluctuations due to increases in ROI size) and Fn,t (representing the theoretically achievable reduction in signal fluctuations due to increases in ROI size based on the single-image SNR) is very similar across all three tested setups, suggesting that adding neither EEG nor EEG+TMS considerably affects the temporal stability of the scanner while acquiring EPIs.
Fig. 4.
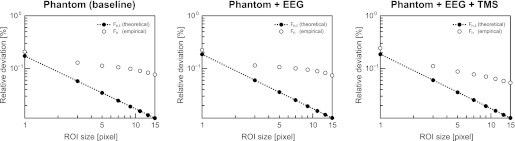
Spatiotemporal noise correlation measurements. The plots show the empirically determined signal fluctuations (Fn; ○) in the center of the phantom relative to the mean intensity across all acquired images for ROIs of different sizes (1 × 1 to 15 × 15 pixels) together with the theoretically maximally achievable drop-off in these fluctuations based on the single-image SNR (Fn,t; ●). For details on the applied procedures, see main text and Weisskoff (1996).
B0 Field Maps
Results suggested that MR susceptibility distortions were small and did not differ much between setups (Table 2, Estimated Voxel Displacements). Estimated maximal voxel shifts occurred in the vicinity of the bundle of EEG leads (EEG and EEG+TMS setup) and in the vicinity of the TMS coil (EEG+TMS setup).
EPI Runs
Scanner-reported specific absorption rate (SAR) values for the baseline, EEG, and EEG+TMS setup were 0.00733, 0.0112, and 0.0107 W/kg, respectively, for a phantom with a registered patient weight of 70 kg. This is well within the maximum SAR limit of 2 W/kg (for a 6-min period) as stated in the International Electrotechnical Commission (IEC)/Food and Drug Administration (FDA) guidelines (IEC 3rd edition, 2007, 60601-1-2; Shellock 2007).
Furthermore, the images obtained without prior RF excitation (reference voltage = 0 V) were consistently devoid of structured content (i.e., no undesired noise source was detected). This finding corroborates the results from the RF noise measurement reported above when zooming in to the “EPI-relevant” frequency range. In addition, the center and vertex time courses extracted from the second EPI run did not show any abnormalities, suggesting stable signals could be read out under all conditions (Fig. 5).
Temperature Measurements
The measured temperatures from all 4 recording sites are depicted in Fig. 6 (separately for the 3 different setup configurations). No temperature changes were observed for the baseline setup (left). In contrast, whereas the temperature over the 2-min baseline remained stable, a slight temperature increase (ΔT) is visible for the EEG setup during the EPI acquisition (middle). However, this only holds for the recording sites where the temperature sensors were attached to an EEG electrode ring (sensor 1: ΔT = 0.3°C; sensor 2: ΔT = 0.8°C; sensor 3: ΔT = 1.4°C). Importantly, the exact same pattern was replicated when adding TMS (sensor 1: ΔT = 0.3°C; sensor 2: ΔT = 0.8°C; sensor 3: ΔT = 1.3°C), indicating that the combined EEG+TMS setup did not lead to additional heating compared with using the isolated EEG setup. Again, the strongest temperature increase was observed at sensor 3 (i.e., located far away from the TMS coil), suggesting that the main factor determining whether heating occurs is the orientation/position of the EEG electrode relative to the gradients introduced during EPI data acquisition. Finally, consecutively acquiring two longer EPI runs while delivering TMS pulses led to continued increases in temperature (ΔT up to 1.4°C for sensor 3). However, the maximum temperature reached was 20.6°C, which is well within the acceptable range in terms of safety limits (Dewhirst et al. 2003; Yarmolenko et al. 2011). Although the temperatures started to drop immediately after cessation of the EPI acquisition, it took several minutes before the temperature of the involved subset of recording sites was back to baseline levels. The potential of incremental temperature increases should therefore be kept in mind when planning to acquire a series of consecutive functional runs.
Fig. 6.
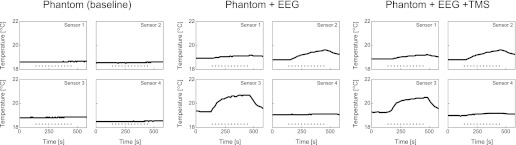
Temperature measurements. The plots show continuous temperature measurements from 4 different recording sites for all 3 setup configurations. Data were acquired before (2 min), during (5.6 min; represented by dotted horizontal line), and after (2 min) MR scanning. Importantly, temperature fluctuations were limited to a maximal temperature increase (ΔT) of 1.4°C, and adding TMS (right) did not lead to additional increases compared with the measurements with EEG in isolation (middle).
Human Data
To estimate EEG and fMRI data quality and test for subject comfort, we performed two test measurements with human volunteers. The participants indicated that the experienced sensation of the TMS pulses was similar to other concurrent TMS-fMRI studies, which is more pronounced than in isolated TMS studies but still within their comfort zone. The raw EPI images did not reveal any additional signal dropouts even in the vicinity of the TMS coil (Fig. 7).
Fig. 7.

Raw functional human data. Stack of 21 transverse slices (for EPI parameters, see sequence 8 in Table 1). Note that even the most superiorly positioned slices appear unaffected despite being located in close vicinity of the TMS coil, showing that in human data (compared with the phantom data), the distance between cortex and TMS coil was sufficient to prevent EPI signal corruption. R, right; L, left.
The signal quality was further assessed by examining the voxel displacement map shown in Fig. 8. Similar to the phantom results, the EEG cap and TMS coil did not give rise to strong EPI distortions in the human data set. Estimated voxel displacements in the upper three slices underneath the coil were in the same order as the shifts observed in another recently published concurrent TMS-fMRI study (Moisa et al. 2009).
Fig. 8.

Voxel displacement map. The upper 3 slices (cf. slices 19-21 in Fig. 7) of the estimated voxel displacement map, which can be used to undistort EPI images. Since distortions were only minimal in the areas of interest, activation maps based on undistorted (i.e., corrected for susceptibility distortions) and distorted (i.e., uncorrected) images were rather similar. To stay as close as possible to the original data, Fig. 9 presents the uncorrected images.
Figure 9 shows the hemodynamic and electrical responses to the single TMS pulses targeting right premotor cortex. The fMRI data revealed both local (i.e., at the target site) as well as more pronounced remote (i.e., in connected brain areas) BOLD responses. Next to the activation of auditory areas (related to the clicking sound produced by TMS pulse delivery), BOLD increases were found in (sub)cortical areas connected to the dorsal premotor cortex, including the presupplementary/cingulate motor area (Geyer et al. 2000), precuneus (Cavanna and Trimble 2006), and thalamus (Morel et al. 2005). These TMS-evoked hemodynamic responses were small but consistent (Fig. 9B). The application of TMS led to a relatively large and long-lasting artifact in the EEG (Fig. 9C, right) compared with measurements performed in a non-MR environment (e.g., Veniero et al. 2009). However, note that the raw signal in the interval before the TMS pulse was highly similar to resting-state data acquired in previous simultaneous EEG-fMRI experiments (e.g., De Martino et al. 2010) both in the time domain (Fig. 9C, top left) as well as in the frequency domain (Fig. 9C, bottom left). This indicates that by appropriately timing the TMS administration relative to the EPI volume acquisitions, pre-TMS EEG measures could be used as an index of the current brain state. This would offer an adequate sampling of ongoing activity, which, due to its fluctuating nature from trial to trial, might explain a significant part of the variability in TMS-induced effects on cortical processing (tractable by measuring the concomitant BOLD responses).
Fig. 9.
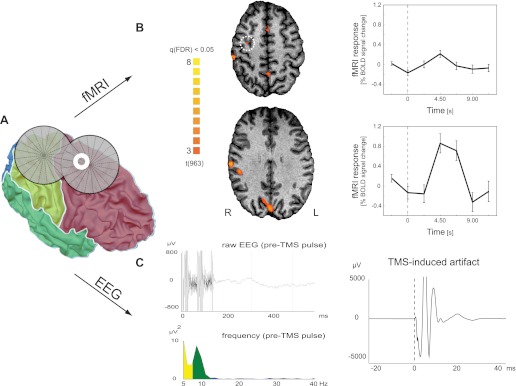
Human EEG and functional MRI (fMRI) data (resting state). Hemodynamic and electrical responses to single-pulse TMS to the right premotor cortex. A: TMS coil and premotor electrode “E8” (white annulus) position shown on the reconstruction of the participant's gray-white matter boundary surface. Surface colors indicate the 4 lobes. The TMS coil was positioned perpendicular to the main axis of the precentral sulcus, targeting the dorsal premotor cortex (schematically illustrated by the intersection of the 2 coil windings representing the main focus of the TMS coil). B: TMS-induced blood oxygenation level-dependent (BOLD) activations. Maps on transverse slices show regions with increased activation following TMS compared with resting baseline {q [false discovery rate (FDR)] < 0.05}. A less-pronounced local response could also be identified in the targeted dorsal premotor cortex (indicated by white dotted circle) when lowering the statistical threshold [t(963) = 2.24; P (uncorrected) < 0.025]. As exemplars, the plots on the right show average time courses for the right dorsal premotor cortex (top) and precuneus (bottom), respectively. The vertical dotted line represents the time of TMS delivery. Error bars indicate standard error of mean. C: EEG recordings from electrode E8 (spherical coordinates: θ, 49.04; φ, 67.24; see also A). The top left shows the raw data of a single trial. In the 1st 150 ms, the gradient artifact is clearly visible (collection of the last 2 slices). The subsequent period (followed by the TMS pulse and the subsequent MR volume acquisition; data not shown) is artifact-free (except for the non-TMS-related ballistocardiogram artifact) and shows strong similarity to resting-state signals in simultaneous EEG-fMRI studies. Also, the fast Fourier transform (FFT)-frequency spectrum of all pre-TMS pulse periods of 1 run (bottom left) shows similar results to simultaneous EEG-fMRI studies with high power in the α-range (and in addition in the δ-θ range, most likely representing the ballistocardiogram artifact). Note that the frequency spectrum of the same period in events where no TMS pulse was applied is identical to this plot depicting the pre-TMS pulse period (data not shown). Finally, the right plot illustrates the strong TMS-induced artifact (grand average over all TMS events; time of TMS pulse delivery represented by dotted vertical line).
In addition, the data from the auditory oddball detection task do show that the extraction of certain post-TMS EEG components is possible. Figure 10A shows event-related averages of the raw EEG signal, revealing a similar P3b component response to the rarely presented oddball stimuli at parietal sites when the auditory stimulation was preceded by TMS (by 20 ms) and when it was not. In contrast, no such response was elicited by the frequently presented tones. These data also provided a clearer boundary for the duration of the TMS-induced artifact in the EEG, suggesting that the signal quality could be compromised up to 300 ms post-TMS. This artifact was stronger and lasted longer than the ∼30-ms long TMS-induced EEG artifact we obtained outside the MR environment in the same experimental paradigm (comparable with previous reports on the two-way combination of TMS and EEG; see, e.g., Fuggetta et al. 2006). The strong TMS artifact in the scanner limits the information that can be extracted from the EEG recordings immediately following the TMS application and constitutes the most prominent limitation of the current implementation of this multimodal imaging approach based on existent commercially available hardware components. After the TMS artifact, the ERP waveforms resembled those reported by combined EEG-fMRI auditory oddball studies such as Strobel et al. (2008). In addition, contrasting fMRI responses to rare compared with the frequent tones revealed an extended network showing higher activity to oddballs, including areas in among others frontomedial and intraparietal areas and the temporoparietal junction [P (Bonferroni corrected) < 0.0001; Fig. 10B]. The observed activation pattern in the present study overlapped with the network engaged in oddball processing as observed by Strobel et al. (2008).
Fig. 10.
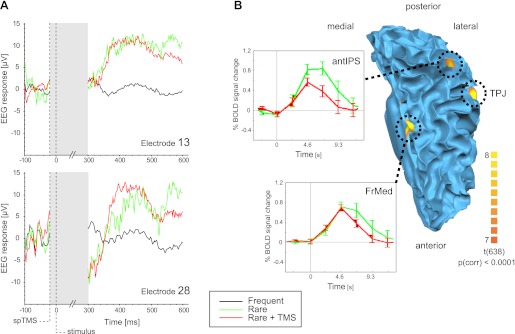
Human EEG and fMRI data (oddball task). A: average evoked EEG responses to the auditory stimulation conditions at parietal electrodes E13 (spherical coordinates: θ, 46.61; φ, −90) and E28 (spherical coordinates: θ, −70.64; φ, 52.95). In contrast to the frequently presented tone (black line), the rare oddball tone elicits a positive response with a 300- to 350-ms latency akin to the well-known P3b component [similar for trials in which no TMS was applied (green line) and when the tone was preceded by TMS (red line)]. Note that with the currently available hardware, the duration of the TMS-induced artifact in the EEG was ∼300 ms (indicated by shaded region). Shown curves represent epoched and baseline-corrected EEG traces without having applied any further preprocessing. B: top view on the cortical network involved in oddball detection projected on the participant's gray-white matter boundary surface of the left hemisphere. Activity in a frontomedial (FrMed) area, the temporoparietal junction (TPJ), and anterior intraparietal sulcus (antIPS) was stronger in response to the rare compared with the frequent tones {P [Bonferroni corrected (corr)] < 0.0001}. The insets show average time courses (stimulus onset = 0 s) for the FrMed and antIPS for the rare tones preceded (red line) or not preceded (green line) by a TMS pulse. spTMS, single-pulse TMS.
DISCUSSION
The present study explored the feasibility of concurrent TMS-EEG-fMRI studies by performing safety and quality assurance tests on phantom and human data. Results showed, for the first time, that simultaneous TMS-EEG-fMRI measurements are feasible in terms of hardware, subject comfort, and MR signal quality. However, with currently available equipment, extraction of useful EEG signals was limited to pre-TMS intervals and EEG components arising 300 ms or later relative to the time point of TMS delivery. In the following sections, we will briefly discuss the conceptual gains of combining all three methods, summarize our findings on the practical feasibility of such an endeavor, and list a number of precautions one should keep in mind when establishing such multimodal imaging facilities.
Conceptual Gains of Simultaneously Combining TMS with EEG and fMRI
The simultaneous use of TMS-EEG-fMRI allows for addressing novel neuroscientific questions, which can be described by the following four different aspects.
First, in the virtual lesion approach, it would be most enlightening to observe the neural effects of TMS with both the temporal resolution of EEG and the spatial resolution of fMRI. Moreover, the possibility to integrate tightly the analyses of both data sets at the single-subject level (by projecting data in the same data space; Esposito et al. 2009) allows a cross-fertilized interpretation of results due to the complementary nature of the data, providing a comprehensive understanding of neurocognitive processes.
Second, some tasks and processes of interest cannot be repeated easily. Primarily, studies that require single-trial analysis, because the events are unexpected, situation-dependent, or subject to learning or adaptation, require all methods to be present simultaneously. For example, Walsh et al. (1998, 1999) could demonstrate that visual conjunction search is impaired by parietal TMS only when the stimuli are novel to the subjects but that these TMS effects vanish with increasing training or familiarity of the subjects with the conjunction tasks. The authors speculated that this dependence of behavioral TMS effects represents a shift in learning-dependent visual information processing, including the recruitment of different underlying brain areas. Only a concurrent combination of TMS with fMRI/EEG could map the causal interactions between brain network dynamics and behavior during information processing of unfamiliar stimuli and/or even chart the dynamic changes occurring with increasing training or task familiarity.
Third, behavior fluctuates over trials. Whereas seemingly random fluctuations in both behavior and neuronal measures have often been regarded as noise, in part they will necessarily have a neural basis. Indeed, much recent research has begun to focus on understanding these fluctuations (e.g., Weissman et al. 2006). For example, whether a liminal stimulus will be perceived depends on the phase of ongoing α-oscillations, to be measured with EEG (Mathewson et al. 2009). Whether the ambiguous “Rubin vase” stimulus will be perceived as faces or vase depends on fMRI activity around stimulus presentation (Hesselmann et al. 2008). In other words, behavioral and neural responses depend on brain state. The same is true for the effect of TMS pulses (Romei et al. 2007). Thus one example of a simultaneous TMS-EEG-fMRI behavior paradigm, in which the fully multimodal setup is not only beneficial, but also actually mandatory, is an experiment in which TMS provides the experimental probe, or manipulation, in which one imaging method indexes a brain state (e.g., for EEG, the phase or power of ongoing oscillations in a particular frequency band) and the other imaging method measures brain activation as a dependent variable (e.g., for fMRI, the BOLD response underlying the TMS-affected behavior). More concretely, in the case of TMS-induced masking of visual stimuli, one could use EEG to index the brain state at the moment of visual stimulation and/or TMS to explain some variability in the metabolic (fMRI) and behavioral responses over trials.
Fourth, to obtain a comprehensive understanding of brain connectivity in cortical-subcortical networks, we need fMRI to reveal brain-wide activations with high spatial resolution, EEG to monitor fast interactions, and TMS to probe these networks. For example, causal interactions in the dynamic thalamocortical circuits cannot be fully understood at the single-trial level without applying all three methods simultaneously. One would need TMS to insert energy into the network, EEG to pick up the reverberations in different frequency bands, and fMRI to measure local, remote, and subcortical activations in response. Additionally, the (sub)cortical bases of certain frequency-band reverberation responses to the TMS pulse in the EEG signal could be analyzed by transforming frequency-power modulations over time in the EEG signal into fMRI model predictors.
Feasibility of Concurrent TMS-EEG-fMRI Measurements
Since the three-way combination of EEG, fMRI, and TMS might lead to interactions that do not, or only weakly, emerge in the pairwise combinations of these modalities (such as potential TMS-induced electrode heating or exacerbated susceptibility artifacts), it is important to test the feasibility of such a new setup, especially in terms of safety and data quality. No problematic interactions between the different devices of the tested setup were experienced beyond those known to occur when separately combining TMS-EEG, TMS-fMRI, or EEG-fMRI. The performed quality assurance tests indicate that stable, RF noise-free functional images with sufficient SNR can be acquired when simultaneously combining all three methods within one experimental session. Although a small fraction of slices in the direct vicinity of the TMS coil produced suboptimal images in our phantom setup, it should be noted that these phantom measurements actually represent a worst-case scenario beyond the conditions encountered in an in vivo experiment, as the TMS coil here directly contacted the object of interest to be imaged (whereas it only touches a participant's skull in an actual experiment, creating at least several centimeters of distance between this contact point and the brain ROIs). This also becomes apparent when inspecting the acquired slice stack from our human data set, where even the most superior slices appear unaffected. Furthermore, the slight decreases in SNR are in line with earlier findings on SNR changes when introducing 64-channel EEG equipment in a 3-T MR system [e.g., Mullinger et al. (2008b) report a reduction of 15%]. However, the most important finding in this context was that adding TMS did not lead to further decreases. In addition to the described MR quality assurance tests, we particularly paid attention to three aspects that theoretically could have negatively affected measurements differently in the triple-method combination compared with the pairwise concurrent setups. First, due to the combination of MR gradients and TMS stimulation (although applied in interleaved fashion), stronger increases in temperature of electrodes in the vicinity of the TMS coil could have occurred due to stronger currents in the wires of the electrodes and increased flip angle requirements due to B1 field distortions (leading to an unacceptable level of tissue heating in a worst-case scenario). Therefore, we performed a range of temperature measurements at maximum stimulator output intensity. Results showed that the combined EEG+TMS setup did not lead to additional heating compared with using the isolated EEG setup in an MR environment. Moreover, previous work (Dewhirst et al. 2003) has shown that the pain perception threshold is significantly lower than the threshold at which actual heating-induced tissue damage occurs, constituting an inherent safety check provided that constant communication between experimenter and participant is possible. Although the chances of actual tissue damage due to heating therefore are small, it might nevertheless be advisable to monitor potential temperature changes before starting a new series of concurrent TMS-EEG-fMRI experiments in light of the myriad of parameter combinations that can be used for TMS (in terms of stimulation site, frequency, intensity, train duration, and patterning). Second, the ultimately achieved intensity of TMS might be diminished for the current setup due to increased serial inductance brought about by the rather long cable connecting the TMS coil to the stimulator and the distance of the TMS coil to the scalp due to the intervening EEG cap. Although the overall intensity indeed was weaker compared with the isolated use of TMS outside of the MR environment, we were able to stimulate above resting motor threshold as assessed during the TMS coil placement procedure in the tested subject. In addition, the TMS pulses were strong enough to elicit BOLD responses both underneath the TMS coil and in remotely located associated motor network nodes, underlining the effectiveness of the stimulation to trigger neural events. Third, EEG amplification might be differently affected by TMS-induced currents in the MR environment. The TMS-related EEG artifact in the MR environment indeed was stronger and lasted longer compared with similar recordings performed outside the magnetic field, which might be related to eddy currents and resonance frequency shifts (as can also be observed due to respiration or limb motion) or more long-lasting vibrations of the TMS coil due to the presence of the strong static magnetic field. The TMS artifact might be reduced by further optimizing EEG hardware for combined TMS-EEG-fMRI measurements (e.g., electrodes should be as flat as possible, which is beneficial for EEG+TMS recordings, but at the same time remain MR-compatible). In addition, adequate artifact rejection and TMS template subtraction techniques (e.g., Thut et al. 2005) could be explored to eliminate the TMS artifact offline and recover early ERP components. However, even without any preprocessing or artifact correction, late ERP components can be derived (at the single-subject level) from the EEG signal as indicated by the results of our oddball measurement (Fig. 10). Moreover, the signal before the TMS pulse is similar to other concurrent EEG-fMRI studies (Fig. 9; e.g., De Martino et al. 2010) and could be used, for example, to measure state dependency of the effects elicited by TMS (Romei et al. 2007).
Practical Considerations for Simultaneous TMS-EEG-fMRI Measurements
In addition to the standard protocols that have to be taken into account for TMS, EEG, fMRI, and their pairwise combinations [e.g., subject screening, prevention of loops in EEG leads, TMS operation limits during (f)MRI as specified by the coil manufacturer, etc.; see Bestmann et al. 2008a; Miniussi and Thut 2010; Rossi et al. 2009; Thut et al. 2005] and use of medical electrical equipment in an MR environment [Electromagnetic Compatibility Society (EMC) Standard 60601-1-2; International Commission on Non-Ionizing Radiation Protection (ICNIRP), 2004; IEC, 2007], it is advisable to keep the following in mind to ensure an effective and safe use of concurrent TMS-EEG-fMRI: generally, new TMS protocols should first be carefully tested during phantom measurements before applying them in studies involving human subjects. Safety and quality assurance should also be cautiously examined for any hardware deviations from the current setup such as the use of different RF coils (a body coil might, for example, induce higher temperature increases; Carmichael et al. 2008; Nöth et al. 2012) or use with higher static magnetic field strengths (which can lead to higher temperature increases; Mullinger et al. 2008a). Furthermore, resistive rather than (nonmagnetic) metallic electrode leads should be used to avoid temperature increases (Angelone et al. 2004). In addition, low-SAR imaging sequences should be used to avoid potential heating of biological tissue. More specifically, it is recommended to use only anatomic sequences with low SAR values such as the FLASH sequence or an MPRAGE with low flip angle (Bernstein et al. 2004; Nöth et al. 2012). Likewise, the use of gradient rather than spin-echo MR pulse sequences is preferred, since sequences applying 180° refocusing pulses have much higher RF power (e.g., Nöth et al. 2012). In any case, SAR levels should be monitored throughout the measurements to ensure that they are well below the maximum limits as indicated by FDA (Shellock 2007) and IEC (3rd edition, 2007, 60601-1-2) guidelines. Before each session, it is advisable to check whether the transmitter gain (which results from the prescan that is performed to calibrate RF excitation) is similar to values when using the pairwise combinations, considering the size of the participant's head as well as the sequences that will be applied.
Before starting the actual measurement, extra care has to be taken so that adequate grounding of all electrical parts is confirmed. All patient-applied EEG (and, if applied, EMG) parts have to be electrically isolated from true ground (IEC, 2005), and the TMS stimulator has to be grounded. Furthermore, mechanical stability of equipment should be checked in advance: ensure that devices such as TMS coil and EEG are stably mounted (taking into account the moving scanner table) and avoid trip hazards by securing all cables. Pay attention to the EEG lead arrangement (no loops and minimize curvatures and resonance length) to minimize temperature increases (Dempsey et al. 2001). Finally, the auditory stimulation that cooccurs with a TMS pulse is to a large extent amplified in the scanner environment and thus requires adequate hearing protection such as a combination of foam earplugs with headphones. Before starting with the actual measurement, it is advisable to apply several test pulses at the experimental intensity in the scanner environment to have the subject adapt to the auditory stimulation as well as to assess whether the coil is stable and in a comfortable position and pulse sensation is tolerable. Preferably, coil and electrodes should be positioned such that scalp areas in-between EEG electrodes are directly targeted as this prevents coil pressure on a single point of the scalp: when piloting several coil positions/stimulation sites, we found that the most relevant aspect of subject comfort is whether the TMS coil puts pressure onto a single EEG electrode (i.e., contact point on the skull). When there is high pressure of the TMS coil onto the head, small cushions or paper towels around the EEG electrode at the pressure point will help to distribute the weight, improving subject comfort. This can become very relevant in TMS-EEG-fMRI studies that involve stimulation sites such as occipital cortex, where the subject must lie on the TMS coil, but also in prolonged measurements involving more anterior sites. Setups in which the TMS coil is oriented (close to) parallel to the static field should be handled with the greatest prudence since mechanical forces on the TMS coil are stronger under these circumstances and might lead to subject discomfort and larger signal artifacts.
In sum, our findings indicate that although extracting early TMS-induced ERP components is currently still challenging, pre-TMS EEG and late ERP components can be acquired with sufficient quality in the scanner using standard equipment. Furthermore, adding TMS on top of using EEG in the MR environment did not lead to undesired interactions negatively affecting the MR signal quality as assessed using a variety of tests. Finally, when taking into account all of the above-mentioned considerations, we experienced that it is feasible to perform simultaneous TMS-EEG-fMRI with acceptable comfort for the subject. Future studies could exploit the benefits of simultaneously combining all three modalities to explore normal and perturbed cognitive processing in the human brain.
GRANTS
The research leading to these results has received funding from the European Research Council (ERC) under the European Union Seventh Framework Programme (FP7/2007-2013)/ERC Grant (Agreement no. 263472 granted to A. T. Sack and Agreement no. 269853 granted to R. Goebel).
DISCLOSURES
No conflicts of interest, financial or otherwise, are declared by the author(s).
AUTHOR CONTRIBUTIONS
J.C.P., J.R., and A.T.S. conception and design of research; J.C.P., J.R., T.S., T.d.G., and A.T.S. performed experiments; J.C.P. and J.R. analyzed data; J.C.P., J.R., K.U., and A.T.S. interpreted results of experiments; J.C.P. and J.R. prepared figures; J.C.P., J.R., T.S., T.d.G., and A.T.S. drafted manuscript; J.C.P., J.R., T.S., T.d.G., K.U., R.G., and A.T.S. edited and revised manuscript; J.C.P., J.R., T.S., T.d.G., K.U., R.G., and A.T.S. approved final version of manuscript.
ACKNOWLEDGMENTS
We are grateful to R. Lampe and H. Reithler (RWTH Aachen University) for their assistance regarding the reported temperature measurements.
REFERENCES
- Andersson JL, Hutton C, Ashburner J, Turner R, Friston K. Modeling geometric deformations in EPI time series. Neuroimage 13: 903–919, 2001 [DOI] [PubMed] [Google Scholar]
- Angelone LM, Potthast A, Segonne F, Iwaki S, Belliveau JW, Bonmassar G. Metallic electrodes and leads in simultaneous EEG-MRI: specific absorption rate (SAR) simulation studies. Bioelectromagnetics 25: 285–295, 2004 [DOI] [PubMed] [Google Scholar]
- Baudewig J, Siebner HR, Bestmann S, Tergau F, Tings T, Paulus W, Frahm J. Functional MRI of cortical activations induced by transcranial magnetic stimulation (TMS). Neuroreport 12: 3543–3548, 2001 [DOI] [PubMed] [Google Scholar]
- Bernstein MA, King KF, Zhou XJ. Handbook of MRI Pulse Sequences. London: Elsevier Academic Press, 2004 [Google Scholar]
- Bestmann S, Baudewig J, Frahm J. On the synchronization of transcranial magnetic stimulation and functional echo-planar imaging. J Magn Reson Imaging 17: 309–316, 2003a [DOI] [PubMed] [Google Scholar]
- Bestmann S, Baudewig J, Siebner HR, Rothwell JC, Frahm J. Subthreshold high-frequency TMS of human primary motor cortex modulates interconnected frontal motor areas as detected by interleaved fMRI-TMS. Neuroimage 20: 1685–1696, 2003b [DOI] [PubMed] [Google Scholar]
- Bestmann S, Baudewig J, Siebner HR, Rothwell JC, Frahm J. Functional MRI of the immediate impact of transcranial magnetic stimulation on cortical and subcortical motor circuits. Eur J Neurosci 19: 1950–1962, 2004 [DOI] [PubMed] [Google Scholar]
- Bestmann S, Ruff CC, Blankenburg F, Weiskopf N, Driver J, Rothwell JC. Mapping causal interregional influences with concurrent TMS-fMRI. Exp Brain Res 191: 383–402, 2008a [DOI] [PubMed] [Google Scholar]
- Bestmann S, Swayne O, Blankenburg F, Ruff CC, Haggard P, Weiskopf N, Josephs O, Driver J, Rothwell JC, Ward NS. Dorsal premotor cortex exerts state-dependent causal influences on activity in contralateral primary motor and dorsal premotor cortex. Cereb Cortex 18: 1281–1291, 2008b [DOI] [PMC free article] [PubMed] [Google Scholar]
- Blankenburg F, Ruff CC, Bestmann S, Bjoertomt O, Eshel N, Josephs O, Weiskopf N, Driver J. Interhemispheric effect of parietal TMS on somatosensory response confirmed directly with concurrent TMS-fMRI. J Neurosci 28: 13202–13208, 2008 [DOI] [PMC free article] [PubMed] [Google Scholar]
- Bohning DE, Shastri A, Wassermann EM, Ziemann U, Lorberbaum JP, Nahas Z, Lomarev MP, George MS. BOLD-f MRI response to single-pulse transcranial magnetic stimulation (TMS). J Magn Reson Imaging 11: 569–574, 2000 [DOI] [PubMed] [Google Scholar]
- Boorman ED, O'Shea J, Sebastian C, Rushworth MF, Johansen-Berg H. Individual differences in white-matter microstructure reflect variation in functional connectivity during choice. Curr Biol 17: 1426–1431, 2007 [DOI] [PubMed] [Google Scholar]
- Buzsáki G. Rhythms of the Brain. New York: Oxford Univ. Press, 2006 [Google Scholar]
- Carmichael DW, Thornton JS, Rodionov R, Thornton R, McEvoy A, Allen PJ, Lemieux L. Safety of localizing epilepsy monitoring intracranial electroencephalograph electrodes using MRI: radiofrequency-induced heating. J Magn Reson Imaging 28: 1233–1244, 2008 [DOI] [PMC free article] [PubMed] [Google Scholar]
- Cavanna AE, Trimble MR. The precuneus: a review of its functional anatomy and behavioural correlates. Brain 129: 564–583, 2006 [DOI] [PubMed] [Google Scholar]
- De Martino F, Valente G, de Borst AW, Esposito F, Roebroeck A, Goebel R, Formisano E. Multimodal imaging: an evaluation of univariate and multivariate methods for simultaneous EEG/fMRI. Magn Reson Imaging 28: 1104–1112, 2010 [DOI] [PubMed] [Google Scholar]
- Debener S, Strobel A, Sorger B, Peters J, Kranczioch C, Engel AK, Goebel R. Improved quality of auditory event-related potentials recorded simultaneously with 3-T fMRI: removal of the ballistocardiogram artefact. Neuroimage 34: 587–597, 2007 [DOI] [PubMed] [Google Scholar]
- Debener S, Ullsperger M, Siegel M, Engel AK. Single-trial EEG-fMRI reveals the dynamics of cognitive function. Trends Cogn Sci 10: 558–563, 2006 [DOI] [PubMed] [Google Scholar]
- Dempsey MF, Condon B, Hadley DM. Investigation of the factors responsible for burns during MRI. J Magn Reson Imaging 13: 627–631, 2001 [DOI] [PubMed] [Google Scholar]
- Denslow S, Lomarev M, George MS, Bohning DE. Cortical and subcortical brain effects of transcranial magnetic stimulation (TMS)-induced movement: an interleaved TMS/functional magnetic resonance imaging study. Biol Psychiatry 57: 752–760, 2005 [DOI] [PubMed] [Google Scholar]
- Dewhirst MW, Viglianti BL, Lora-Michiels M, Hanson M, Hoopes PJ. Basic principles of thermal dosimetry and thermal thresholds for tissue damage from hyperthermia. Int J Hyperthermia 19: 267–294, 2003 [DOI] [PubMed] [Google Scholar]
- Esposito F, Mulert C, Goebel R. Combined distributed source and single-trial EEG-fMRI modeling: application to effortful decision making processes. Neuroimage 47: 112–121, 2009 [DOI] [PubMed] [Google Scholar]
- Freyer F, Becker R, Anami K, Curio G, Villringer A, Ritter P. Ultrahigh-frequency EEG during fMRI: pushing the limits of imaging-artifact correction. Neuroimage 48: 94–108, 2009 [DOI] [PubMed] [Google Scholar]
- Friston KJ, Fletcher P, Josephs O, Holmes A, Rugg MD, Turner R. Event-related fMRI: characterizing differential responses. Neuroimage 7: 30–40, 1998 [DOI] [PubMed] [Google Scholar]
- Fuggetta G, Pavone EF, Walsh V, Kiss M, Eimer M. Cortico-cortical interactions in spatial attention: a combined ERP/TMS study. J Neurophysiol 95: 3277–3280, 2006 [DOI] [PMC free article] [PubMed] [Google Scholar]
- Geyer S, Matelli M, Luppino G, Zilles K. Functional neuroanatomy of the primate isocortical motor system. Anat Embryol (Berl) 202: 443–474, 2000 [DOI] [PubMed] [Google Scholar]
- Hallett M. Transcranial magnetic stimulation: a primer. Neuron 55: 187–199, 2007 [DOI] [PubMed] [Google Scholar]
- Hesselmann G, Kell CA, Eger E, Kleinschmidt A. Spontaneous local variations in ongoing neural activity bias perceptual decisions. Proc Natl Acad Sci USA 105: 10984–10989, 2008 [DOI] [PMC free article] [PubMed] [Google Scholar]
- Hutton C, Bork A, Josephs O, Deichmann R, Ashburner J, Turner R. Image distortion correction in fMRI: a quantitative evaluation. Neuroimage 16: 217–240, 2002 [DOI] [PubMed] [Google Scholar]
- Ilmoniemi RJ, Virtanen J, Ruohonen J, Karhu J, Aronen HJ, Näätänen R, Katila T. Neuronal responses to magnetic stimulation reveal cortical reactivity and connectivity. Neuroreport 8: 3537–3540, 1997 [DOI] [PubMed] [Google Scholar]
- Jensen O, Colgin LL. Cross-frequency coupling between neuronal oscillations. Trends Cogn Sci 11: 267–269, 2007 [DOI] [PubMed] [Google Scholar]
- Johansen-Berg H, Rushworth MF, Bogdanovic MD, Kischka U, Wimalaratna S, Matthews PM. The role of ipsilateral premotor cortex in hand movement after stroke. Proc Natl Acad Sci USA 99: 14518–14523, 2002 [DOI] [PMC free article] [PubMed] [Google Scholar]
- Kaufman L, Kramer DM, Crooks LE, Ortendahl DA. Measuring signal-to-noise ratios in MR imaging. Radiology 173: 265–267, 1989 [DOI] [PubMed] [Google Scholar]
- Kriegeskorte N, Goebel R. An efficient algorithm for topologically correct segmentation of the cortical sheet in anatomical MR volumes. Neuroimage 14: 329–346, 2001 [DOI] [PubMed] [Google Scholar]
- Laufs H, Daunizeau J, Carmichael DW, Kleinschmidt A. Recent advances in recording electrophysiological data simultaneously with magnetic resonance imaging. Neuroimage 40: 515–528, 2008 [DOI] [PubMed] [Google Scholar]
- Massimini M, Ferrarelli F, Huber R, Esser SK, Singh H, Tononi G. Breakdown of cortical effective connectivity during sleep. Science 309: 2228–2232, 2005 [DOI] [PubMed] [Google Scholar]
- Mathewson KE, Gratton G, Fabiani M, Beck DM, Ro T. To see or not to see: prestimulus alpha phase predicts visual awareness. J Neurosci 29: 2725–2732, 2009 [DOI] [PMC free article] [PubMed] [Google Scholar]
- Miniussi C, Thut G. Combining TMS and EEG offers new prospects in cognitive neuroscience. Brain Topogr 22: 249–256, 2010 [DOI] [PubMed] [Google Scholar]
- Moisa M, Pohmann R, Ewald L, Thielscher A. New coil positioning method for interleaved transcranial magnetic stimulation (TMS)/functional MRI (fMRI) and its validation in a motor cortex study. J Magn Reson Imaging 29: 189–197, 2009 [DOI] [PubMed] [Google Scholar]
- Morel A, Liu J, Wannier T, Jeanmonod D, Rouiller EM. Divergence and convergence of thalamocortical projections to premotor and supplementary motor cortex: a multiple tracing study in the macaque monkey. Eur J Neurosci 21: 1007–1029, 2005 [DOI] [PubMed] [Google Scholar]
- Mullinger K, Brookes M, Stevenson C, Morgan P, Bowtell R. Exploring the feasibility of simultaneous electroencephalography/functional magnetic resonance imaging at 7 T. Magn Reson Imaging 26: 968–977, 2008a [DOI] [PubMed] [Google Scholar]
- Mullinger K, Debener S, Coxon R, Bowtell R. Effects of simultaneous EEG recording on MRI data quality at 1.5, 3 and 7 tesla. Int J Psychophysiol 67: 178–188, 2008b [DOI] [PubMed] [Google Scholar]
- Nöth U, Laufs H, Stoermer R, Deichmann R. Simultaneous electroencephalography-functional MRI at 3 T: an analysis of safety risks imposed by performing anatomical reference scans with the EEG equipment in place. J Magn Reson Imaging 35: 561–571, 2012 [DOI] [PubMed] [Google Scholar]
- Nunez PL, Srinivasan R. Electric Fields of the Brain: The Neurophysics of EEG (2nd ed.). New York: Oxford Univ. Press, 2005 [Google Scholar]
- Reithler J, Peters JC, Sack AT. Multimodal transcranial magnetic stimulation: using concurrent neuroimaging to reveal the neural network dynamics of noninvasive brain stimulation. Prog Neurobiol 94: 149–165, 2011 [DOI] [PubMed] [Google Scholar]
- Romei V, Brodbeck V, Michel C, Amedi A, Pascual-Leone A, Thut G. Spontaneous fluctuations in posterior alpha-band EEG activity reflect variability in excitability of human visual areas. Cereb Cortex 18: 2010–2018, 2007 [DOI] [PMC free article] [PubMed] [Google Scholar]
- Rosanova M, Casali A, Bellina V, Resta F, Mariotti M, Massimini M. Natural frequencies of human corticothalamic circuits. J Neurosci 29: 7679–7685, 2009 [DOI] [PMC free article] [PubMed] [Google Scholar]
- Rossi S, Hallett M, Rossini PM, Pascual-Leone A. Safety, ethical considerations, and application guidelines for the use of transcranial magnetic stimulation in clinical practice and research. Clin Neurophysiol 120: 2008–2039, 2009 [DOI] [PMC free article] [PubMed] [Google Scholar]
- Rossini PM, Barker AT, Berardelli A, Caramia MD, Caruso G, Cracco RQ, Dimitrijević MR, Hallett M, Katayama Y, Lücking CH, et al. Non-invasive electrical and magnetic stimulation of the brain, spinal cord and roots: basic principles and procedures for routine clinical application. Report of an IFCN committee. Electroencephalogr Clin Neurophysiol 91: 79–92, 1994 [DOI] [PubMed] [Google Scholar]
- Ruff CC, Bestmann S, Blankenburg F, Bjoertomt O, Josephs O, Weiskopf N, Deichmann R, Driver J. Distinct causal influences of parietal versus frontal areas on human visual cortex: evidence from concurrent TMS-fMRI. Cereb Cortex 18: 817–827, 2008 [DOI] [PMC free article] [PubMed] [Google Scholar]
- Ruff CC, Driver J, Bestmann S. Combining TMS and fMRI: from “virtual lesions” to functional-network accounts of cognition. Cortex 45: 1043–1049, 2009 [DOI] [PMC free article] [PubMed] [Google Scholar]
- Rushworth MF, Hadland KA, Paus T, Sipila PK. Role of the human medial frontal cortex in task switching: a combined fMRI and TMS study. J Neurophysiol 87: 2577–2592, 2002 [DOI] [PubMed] [Google Scholar]
- Sack AT. Transcranial magnetic stimulation, causal structure-function mapping and networks of functional relevance. Curr Opin Neurobiol 16: 593–599, 2006 [DOI] [PubMed] [Google Scholar]
- Sack AT, Kohler A, Bestmann S, Linden DE, Dechent P, Goebel R, Baudewig J. Imaging the brain activity changes underlying impaired visuospatial judgments: simultaneous FMRI, TMS, and behavioral studies. Cereb Cortex 17: 2841–2852, 2007 [DOI] [PubMed] [Google Scholar]
- Scheeringa R, Petersson KM, Oostenveld R, Norris DG, Hagoort P, Bastiaansen MC. Trial-by-trial coupling between EEG and BOLD identifies networks related to alpha and theta EEG power increases during working memory maintenance. Neuroimage 44: 1224–1238, 2009 [DOI] [PubMed] [Google Scholar]
- Shellock FG. Reference Manual for Magnetic Resonance Safety, Implants, and Devices. Los Angeles, CA: Biomedical Research Publishing Group, 2007 [Google Scholar]
- Strobel A, Debener S, Sorger B, Peters JC, Kranczioch C, Hoechstetter K, Engel AK, Brocke B, Goebel R. Novelty and target processing during an auditory novelty oddball: a simultaneous event-related potential and functional magnetic resonance imaging study. Neuroimage 40: 869–883, 2008 [DOI] [PubMed] [Google Scholar]
- Taylor PC, Nobre AC, Rushworth MF. Subsecond changes in top down control exerted by human medial frontal cortex during conflict and action selection: a combined transcranial magnetic stimulation electroencephalography study. J Neurosci 27: 11343–11353, 2007 [DOI] [PMC free article] [PubMed] [Google Scholar]
- Thut G, Ives JR, Kampmann F, Pastor MA, Pascual-Leone A. A new device and protocol for combining TMS and online recordings of EEG and evoked potentials. J Neurosci Methods 141: 207–217, 2005 [DOI] [PubMed] [Google Scholar]
- Thut G, Miniussi C. New insights into rhythmic brain activity from TMS-EEG studies. Trends Cogn Sci 13: 182–189, 2009 [DOI] [PubMed] [Google Scholar]
- Veniero D, Bortoletto M, Miniussi C. TMS-EEG co-registration: on TMS-induced artifact. Clin Neurophysiol 120: 1392–1399, 2009 [DOI] [PubMed] [Google Scholar]
- Walsh V, Ashbridge E, Cowey A. Cortical plasticity in perceptual learning: an fMRI study of mirror learning demonstrated by transcranial magnetic stimulation. Neuropsychologia 36: 45–49, 1998 [DOI] [PubMed] [Google Scholar]
- Walsh V, Ellison A, Ashbridge E, Cowey A. The role of the parietal cortex in visual attention–hemispheric asymmetries and the effects of learning: a magnetic stimulation study. Neuropsychologia 37: 245–251, 1999 [DOI] [PubMed] [Google Scholar]
- Wassermann E, Epstein C, Ziemann U. The Oxford Handbook of Transcranial Stimulation. New York: Oxford Univ. Press, 2008 [Google Scholar]
- Weiskopf N, Josephs O, Ruff CC, Blankenburg F, Featherstone E, Thomas A, Bestmann S, Driver J, Deichmann R. Image artifacts in concurrent transcranial magnetic stimulation (TMS) and fMRI caused by leakage currents: modeling and compensation. J Magn Reson Imaging 29: 1211–1217, 2009 [DOI] [PMC free article] [PubMed] [Google Scholar]
- Weisskoff RM. Simple measurement of scanner stability for functional NMR imaging of activation in the brain. Magn Reson Med 36: 643–645, 1996 [DOI] [PubMed] [Google Scholar]
- Weissman DH, Roberts KC, Visscher KM, Woldorff MG. The neural bases of momentary lapses in attention. Nat Neurosci 9: 971–978, 2006 [DOI] [PubMed] [Google Scholar]
- Yarmolenko PS, Moon EJ, Landon C, Manzoor A, Hochman DW, Viglianti BL, Dewhirst MW. Thresholds for thermal damage to normal tissues: an update. Int J Hyperthermia 27: 320–343, 2011 [DOI] [PMC free article] [PubMed] [Google Scholar]