

Abstract
The cerebellum has long been recognized to play an important role in motor adaptation. Individuals with cerebellar ataxia exhibit impaired learning in visuomotor adaptation tasks such as prism adaptation and force field learning. Both types of tasks involve the adjustment of an internal model to compensate for an external perturbation. This updating process is error driven, with the error signal based on the difference between anticipated and actual sensory information. This process may entail a credit assignment problem, with a distinction made between error arising from faulty representation of the environment and error arising from noise in the controller. We hypothesized that people with ataxia may perform poorly at visuomotor adaptation because they attribute a greater proportion of their error to their motor control difficulties. We tested this hypothesis using a computational model based on a Kalman filter. We imposed a 20-deg visuomotor rotation in either a single large step or in a series of smaller 5-deg steps. The ataxic group exhibited a comparable deficit in both conditions. The computational analyses indicate that the patients' deficit cannot be accounted for simply by their increased motor variability. Rather, the patients' deficit in learning may be related to difficulty in estimating the instability in the environment or variability in their motor system.
Keywords: ataxia, learning, reaching
the production of smooth, accurate movements in an unstable world or with a novel tool is a challenging problem for the brain. Accurate and fluid performance requires the development, maintenance, and flexible adjustment of an appropriate internal model, a process called motor adaptation. Insight into motor adaptation has come from two major experimental tasks: force field learning (Fine and Thoroughman 2006, 2007; Lackner and Dizio 1994; Shadmehr and Mussa-Ivaldi 1994; Taylor and Thoroughman 2007; Thoroughman and Shadmehr 2000) and visuomotor adaptation (Cheng and Sabes 2007; Fishbach and Mussa-Ivaldi 2008; Grafton et al. 2008; Krakauer et al. 2000, 2004; Mazzoni and Krakauer 2006). In both tasks, participants learn to make accurate movements in a novel environment.
Evidence from computational models, neurophysiology, and neuropsychological studies points to a critical role for the cerebellum in motor adaptation. Participants with cerebellar pathology have difficulty adjusting their behavior to respond to novel force fields (Maschke et al. 2004; Smith et al. 2006) or visuomotor perturbations (Martin et al. 1996a; Tseng et al. 2007; Werner et al. 2009), as well as exhibiting deficits in a range of other motor learning tasks (Diedrichsen et al. 2005; Morton and Bastian 2006).
Process models of sensorimotor adaptation have focused on error-based learning (Bastian 2008; Mazzoni and Krakauer 2006; Tseng et al. 2007). The error signal in adaptation tasks reflects the sum of multiple sources of information. These can be broadly divided into those arising within the controller and those arising from perturbations in the environment (or sensory estimates of the environment). In the presence of uncertainty about the source of the error, or equivalently about the value in making an adjustment, an optimal system should estimate how likely an error is to reflect a systematic change in the environment versus random, intractable events. If an error is more likely to be arising from a stable source within the environment, then the correction should be large and, consequently, learning should be faster. On the other hand, if the error is attributed to incorrigible noise within the controller itself, one would expect the system to adapt more slowly.
A similar credit assignment issue has been explored in a study designed to dissociate “relevant” and “irrelevant” errors (Wei and Körding 2009). The corrections observed following large random errors were disproportionately small compared with the corrections following small random errors. The authors propose that the credit for large errors is assigned to transient and therefore unstable perturbations of the environment. Given their random nature, the system discounts this evidence since it is not likely to be relevant in predicting future errors. Although this study provides an elegant task to address the attribution problem, its relevance for motor adaptation is not clear. In adaptation studies, the perturbations are not random but correlated from one trial to the next. In such situations, large errors are potentially more informative of a change in the environment, particularly because they often remain systematic from one trial to the next.
This notion is reflected in one of the key assumptions of the Kalman filter (Kalman 1960). The Kalman gain (which constrains the learning rate) is defined as the ratio of the variability in the system under observation relative to total variability. The latter includes noise in the measurement process itself. In a motor control context, this noise would be related to the variance in the motor control system. With certain assumptions, the Kalman filter provides an efficient and neurally plausible solution to a class of models based on linear dynamical systems, which can successfully capture performance during reach adaptation tasks (Cheng and Sabes 2006, 2007). A key feature of these models is that some portion of the error observed on one trial will be corrected on the very next trial (Thoroughman and Shadmehr 2000). Assuming that the input and the controller are following linear dynamics with Gaussian noise, the Kalman filter provides a linear update rule for optimal estimation and prediction. Indeed, during adaptation tasks performance conforms well to that predicted by a Kalman filter (Burge et al. 2008; but see Zarahn et al. 2008). A trial-by-trial analysis has been applied in previous adaptation studies examining the performance impairments observed in patients with cerebellar degeneration (Smith and Shadmehr 2005; Tseng et al. 2007). This work has revealed that patients show reduced adaptation rates compared with control participants.
However, these studies have not considered the problem of error attribution, and in particular how an increase in motor noise might affect adaptation. Patients with ataxia, the hallmark of cerebellar pathology, exhibit poor control of voluntary movements, even in well-learned, stable environments (Holmes 1917, 1939; Trouillas et al. 1997). In this report we develop a formal framework to examine the relationship between motor learning and motor control in patients with ataxia. To address this question, we reexamined the performance deficits observed on visuomotor adaptation tasks in patients with ataxia using a set of tasks that would allow us to evaluate error attribution during visuomotor adaptation. We obtained an independent estimate of motor variability and used this information in a Kalman filter model of performance during visuomotor adaptation. This approach allows us to gain insight into how individuals with ataxia attribute the observed errors during learning.
In the typical adaptation experiment, an external perturbation is abruptly introduced following a series of initial movements in a baseline condition. However, it is also possible to introduce the perturbation in a gradual manner; for example, a visuomotor rotation can be introduced in incremental steps. Notably, evidence from studies with neurologically healthy participants suggests that learning may be greater when a 90-deg rotation is introduced in gradual steps of 10 deg compared to when the 90-deg rotation is applied in a single abrupt step (Kagerer et al. 1997). Moreover, this manipulation may influence the participants' awareness of the environmental perturbation. In the abrupt condition, participants are more likely to be aware of the disturbance, even if they cannot accurately describe the change; in the gradual condition, their response to the perturbation is assumed to be implicit. Within the Kalman filter framework, this difference may impact the participants' estimate of the stability of the environment and thus lead to differences in learning rates.
The relevance of the issue of gradual vs. abrupt training schedule in adaptation is underscored by a study on force field adaptation involving individuals with cerebellar degeneration. Criscimagna-Hemminger et al. (2010) showed that the impairment was reduced when a force perturbation was administered gradually compared to when it was introduced abruptly. In the gradual condition, they learned to produce straight trajectories and demonstrated a strong aftereffect. In contrast, the learning impairment persisted throughout training when the force perturbation was administered abruptly. This dissociation suggests that extracerebellar structures may be sufficient to support learning in the gradual condition (see also Izawa et al. 2012).
In summary, the aim of the current study is twofold. First, we developed a model-based approach to examine the effect of increased motor noise on learning and performance, asking whether the increased motor variability of the ataxic participants can account for the difference in learning between the patients and matched control participants. Second, we extended the work of Criscimagna-Hemminger et al. (2010) to see if the distinction observed between gradual and abrupt force field perturbations also applies to visuomotor rotations.
METHODS
Participants.
Nine individuals with cerebellar ataxia were recruited for the study. This pool involves a heterogeneous sample of individuals, with a range of etiologies and degree of clinical impairment (see Table 1). For comparison purposes, we recruited a control group (n = 10), age- and education-matched to the patients. All participants provided informed consent and were compensated for their time in accordance with this protocol, which was approved by the Institutional Review Board at University of California, Berkeley.
Table 1.
Age, level of symptoms, and etiology of disease for the individuals with cerebellar degeneration
| Participant | Age, yr | ICARS | Diagnosis |
|---|---|---|---|
| 1 | 45 | 36.5 | Possible SCA 2 |
| 2 | 58 | 29 | Unknown |
| 3 | 72 | 17.75 | MSA-C |
| 4 | 55 | 47 | SCA 3 |
| 5 | 62 | 8 | SCA 6 |
| 6 | 61 | 23 | SCA 6 |
| 7 | 50 | 51 | SCA 6 |
| 8 | 76 | 65.5 | Unknown |
| 9 | 55 | 50 | SCA 3 |
The International Cooperative Ataxia Rating Scale (ICARS) score ranges from 0 to 100, with scores above 20 generally taken to indicate a moderate level of ataxia. SCA, spinocerebellar ataxia; MSA-C, cerebellar multiple-system atrophy.
Apparatus.
Participants made reaching movements by sliding their hand along the surface of a smooth table. Each participant wore a cotton glove to reduce friction between the hand and surface. A magnetic sensor (miniBIRD; http://www.ascension-tech.com) was fixed to the glove near the nail of the index finger, allowing us to record the position (X, Y, Z) of the hand at 138 Hz (resolution = 0.5 mm). An LCD monitor was horizontally positioned over the table, ∼17 cm above the surface. In this manner, the participant's view of his or her hand was occluded (see Fig. 1A). The apparatus was calibrated such that a cursor was displayed on the monitor to indicate the two-dimensional position of the sensor on the hand. The magnetic transmitter of the recording system was placed under the table. Pilot testing verified that with this arrangement the monitor did not produce interference or artifact in the recording system.
Fig. 1.

Experimental task and apparatus. A: participants were seated at a portable table. An LCD monitor was placed horizontally such that the participant was unable to directly observe his or her hand. The participant wore a magnetic position-sensing device (miniBird transmitter) such that real-time feedback of hand position could be presented on the LCD monitor. B: participants produced slicing movements from the start position, attempting to pass through a white line that appeared on a ring with a 10-cm radius. During the main experiment, feedback (in the form of a red line) was limited to the position at which the finger intersected the circle. At left, a sample trajectory is depicted where cursor position corresponded to hand position (no rotation). At right, a sample trial is depicted in which a 20-deg counterclockwise rotation was imposed on the cursor.
Task.
To begin each trial, the participant moved his or her hand into a starting position, indicated by a 1-cm circle. When the hand was more than 1 cm away from the center of the start location, a ring was presented, with the diameter equal to the distance from the center of the start circle. Moving toward the center reduced the radius of this circle. When the participant's hand was within the starting circle, the feedback was changed to a cursor dot, allowing the participant to precisely sense the position of the hand. This procedure allowed us to guide the participant to the start location while minimizing feedback that might provide information regarding the visuomotor transformation (similar to the procedure adopted in Cheng and Sabes 2007).
After the person maintained hand position within the starting circle for 500 ms, a white ring with a 10-cm radius was presented. This circle was intersected by a 1-cm radial line, defining the target location for that trial. The target was, on average, 15 deg to the right of straight ahead. To avoid using a fixed target location, we randomized the position with a range of ±15 deg. Participants were instructed to make a single outward reaching movement, involving rotation about the shoulder and elbow, attempting to slice through the ring at the target position. To orient the participants to the experimental apparatus, online feedback of the cursor was present in an initial set of trials. During the rest of the experiment, feedback was presented in the form of knowledge of results: a red line appeared at the moment the participant's outbound trajectory crossed the target ring (see Fig. 1B). We emphasized that the participants should use a slicing movement. This was done to minimize the demands on endpoint control and also to encourage the patients to move at speeds comparable to that of the control participants (Tseng et al. 2007). The feedback remained visible for 1,000 ms, after which participants were instructed to return to the starting circle.
Trials were grouped into four phases, with a short rest between each phase. After becoming oriented to the system with a series of reaches under continuous feedback, participants completed two baseline phases. The first was a feedback phase, during which they produced 100 reaches and the location of the red feedback line was veridical, indicating directional error. Next, participants performed a no-feedback phase, during which they produced 100 reaches without any feedback about their final position. Performance in these baseline phases was used to estimate participants' intrinsic sensorimotor noise.
Participants then completed two phases in which visuomotor adaptation was assessed (Fig. 2A). Testing was first conducted with a multistep rotation. This phase involved a series of miniblocks in which the rotation was introduced in a gradual manner and then washed out in a symmetrical, gradual manner. The first 32 trials involved reaches with veridical feedback. This was followed by epochs of 16 reaches in which the rotation was adjusted in 5-deg steps. There were 4 incremental steps with successive rotations of 5, 10, 15, and 20 deg. The 20-deg rotation was then repeated and followed by 5-deg decrements involving rotations of 15, 10, and 5 deg. The phase terminated with 32 more trials of veridical feedback (0-deg rotation).
Fig. 2.

Task design and performance during adaptation. A: the solid function depicts the structure of the experimental session. The first 200 trials consisted of reaching with veridical feedback, either with or without knowledge of results (KR). This was followed by 2 adaptation phases in which a visuomotor rotation was introduced gradually (multistep) or abruptly (single step). The rotations are depicted in terms of the required reach angle to maintain accurate performance. There were 2 probes of the single-step perturbation. Jagged lines show the raw data for 2 representative participants. B: group-averaged performance, along with the average model fit, in the multistep condition. C: group-averaged performance, along with the average model fit, in the single-step condition. In A–C, dark gray color corresponds to data from the control group (or participant) and light gray to data from the ataxic group (or participant).
We then tested the participants on a single-step rotation. This phase involved alternating between miniblocks of 32 trials with no rotation and miniblocks of 48 trials with an imposed 20-deg rotation. The rotation was introduced twice, with each miniblock sandwiched by no-rotation miniblocks. Note that participants actually completed 64 “washout” trials (and a short break) between the end of the last (5 deg) rotation miniblock in the multistep condition and the onset of the first (20 deg) rotation miniblock in the single-step condition.
We used a fixed order for all participants. By using an increment-decrement procedure in the multistep phase, we were able to minimize awareness of the applied perturbation as well as obtain a data set that is more optimal for our modeling approach (see below). A limitation with this procedure is that it does not allow us to measure an aftereffect, traditionally viewed as the strongest measure of overall learning (Bastian 2008). However, if we had abruptly turned off the rotation after the gradual increment phase, the participants would have experienced an abrupt rotation (to measure the aftereffect). We were concerned that this might influence performance in the single-step condition. For similar reasons, we opted to use the fixed order since initial training with the single-step condition might contaminate performance with the gradual perturbation by making subjects more aware of the possibility that the environment could become unstable.
Data analysis.
All data analysis and modeling were performed using MATLAB. To assess basic features of the movement, we computed two kinematic measurements for each block. Movement time was defined as the time from when the hand first left the start region until the participant moved beyond the target ring. Reach amplitude was defined as the Euclidean distance between the reversal position (which was beyond the target ring) and the initial hand position. Angular error on each trial was calculated as the angle between the start location, target, and visual endpoint feedback. To assess the amount of learning, we used asymptotic error, computed for each participant as the average angular error in the final 16 trials of the 20-deg rotation miniblocks. Two measures of residual error were obtained in the single-step condition, one from each miniblock. To facilitate our statistical modeling (see below), we assessed implementation variance by calculating heading variability, defined as the variance in angular error. This measure was limited to the two baseline phases.
We assessed participants' estimate of the external perturbation (the rotation) using a probabilistic model based on a Markov-chain process with constant injected noise (see Fig. 4A). The goal of the participant is to estimate the rotation on trial n, dn, using an error signal based on the difference between the target location and feedback indicating hand position. Assuming that the rotation follows linear dynamics with Gaussian noise, we obtained a linear update rule for estimating the rotation based on a Kalman filter. The key assumptions are that dn+1 is Gaussian given dn, with
| (1) |
where ωn ∼ N(0, σe2), implying that dn+1|dn ∼ N(Adn, σe2), where A is a parameter indicating the “memory” of the system and σe corresponds to the participant's estimate of environmental instability, and that xn, the perceived distance between the hand location and the feedback indicating hand position on trial n, is Gaussian given dn, with
| (2) |
where ε ∼ N(0, σx2), implying that xn|dn ∼ N(dn, σx2), where σx is the motor variability inherent in the participant (which we call the implementation variance). On each trial, the estimate of the rotation d̂n+1|n was updated following the Kalman filter update equations:
| (3) |
where the term un refers to the angular error, the perceived distance between the target location and the feedback of hand location (Cheng and Sabes 2007), and the Kalman gain (Kn) is based on the uncertainty at each step:
| (4) |
| (5) |
The uncertainty parameter σn|n−1 depends on the environmental instability parameter, σe:
| (6) |
Fig. 4.

Statistical modeling of the adaptation data. A: graphical representation of the Kalman filter used to model the data. Participants estimate the environmental displacement (d), and this is used to make a reaching movement, producing a new observation of the rotation (x). Based on the outcome observation, the state estimate is updated. The hyperparameter σe represents constant noise injected at every iteration, and the hyperparameter σx represents the implementation variance (estimated separately for each individual). B: a diagram of nested, hierarchical models used to assess the effects of group membership or perturbation condition. The null model assumes no group or condition differences, and, as such, requires only 2 free parameters, A and σe. At the next level, two 4-parameter models are considered, splitting the data by either group (ataxic or control) or condition (multistep or single step). The model fits were significantly improved with the addition of either set of parameters. At the final level, the full model with 8 parameters (2 groups × 2 conditions × 2 free parameters) led to a significant improvement in fit. C: parameters estimated from the full model. Solid bars represent parameter estimates during the single-step condition, and hatched bars represent estimates during the multistep condition. Top row indicates estimated group values for A and σe. Bottom row shows the computed values of the Kalman gain (Eq. 2), as well as the values of σx (independently measured in the no-feedback baseline block; the same value was used for both single-step and multistep conditions). On the basis of the best-fitting parameters, the ataxics show a lower value of A but a higher Kalman gain. Error bars for parameter estimates are calculated from the Hessian matrix.
Our focus here is on two sources of variability, implementation variance (σx) and environmental instability (σe), that influence the estimate of the rotation. We sought to evaluate how each of these is influenced by cerebellar ataxia and how this will impact performance in sensorimotor adaptation. Rather than treating σx as a free parameter that we estimate from the data obtained during the rotation phases, we used the no-feedback baseline phase to provide an independent estimate of implementation variance. This was determined uniquely for each participant.
To facilitate data fitting, we made two simplifying assumptions. First, we assumed that the system has settled into a steady state after the baseline phase. appendix a provides a derivation of the steady-state solution and a discussion of this assumption.
Second, we assumed that both A and σe are constant parameters for a given group. We recognize that this is an oversimplification since the patients (and controls) exhibit considerable within-group variability. However, individual estimates with the current modeling approach require large data sets, and this would prove unreasonably taxing for our patients and elderly controls (as well as introducing substantial noise due to fatigue). Thus we opted to estimate A and σe at the group level to improve the power for parameter estimation (Cheng and Sabes 2006). Despite this limitation, the current approach allows us to address the error attribution issue for understanding group differences between ataxics and controls on visuomotor adaptation.
Using maximum likelihood procedures, we found the best-fitting values of A and σe (treated as group parameters), which (along with subject-specific estimates of σx) predict each participant's performance. We evaluated the fits using a likelihood procedure adopted from Shumway and Stoffer (2006). This procedure allows the comparison of nested models (differing by the insertion of parameters; for example, differentiating by group or test condition, as shown in Fig. 4B) using a likelihood ratio test. More details of this procedure are presented in appendix b.
RESULTS
We first considered basic kinematic features during task performance, asking how these differ between the ataxics and controls (Fig. 3). As instructed, the ataxic patients moved relatively quickly (Fig. 3A). Nonetheless, they were not able to achieve the same movement speed as the control participants. On average, the controls covered the 10-cm radial distance in 156 ms (SD = 50 ms), whereas the ataxics covered the distance in 309 ms (SD = 136 ms). This difference was reliable [F(1,16) = 4.62, P < 0.05] as assessed in a repeated-measures ANOVA involving one between-subject factor, group (ataxic or control) and one within-subject factor, condition (baseline, single step, or multistep). The main effects of condition and the interaction approached significance [F(2,32) = 2.97, P = 0.07 and F(2,32) = 2.69, P = 0.08, respectively]. Reach amplitude (Fig. 3B) was also shorter for the controls compared with the ataxic group [F(1,16) = 7.90, P < 0.02], but there was no effect of condition [F(2,32) = 0.33, P > 0.7] and no interaction [F(2,32) = 0.72, P > 0.4]. Consistent with the “slicing” instructions, participants tended to terminate their movements 20–40% beyond the target circle.
Fig. 3.
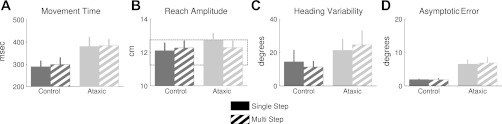
Kinematic and performance measures. Movement time (A) and reach amplitude (B), averaged over all phases of the experiment, plotted for the controls (dark gray) and ataxics (light gray). Ataxics moved slower and further than controls in both the single-step (solid bars) and multistep conditions (hatched bars). C: heading variability, based on the point that the reaching movement intersected the target ring. These data are only from the baseline phases and do not reflect variation resulting from the visuomotor rotation. D: asymptotic error, calculated over the final 16 trials with an imposed 20-deg rotation. The data for the single-step condition are restricted to the first probe (trials 75–90 in Fig. 2C). The ataxic group reached a lower asymptotic level of performance than the controls in both conditions.
To estimate implementation variance, we restricted our analysis of heading variability to the two baseline phases since this measure will be sensitive to learning during the rotation phases (Fig. 3C). Moreover, since endpoint error might alter performance, even in the absence of an external perturbation, we focused on the baseline phase in which visual feedback was withheld to obtain a “pure” estimate of heading variability. The heading variability data were analyzed with a 2 × 2 repeated-measures ANOVA with a between-subjects factor, group, and a within-subject factor, feedback (present or not). As expected, the ataxics were more variable than the controls [F(1,16) = 6.13, P < 0.05]. The mean variability for the ataxics was 29.2 deg2 (SD = 19.3 deg2), whereas the comparable value for the controls was 10.5 deg2 (SD = 7.5 deg2). Feedback did not significantly affect heading variability [F(1,16) = 0.26, P > 0.6], and the interaction term did not reach significance [F(1,16) = 2.56, P = 0.13].
Figure 2A depicts the reach angle of two representative participants, one control and one ataxic, over the full experiment. The group values for the multistep and single-step conditions are presented in Fig. 2, B and C, respectively. To assess overall performance on our visuomotor adaptation tasks (without utilization of a model-based analysis), we measured asymptotic error, defined as the mean cursor error during the final 16 trials at the full 20-deg rotation (Fig. 3D). Both groups showed considerable adaptation during this epoch. In the multistep condition, the mean asymptotic error values for the controls and ataxics were 1.9 deg (SD = 0.6 deg) and 6.5 deg (SD = 3.8 deg), respectively. In the first probe of the single-step condition, the values were 1.8 deg (SD = 1.2 deg) for the controls and 6.8 deg (SD = 5.0 deg) for the ataxics. These values were only slightly reduced during the second probe of the single-step condition (controls: 1.6 deg, SD = 1.6 deg; ataxics: 6.5 deg, SD = 4.2 deg), suggesting minimal savings in total learning.
To compare the two conditions, we limited our statistical analysis to the data from the multistep condition and the first probe of the single-step condition. The group effect was highly reliable [F(1,17) = 11.4, P < 0.005], indicating the ataxics exhibited poorer asymptotic performance than the controls. There was no effect of condition [F(1,17) = 0.04, P > 0.8] and no interaction [F(1,17) = 0.07, P > 0.7], suggesting that the ataxics were equally impaired whether the rotation was introduced gradually or abruptly.
We turn next to our model-based analysis. For model fitting, the implementation variance, σx, for each individual was operationally defined as the value of that participant's heading variability from the no-feedback phase. (We also fit the model using the noise estimate from the feedback phase and observed qualitatively similar results.) Four hierarchical models were tested (Fig. 4B). The first model, the null model, treated all participants as part of the same group and did not distinguish between the multistep and single-step conditions. This model was used to estimate a single value of A and σe, providing a point of comparison for two alternatives. Each of these yielded a pair of values for A and σe. In the group model, we fit separate parameter estimates for the ataxics and controls. In the condition model, we fit separate parameter estimates for the multistep and single-step conditions. Finally, in the full model, we allowed separate parameter estimates of A and σe for the two groups in each of the two conditions. By comparing nested models in this manner, we can ask if the fit is significantly improved by considering the participants' group affiliation, the condition under which adaptation occurs, or the combination of these factors.
Considering the first level of the hierarchy, the likelihood ratio test indicated that the fit was significantly improved when the data were separated by group [χ2(2) = 838.4, P < 0.001] or by condition [χ2(2) = 268.2, P < 0.001]. Further improvement in the fit was observed when either link to the next level of the hierarchy was included [condition to full: χ2(4) = 775.3, P < 0.001; group to full: χ2(4) = 205.1, P < 0.001]. Thus the model-based approach in which we use the data from the entire learning process confirms the group effect observed when we focused on performance at asymptote. However, it also reveals a significant effect of condition, with participants performing differently when adapting to gradual or abrupt perturbations.
Given that the full model provided the best fit, we next examined the parameter estimates and their implications on behavior (Fig. 4C). Parameter A represents the state memory across trials. Lower values of A will produce lower levels of asymptotic value of performance. Consistent with the data shown in Fig. 2, B and C, a lower estimate of A was obtained for the ataxics compared with the controls in both conditions. This indicates that the ataxics have greater difficulty maintaining a new estimate of the state required by the visuomotor perturbation, or equivalently, that the ataxics exhibited greater attraction to their own baseline performance. In addition, for both groups, the estimates of A were lower during the multistep condition compared with the single-step condition. This would be consistent with the hypothesis that with the introduction of a large perturbation, the participants gauge the environment to be less stable and thus place greater weight on recent observations relative to their past history.
Parameter σe represents the environmental instability associated with the rate of learning. If the implementation variance was fixed, increasing the value of σe would increase the Kalman gain and thus produce faster learning. The estimated value of σe for both groups is larger in the single-step condition compared with the multistep condition, indicating more rapid learning when the full perturbation is introduced all at once. More interestingly, the estimate of this parameter for the ataxics was, on average, higher than that for the controls. Paradoxically, this would suggest that the ataxics learn at a faster rate than controls.
To further explore this hypothesis, we also examined the Kalman gain. Note that we estimated σx from the no-feedback phase. If the ataxics optimally estimate their own increased movement variability, the Kalman gain should be lower for this group. Surprisingly, the ataxics had a higher Kalman gain. The increase in the estimate of σe for the ataxics overcompensates for their larger values of σx. When this is combined with their decreased state memory, the behavioral consequence is that the ataxics exhibit an overall lower level of performance despite the higher Kalman gain.
Our primary interest is to test whether the patients' impairment in performance in visuomotor adaptation can be entirely accounted for by their increased motor variance. The initial analyses described above led us to reject this hypothesis: we observed group differences in the estimated parameters of state memory as well as changes to the Kalman gain that were not compatible with increased motor noise. Note that the interpretation of these parameters depends, to a large extent, on their independence. It is possible that there is a trade-off between the estimated values of σe and A. This concern is especially relevant here given that the nested analysis relies on the assertion that these parameters have independent effects on the likelihood measure. To explore whether any possible dependence in these parameters might affect our rejection of our hypothesis, we evaluated the log likelihoods for the full parameter spaces of A and σe using a grid search.
Figure 5A shows heat maps for the log-likelihood surfaces (scaled to the maximal log likelihood for each condition to facilitate comparisons). The contours represent proportions of the maximal log likelihood. The noncircular contours indicate that there is some correlation between the two parameters. Figure 5C depicts σe as a function of A at the peak of the log-likelihood surface. The solid and dashed red curves (ataxic single step vs. multistep) are both below the blue curves (control single step vs. multistep), indicating that the most likely values of σe for ataxics are lower than those for controls, when A is assumed to be equal across groups. This suggests lower attribution of the ataxics' error to the environment in both the single-step and multistep conditions for all levels of A, although the group difference in the gradual condition is smaller.
Fig. 5.

Exploration of the parameter space. A: heat map of log likelihood as a function of A and σe (values scaled to the maximum log-likelihood value). Warmer colors indicate greater log likelihood, and cooler colors indicate less likely parameter combinations. The white cross indicates the best-fitting parameter values, whereas the white contours represent equally likely combinations in steps of 10% of the maximal value. The data are more likely explained by parameter combinations that fall along a diagonal. B: for a search over all values of σe, the most likely values of the memory term A are plotted. Controls show no difference between single-step and multistep adaptation in this analysis (curves overlap). Ataxics show a consistently lower value of A than the controls, with a slight effect of condition. C: for a search over all values of A, the most likely values of the stability parameter σe are plotted. For the same value of A, ataxics generally show a lower value of σe than controls (particularly for A close to 1), with a slight effect of condition. Controls show a lower value of σe during multistep blocks than during single-step blocks, which fits the hypothesis of lower estimates of environmental instability during gradual adaptation.
When the data are viewed this way, we would infer a lower Kalman gain for the ataxics. This stands in contrast to the initial analysis, where we observed a higher Kalman gain when A was treated as a free parameter. The contradiction in these two ways of evaluating the modeling data, higher Kalman gain for the ataxics when based on a single overall estimate vs. lower Kalman gain when the full space is explored, arises because of the nature of the linear dynamic systems model. With finite data, a slower learning rate is the only way to achieve a lower measure of residual error if the memory parameter (A) is the same. Since we believe that group differences in A and σe reflect meaningful differences between ataxics and controls, we favor treating them as separate free parameters. Nevertheless, the grid search analysis strongly indicates that the most likely values of σe are not identical for the ataxics and controls, even without assuming that A varies meaningfully. This result reinforces the conclusion that performance differences between the two groups cannot be fully explained by the patient's increased motor variance.
Figure 5B depicts A as a function of σe. Here, for all values of σe, the most likely values of A are lower for the ataxics, indicating that they always demonstrate a reduced level of asymptotic learning compared with controls.
DISCUSSION
A consistent observation in the motor learning literature is that patients with cerebellar ataxia show attenuated motor adaptation. Studies using several sensorimotor learning tasks have supported the idea that the cerebellum is essential for error-based learning, a process presumed to underlie the formation and refinement of internal models of the environment. In our study, we replicated the general deficit observed during the standard visuomotor adaptation paradigm, with an abrupt introduction of a visual rotation (the single-step condition). We furthermore observed a deficit when the rotation was introduced gradually (the multistep condition).
How are learning mechanisms affected by the presence of ataxia?
The primary goal of the current study was to explore the impact of ataxia on learning. We considered the hypothesis that the learning deficit may arise from an error attribution problem. That is, people with ataxia may be as efficient in learning as control participants but disproportionately attribute the observed errors to inherent variability in their motor system rather than to a disturbance of the external environment. This misattribution could be considered appropriate, because the most salient feature of their condition is the increase in motor variability.
We used a modeling approach based on the Kalman filter to test this hypothesis. According to the attribution hypothesis, we would have expected that after group (and individual) differences in implementation noise were accounted for, estimates of one or both learning-related parameters would have been similar for the ataxics and controls. However, the present data indicate that this hypothesis can be rejected. The best model fits required separate learning-related parameter values to be incorporated for the controls and ataxics in both the multistep and single-step conditions.
Previous work on the credit assignment problem has looked at the correction of random errors, with the emphasis on the response to small and large errors (Wei and Körding 2009). Although this work is illuminating in making salient the credit assignment issue, it is not clear how it would extend to the perturbations provided in the current study. As tested by Wei and Körding (2009), the problem can be rephrased as a controllability estimation problem. Under this framework, assigning small errors to one's own movement is equivalent to estimating that these errors are caused by controllable processes. In contrast, large transient errors are attributed to factors that are not under the participant's control. However, with a fixed perturbation, error magnitude is less likely to determine relevance. Were error size the sole determining factor, then as adaptation progresses and errors become smaller, the errors would become more “relevant” and trial-by-trial corrections should increase. This result is at odds with previous results suggesting that exponential models provide a good fit to adaptation data (Körding et al. 2007; Thoroughman and Shadmehr 2000; Thoroughman et al. 2007). Thus we elected to use a Kalman filter model, which naturally addresses error attribution through the interpretation of the Kalman gain.
The modeling results provide new insight into the patients' learning deficit. We expected to observe a lower Kalman gain estimate for these individuals if they attributed a relatively larger proportion of the observed error to their own control deficit (σx, estimated independently of the learning phases). Surprisingly, the estimate of the Kalman gain was higher for the ataxics compared with the controls. However, we believe the inference that the ataxics have a higher learning rate should be treated cautiously. The higher Kalman gain here is offset by a decrease in the memory term, suggesting that the rapid adjustments are rapidly forgotten. We note that the factors that affect the state memory term A are not understood. In the physical systems for which state-space models were originally created, A represents the equations of motion and, as such, is subject to the laws of physics. When dealing with the estimate of an internal state, however, the optimal specification is not known. Lowering the state memory term may be optimal if there is impairment in either control or learning, since this decreased memory would effectively de-emphasize recent experience.
We can think of two ways in which the counterintuitive observation of a higher Kalman gain in ataxia may arise. First, it is important to note that the brain's internal representation of σx is more accurately defined as the brain's estimate of implementation noise. Although we assume that this estimate is grounded in an individual's experience over a lifetime of movement, it is not certain that this is the case in individuals with neurological disorders. Testing our hypothesis requires making an explicit assumption that our measured value of σx reflects a consistent relationship between an individual's estimates of their internal motor noise and their actual motor noise, regardless of whether the individual has ataxia. It is possible that the patients underestimate their own motor noise, and this results in a higher Kalman gain. In other words, the patients may attribute a lower proportion of the error to their own actions (motor noise) than is optimal given their actual level of variability. A consequence would be that they attempt to correct for this intrinsic motor noise, even though this leads to suboptimal adaptation.
Alternatively, it is possible that ataxics do have an accurate estimate of their own motor variance, but the advantage in correcting for large error is sufficiently high that the credit assignment problem becomes irrelevant. By our model, this would imply that the patients are hypersensitive to environmental perturbations. This process could be inefficient for adapting a simple movement such as point-to-point reaching, given that the consequence of reaching errors are relatively minor. However, it may be beneficial for other types of movements. Standing and walking, as examples, are two everyday behaviors in which errors (i.e., falls) are extremely costly. Cerebellar ataxia has long been associated with problems in balance and locomotion (Holmes 1917, 1939; Trouillas et al. 1997). It may be that the increased incidence of extremely costly errors experienced during standing and walking pushes the motor system into a regime that, under linear Gaussian assumptions, is not efficient. Morton and Bastian (2004) have shown asymmetric generalization that is in accord with this hypothesis. Healthy participants exhibit greater generalization from a walking task to a reaching task compared with the reverse situation.
Importantly, the data collected in the current experiment cannot distinguish whether the patients with ataxia are hypersensitive to environmental errors or underestimating their own variability. Both scenarios make the same prediction with regard to error attribution. Nonetheless, we can conclude that the patients behave differently than controls even when accounting for their increased motor noise. Moreover, this difference is similar regardless of whether the visuomotor perturbation is introduced abruptly or gradually.
We recognize that our model is not exhaustive. There are surely other sources of noise that are not explicitly modeled, for example, noise in processing the position of the feedback signals (although this is likely to be very small; see Burge et al. 2008). These sources will affect our estimates of σe or σn (through changes in A because of our steady state assumption). Importantly, any group differences in these sources of variability would only corroborate our principal finding that differences in motor variability alone are insufficient to account for the learning deficit in ataxia.
Influence of error magnitude in force field learning and visuomotor adaptation.
An important constraint on cerebellar learning was proposed by Criscimagna-Hemminger et al. (2010). Consistent with previous studies (Maschke et al. 2004; Smith and Shadmehr 2005), patients with severe ataxia were impaired in adapting to a novel force field when the perturbation was introduced abruptly. However, these patients showed minimal impairment in adapting to the force field when the perturbation was introduced gradually. Our experiment entails a similar comparison in a visuomotor rotation task. Unlike the force field study, the ataxic group showed a similar deficit in both the single-step and multistep conditions, with their final level of adaptation markedly below that obtained by control participants.
There are a number of methodological differences between the current study and that by Criscimagna-Hemminger et al. (2010). First, we used a perturbation schedule in the multistep condition, which did not allow us to measure aftereffects, the “gold standard” for measuring adaptation across a variety of tasks (Bastian 2008; Martin et al. 1996b). However, we believe that our measure of asymptotic error is a sufficient proxy, especially when complemented by the modeling work. A qualitative agreement between asymptotic error and aftereffect has been reported by other researchers in visuomotor adaptation tasks (Taylor and Ivry 2011; Tseng et al. 2007). We opted to have a gradual deadaptation phase rather than measure an aftereffect to facilitate our modeling work. We assumed, a priori, that the participants' estimate of environmental instability would be affected once they experienced a large perturbation (as would be required if we abruptly terminated the rotation in the multistep condition). Second, we used a fixed order, whereas Criscimagna-Hemminger et al. (2010) counterbalanced the order of their tasks. Our design choice was motivated by the desire to maximize the robustness of the data for our modeling enterprise given our relatively smaller sample. We were concerned that the more easily detected perturbations experienced during the single-step condition might affect stability estimates during the multistep condition.
There is, of course, the task difference between force field adaptation and visuomotor adaptation. Assuming the differences are not due to the methodological issues discussed above, it is unclear why individuals with cerebellar degeneration are able to learn a novel force field under gradual conditions, but not a visuomotor rotation. An important methodological issue concerns the presence of online feedback. We limited feedback to information concerning heading direction, providing this only at the time that the finger crossed the target ring. In contrast, online feedback is unavoidable in force field adaptation, and as such, online error correction is possible. Individuals with ataxia have been previously shown to have similar deficits in visuomotor adaptation with or without online corrections (Tseng et al. 2007). Nonetheless, learning differences have been observed in visuomotor adaptation between conditions in which feedback is provided online and when it is limited to knowledge of results (Shabbott and Sainburg 2010).
Anatomically, the critical locus within the cerebellum may also differ for force field learning and visuomotor adaptation. Interestingly, performance on these two tasks is not correlated in individuals with cerebellar degeneration (Donchin et al. 2012; Rabe et al. 2009). In lesion-based analyses, deficits in force field learning are correlated with the degree of pathology in the anterior lobe, areas encompassing the primary motor representation in the cerebellum (Rabe et al. 2009). This region might be essential for representing the error signal or be involved in using the error to modify an internal model to guide future performance. In contrast, deficits in visuomotor adaptation are associated with pathology in more posterior regions of the cerebellum (Baizer et al. 1999; Martin et al. 1996a; Rabe et al. 2009). These regions have reciprocal connections with parietal and prefrontal cortex (Kelly and Strick 2003; Krienen and Buckner 2009; Middleton and Strick 2001; Prevosto et al. 2010; Ramnani et al. 2006). Such connections may be more important for certain forms of learning such as visuomotor adaptation and/or sequence learning (Spencer and Ivry 2009).
Summary.
In summary, we set out to test the explicit hypothesis that people with cerebellar ataxia have difficulty in sensorimotor adaptation because they attribute the experienced errors to their own motor noise. Our model-based analysis fails to support this hypothesis, suggesting that cerebellar degeneration produces a deeper problem with learning. The patients appear to be impaired in their ability to generate an accurate estimate of environmental instability, a prerequisite for learning. The results also indicate that, unlike force field learning, the cerebellar contribution to visuomotor adaptation does not appear to be sensitive to the manner in which the perturbation is introduced. Although these two tasks are paradigmatic examples of error-based learning, we have highlighted some key differences. The relevance of factors related to the magnitude/awareness of errors, online feedback, proprioception, and anatomy remain a challenge for future study.
DISCLOSURES
No conflicts of interest, financial or otherwise, are declared by the authors.
AUTHOR CONTRIBUTIONS
J.E.S., J.X., N.M.K., T.L.G., and R.B.I. conception and design of research; J.E.S., N.M.K., and R.B.I. performed experiments; J.E.S., J.X., N.M.K., and T.L.G. analyzed data; J.E.S., J.X., N.M.K., T.L.G., and R.B.I. interpreted results of experiments; J.E.S. and J.X. prepared figures; J.E.S. and J.X. drafted manuscript; J.E.S., J.X., T.L.G., and R.B.I. edited and revised manuscript; J.E.S., J.X., N.M.K., T.L.G., and R.B.I. approved final version of manuscript.
ACKNOWLEDGMENTS
This work was supported by National Institute of Child Health and Human Development Grant HD060306 and National Science Foundation Grant BCS 0726685.
APPENDIX A: STEADY-STATE ASSUMPTION
Setting the model to a steady state is equivalent to suggesting that the variance of state variables are constant after both the time update and measurement update, or σ2n+1|n = σ2n|n−1 and σ2n|n = σ2n−1|n−1. This removes the need to define a separate free parameter to represent the initial state variance. This is ecologically valid since all participants are well-practiced in general at making reaching movements. Given reasonable values of σe, A, and σx, any effect of any initial value of the system variance becomes miniscule after 10 trials. Thus we assume that the system will have achieved a stable state either during the unmodeled baseline phase or before the experimental initiation. Setting the system (Eq. 6) to steady state results in the following formula for the variance of the time update:
| (A1) |
Substituting for K gives
| (A2) |
Solving for σ2n+1|n, finally, results in
| (A3) |
Similarly, solving for the measurement update gives
| (A4) |
APPENDIX B: MAXIMUM LIKELIHOOD ESTIMATION
The likelihood of receiving two particular observations on two trials is the product of the likelihood of receiving each observation as individual trials. Since the current experiment involved many trials, the likelihood of any particular subject's performance is vanishingly small. To facilitate model comparison, the negative log likelihood was used. This is computationally convenient as the log likelihood of two trials is the sum of the log likelihood of the individual trials. Minimizing the negative of the log likelihood becomes equivalent to maximizing the likelihood.
Following the “innovation form” of Shumway and Stoffer (2006), the negative log likelihood of a single subject's performance is defined as
| (A5) |
The negative log likelihood of the group performance can then be computed by summing over the individual subjects. To test a set of two nested models, one can then use the likelihood ratio test. For sufficiently large samples of data, the negative logarithm of the likelihood ratio follows a χ2 distribution, with degrees of freedom equal to the number of additional parameters in the expanded model. Thus the difference between the negative log likelihoods of our model fits can be tested using the χ2 probability density function.
REFERENCES
- Baizer JS, Kralj-Hans I, Glickstein M. Cerebellar lesions and prism adaptation in macaque monkeys. J Neurophysiol 81: 1960–1965, 1999 [DOI] [PubMed] [Google Scholar]
- Bastian AJ. Understanding sensorimotor adaptation and learning for rehabilitation. Curr Opin Neurol 21: 628–633, 2008 [DOI] [PMC free article] [PubMed] [Google Scholar]
- Burge J, Ernst M, Banks M. The statistical determinants of adaptation rate in human reaching. J Vis 8: 20.1–20.19, 2008 [DOI] [PMC free article] [PubMed] [Google Scholar]
- Cheng S, Sabes P. Modeling sensorimotor learning with linear dynamical systems. Neural Comput 18: 760–793, 2006 [DOI] [PMC free article] [PubMed] [Google Scholar]
- Cheng S, Sabes P. Calibration of visually guided reaching is driven by error-corrective learning and internal dynamics. J Neurophysiol 97: 3057–3069, 2007 [DOI] [PMC free article] [PubMed] [Google Scholar]
- Criscimagna-Hemminger S, Bastian A, Shadmehr R. Size of error affects cerebellar contributions to motor learning. J Neurophysiol 103: 2275–2284, 2010 [DOI] [PMC free article] [PubMed] [Google Scholar]
- Diedrichsen J, Verstynen T, Lehman S, Ivry R. Cerebellar involvement in anticipating the consequences of self-produced actions during bimanual movements. J Neurophysiol 93: 801–812, 2005 [DOI] [PubMed] [Google Scholar]
- Donchin O, Rabe K, Diedrichsen J, Lally N, Schoch B, Gizewski ER, Timmann D. Cerebellar regions involved in adaptation to force field and visuomotor perturbation. J Neurophysiol 107: 134–47, 2012 [DOI] [PubMed] [Google Scholar]
- Fine M, Thoroughman K. Motor adaptation to single force pulses: sensitive to direction but insensitive to within-movement pulse placement and magnitude. J Neurophysiol 96: 710–720, 2006 [DOI] [PubMed] [Google Scholar]
- Fine M, Thoroughman K. Trial-by-trial transformation of error into sensorimotor adaptation changes with environmental dynamics. J Neurophysiol 98: 1392–1404, 2007 [DOI] [PubMed] [Google Scholar]
- Fishbach A, Mussa-Ivaldi F. Seeing versus believing: conflicting immediate and predicted feedback lead to suboptimal motor performance. J Neurosci 28: 14140–14146, 2008 [DOI] [PMC free article] [PubMed] [Google Scholar]
- Grafton S, Schmitt P, Van Horn J, Diedrichsen J. Neural substrates of visuomotor learning based on improved feedback control and prediction. Neuroimage 39: 1383–1395, 2008 [DOI] [PMC free article] [PubMed] [Google Scholar]
- Holmes G. The symptoms of acute cerebellar injuries due to gunshot injuries. Brain 40: 461–535, 1917 [Google Scholar]
- Holmes G. The cerebellum of man. Brain 62: 1–30, 1939 [Google Scholar]
- Izawa J, Criscimagna-Hemminger S, Shadmehr R. Cerebellar contributions to reach adaptation and learning sensory consequences of actions. J Neurosci 32: 4230–4239, 2012 [DOI] [PMC free article] [PubMed] [Google Scholar]
- Kagerer F, Contreras-Vidal J, Stelmach G. Adaptation to gradual as compared with sudden visuo-motor distortions. Exp Brain Res 115: 557–561, 1997 [DOI] [PubMed] [Google Scholar]
- Kalman RE. A new approach to linear filtering and prediction problem. Trans ASME J Basic Eng 82: 35–45, 1960 [Google Scholar]
- Kelly R, Strick P. Cerebellar loops with motor cortex and prefrontal cortex of a nonhuman primate. J Neurosci 23: 8432–8444, 2003 [DOI] [PMC free article] [PubMed] [Google Scholar]
- Kording K, Tenenbaum J, Shadmehr R. The dynamics of memory as a consequence of optimal adaptation to a changing body. Nat Neurosci 10: 779–786, 2007 [DOI] [PMC free article] [PubMed] [Google Scholar]
- Krakauer J, Ghilardi M, Mentis M, Barnes A, Veytsman M, Eidelberg D, Ghez C. Differential cortical and subcortical activations in learning rotations and gains for reaching: a PET study. J Neurophysiol 91: 924–933, 2004 [DOI] [PubMed] [Google Scholar]
- Krakauer J, Pine Z, Ghilardi MF, Ghez C. Learning of visuomotor transformations for vectorial planning of reaching trajectories. J Neurosci 20: 8916–8924, 2000 [DOI] [PMC free article] [PubMed] [Google Scholar]
- Krienen F, Buckner R. Segregated fronto-cerebellar circuits revealed by intrinsic functional connectivity. Cereb Cortex 19: 2497, 2485, 2009 [DOI] [PMC free article] [PubMed] [Google Scholar]
- Lackner J, Dizio P. Rapid adaptation to Coriolis force perturbations of arm trajectory. J Neurophysiol 72: 299–313, 1994 [DOI] [PubMed] [Google Scholar]
- Martin T, Keating J, Goodkin H, Bastian A, Thach W. Throwing while looking through prisms. I. Focal olivocerebellar lesions impair adaptation. Brain 119: 1183–1198, 1996a [DOI] [PubMed] [Google Scholar]
- Martin TA, Keating JG, Goodkin HP, Bastian AJ, Thach WT. Throwing while looking through prisms. II. Specificity and storage of multiple gaze-throw calibrations. Brain 119: 1199–1211, 1996b [DOI] [PubMed] [Google Scholar]
- Maschke M, Gomez C, Ebner T, Konczak J. Hereditary cerebellar ataxia progressively impairs force adaptation during goal-directed arm movements. J Neurophysiol 91: 230–238, 2004 [DOI] [PubMed] [Google Scholar]
- Mazzoni P, Krakauer J. An implicit plan overrides an explicit strategy during visuomotor adaptation. J Neurosci 26: 3642–3645, 2006 [DOI] [PMC free article] [PubMed] [Google Scholar]
- Middleton F, Strick P. Cerebellar projections to the prefrontal cortex of the primate. J Neurosci 21: 700–712, 2001 [DOI] [PMC free article] [PubMed] [Google Scholar]
- Morton S, Bastian A. Cerebellar contributions to locomotor adaptations during splitbelt treadmill walking. J Neurosci 26: 9107–9116, 2006 [DOI] [PMC free article] [PubMed] [Google Scholar]
- Morton SM, Bastian AJ. Prism adaptation during walking generalizes to reaching and requires the cerebellum. J Neurophysiol 92: 2497–2509, 2004 [DOI] [PubMed] [Google Scholar]
- Prevosto V, Graf W, Ugolini G. Cerebellar inputs to intraparietal cortex areas LIP and MIP: functional frameworks for adaptive control of eye movements, reaching, and arm/eye/head movement coordination. Cereb Cortex 20: 214–228, 2010 [DOI] [PMC free article] [PubMed] [Google Scholar]
- Rabe K, Livne O, Gizewski ER, Aurich V, Beck A, Timmann D, Donchin O. Adaptation to visuomotor rotation and force field perturbation is correlated to different brain areas in patients with cerebellar degeneration. J Neurophysiol 101: 1961–1971, 2009 [DOI] [PubMed] [Google Scholar]
- Ramnani N, Behrens T, Johansen-Berg H, Richter M, Pinsk M, Andersson J, Rudebeck P, Ciccarelli O, Richter W, Thompson A, Gross C, Robson M, Kastner S, Matthews P. The evolution of prefrontal inputs to the cortico-pontine system: diffusion imaging evidence from Macaque monkeys and humans. Cereb Cortex 16: 811–818, 2006 [DOI] [PubMed] [Google Scholar]
- Shabbott BA, Sainburg RL. Learning a visuomotor rotation: simultaneous visual and proprioceptive information is crucial for visuomotor remapping. Exp Brain Res 203: 75–87, 2010 [DOI] [PMC free article] [PubMed] [Google Scholar]
- Shadmehr R, Mussa-Ivaldi F. Adaptive representation of dynamics during learning of a motor task. J Neurosci 14: 3208–3224, 1994 [DOI] [PMC free article] [PubMed] [Google Scholar]
- Shumway RH, Stoffer DS. Time Series Analysis and Its Applications: With R Examples (2nd ed.). New York: Springer, 2006 [Google Scholar]
- Smith M, Ghazizadeh A, Shadmehr R. Interacting adaptive processes with different timescales underlie short-term motor learning. PLoS Biol 4: e179, 2006 [DOI] [PMC free article] [PubMed] [Google Scholar]
- Smith M, Shadmehr R. Intact ability to learn internal models of arm dynamics in Huntington's disease but not cerebellar degeneration. J Neurophysiol 93: 2809–2821, 2005 [DOI] [PubMed] [Google Scholar]
- Spencer RM, Ivry RB. Sequence learning is preserved in individuals with cerebellar degeneration when the movements are directly cued. J Cogn Neurosci 21: 1302–1310, 2009 [DOI] [PMC free article] [PubMed] [Google Scholar]
- Taylor JA, Ivry RB. Flexible cognitive strategies during motor learning. PLoS Comput Biol 7: e1001096, 2011 [DOI] [PMC free article] [PubMed] [Google Scholar]
- Taylor J, Thoroughman K. Divided attention impairs human motor adaptation but not feedback control. J Neurophysiol 98: 317–326, 2007 [DOI] [PubMed] [Google Scholar]
- Thoroughman K, Fine M, Taylor J. Trial-by-trial motor adaptation: a window into elemental neural computation. Prog Brain Res 165: 373–382, 2007 [DOI] [PubMed] [Google Scholar]
- Thoroughman K, Shadmehr R. Learning of action through adaptive combination of motor primitives. Nature 407: 742–747, 2000 [DOI] [PMC free article] [PubMed] [Google Scholar]
- Trouillas P, Takayanagi T, Hallett M, Currier R, Subramony S, Wessel K, Bryer A, Diener H, Massaquoi S, Gomez C, Coutinho P, Hamida B, Campanella G, Filla A, Schut L, Timann D, Honnorat J, Nighoghossian N, Manyam B. International Cooperative Ataxia Rating Scale for pharmacological assessment of the cerebellar syndrome. The Ataxia Neuropharmacology Committee of the World Federation of Neurology. J Neurol Sci 145: 205–211, 1997 [DOI] [PubMed] [Google Scholar]
- Tseng YW, Diedrichsen J, Krakauer JW, Shadmehr R, Bastian AJ. Sensory prediction errors drive cerebellum-dependent adaptation of reaching. J Neurophysiol 98: 54–62, 2007 [DOI] [PubMed] [Google Scholar]
- Wei K, Körding K. Relevance of error: what drives motor adaptation? J Neurophysiol 101: 655–664, 2009 [DOI] [PMC free article] [PubMed] [Google Scholar]
- Werner S, Bock O, Timmann D. The effect of cerebellar cortical degeneration on adaptive plasticity and movement control. Exp Brain Res 193: 189–196, 2009 [DOI] [PubMed] [Google Scholar]
- Zarahn E, Weston GD, Liang J, Mazzoni P, Krakauer JW. Explaining savings for visuomotor adaptation: linear time-invariant state-space models are not sufficient. J Neurophysiol 100: 2537–2548, 2008 [DOI] [PMC free article] [PubMed] [Google Scholar]