

Abstract
Objective
Characterize responses to a NNRTI-based antiretroviral treatment (ART) initiated during acute HIV infection (AHI).
Design
This was a prospective, single-arm evaluation of once daily, co-formulated emtricitabine/tenofovir/efavirenz initiated during AHI.
Methods
The primary endpoint is the proportion of responders with HIV RNA <200 copies/mL by week 24. We examined time-to-viral-suppression and CD8 cell activation in relation to baseline participant characteristics. We compared time-to-viral-suppression and viral dynamics using linear mixed effects models between acutely infected participants and chronically-infected controls.
Results
Between January 2005 and May 2009, 61 AHI participants were enrolled. Of participants whose enrollment date allowed 24 and 48 weeks of follow-up, 47 of 51 (92%) achieved viral suppression to <200 copies/mL by week 24, and 35 of 41 (85.4%) to <50 copies/mL by week 48. The median time from ART initiation to suppression <50 copies/mL was 93 days (range 14–337). Higher HIV RNA levels at ART initiation (p=0.02), but not time from estimated-date-of-infection to ART initiation (p=0.86), were associated with longer time-to-viral-suppression. The median baseline frequency of activated CD8+CD38+HLA-DR+ T-cells was 67% (range 40–95), and was not significantly associated with longer time to viral load suppression (p=0.15). Viremia declined to <50 copies/mL more rapidly in AHI than chronically-infected participants. Mixed model analysis demonstrated similar phase I HIV RNA decay rates between acute and chronically-infected participants, and more rapid viral decline in acutely-infected participants in phase II.
Conclusion
Once daily emtricitabine/tenofovir/efavirenz initiated during AHI achieves rapid and sustained HIV suppression during this highly infectious period.
Keywords: Acute HIV infection, NNRTIs, antiretroviral therapy, immune activation, viral dynamics
Introduction
Antiretroviral therapy (ART) initiated during acute HIV infection (AHI) remains controversial and incompletely characterized. Amidst this controversy, the benefit of ART as a prevention method has been difficult to explore despite evidence that a significant proportion of ongoing HIV transmission is related to AHI [1]. Since transmission is most strongly associated with plasma HIV RNA levels [2–5], very high viremia demonstrated during AHI markedly increases the likelihood for sexual transmission during this phase. A significant proportion of sexual transmission is driven by AHI, [6–9] with results from Uganda suggesting up to 43% of incident HIV is transmitted by acutely-infected individuals [7]. Virions circulating during AHI are genetically very similar to the infectious founder virus[10] and may also be highly infectious regardless of copy number [11].
Identifying individuals with AHI represents a critical opportunity to avert substantial onward transmission [12, 13] through secondary prevention efforts to modify high-risk behaviors [14], and possibly through ART initiation during this highly infectious period. While modeling studies suggest that treating a substantial proportion of HIV-infected individuals could curtail the HIV epidemic [15], the identification of acutely-infected individuals followed by rapid, efficacious treatment and retention-in-care may be essential if ART is to impact the spread of HIV.
Despite a lack of adequately powered studies to demonstrate sustained and measurable clinical or immunological benefit of ART in AHI, ART is sought by many acutely-infected individuals and recommended for consideration by some experts [16, 17]. Based upon higher prevalence of non-nucleoside reverse transcriptase inhibitor (NNRTI) resistance in treatment naïve patients [18], guidelines favor protease inhibitor (PI)-based regimens in AHI (DHHS guidelines, 2008). However, since ART failure associated with pill and adherence fatigue ranks among leading concerns with ART use in AHI, rapid initiation of the simplest fixed-dose combination (FDC) therapy which can be modified once genotype data are available warrants investigation in this setting. In addition to adherence advantages with once-daily, FDC tenofovir, emtricitabine and efavirenz (Atripla©) used in this study, efavirenz-based regimens have demonstrated superiority to some PI-based regimens in naïve, chronically-infected patients and more rapid viral suppression [19]. Clinicians face balancing the benefits of rapid initiation of uncomplicated therapy with initiating more cumbersome therapy or the costs of the delay to ensure the most appropriate therapy based on resistance testing.
We characterized immunologic and virologic responses to a once-daily, NNRTI-based regimen initiated during AHI. Since activation of CD8+ cells has been associated with HIV disease pathogenesis [20, 21], we also characterized levels of CD8+CD38+HLADR+ cell activation during AHI and determined if levels were associated with time-to-viral-suppression. We compared HIV RNA dynamics following initiation of efavirenz-based ART between participants with AHI and chronically-infected individuals. Our primary goal was to demonstrate that we could identify acutely-infected individuals, promptly administer simple, effective ART with minimal consequences due to transmitted drug resistance, rapidly suppress HIV-1 and retain patients in care.
Methods
This study is a single-arm evaluation of once daily, FDC emtricitabine, tenofovir and efavirenz administered to AHI participants enrolled between January 2005 and May 2009. AHI is defined as a negative or indeterminate enzyme immunoassay (EIA) or a negative HIV RNA test within 45 days of enrollment plus a reproducibly detectable HIV by amplification methods. Baseline genotypes were obtained on all participants at enrollment. Virologic failure was defined as: i) failure to suppress to <200 copies/mL by week 24 [22], and ii) for participants with the potential to reach week 48, HIV RNA >50 copies/mL at week 48. HIV RNA was measured using the Roche Amplicor Monitor ultrasensitive assay, version 1.5 with a 50 copies/mL lower limit of detection prior to December 2008, and thereafter using the Abbott RealTime HIV-1 assay with a 40 copies/mL lower limit of detection. Acute retroviral syndrome (ARS) symptom data were collected via standardized forms and included fever, headache, night sweats, weight loss, myalgias, arthralgias, fatigue, rash, odynophagia, lymphadenopathy, oral candidiasis, mouth ulcers/sores, cough, loss of appetite, nausea/vomiting, diarrhea and abdominal pain in the 8 weeks before AHI diagnosis. Estimated-date-of-infection was calculated as 14 days prior to onset of symptoms consistent with ARS [23]. The level of circulating CD8+HLA-DR+CD38+ T cells was measured in fresh blood samples collected in EDTA tubes by flow-cytometry. The samples will be collected at enrollment, six month post-initiation of therapy, and every six months thereafter. In order to identify the circulating activated CD8+ cells, we used the following panel of antibody: aCD3-PerCP; aCD8_FITC; aHLA-DR-APC: and aCD38-PE. The samples were acquired using a 4-color Calibur flow cytometer instrument (Becton Dickinson, San Jose, CA). The frequency of activated CD8+ T-cells defined as CD38+HLA-DR+ cells measured by flow cytometry was compared between AHI participants and a seronegative cohort using two sample T-test statistics. The study was approved by the University of North Carolina at Chapel Hill (UNC) and Duke University Institutional Review Boards. All participants provided written informed consent.
The historical chronic cohort is composed of a random sample of 92 chronically-infected participants of naïve ART studies with efavirenz-based regimens, who provided written informed consent to participate in the UNC Center for AIDS Research (CFAR), Clinical and Research Database and the Duke University Medical Center HIV Samples Repository and Database. Individuals in the historical cohort must have initiated an efavirenz-based regimen with a dual NRTI backbone of tenofovir/emtricitabine, zidovudine/lamivudine or abacavir/lamivudine and had HIV RNA measured within 30 days prior to ART start.
We examined time-to-viral-suppression among AHI participants in relation to baseline characteristics using the Kaplan Meier method and multivariate Cox proportional hazards regression. Time-to-viral-suppression was defined as the time to HIV RNA <50 copies/mL after ART initiation. Exposures included baseline CD8+ cell activation, duration from estimated-date-of-infection until treatment, and baseline HIV RNA level. We compared time-to-viral-suppression between AHI participants and chronically-infected participants. In both analyses, participants were censored if they stopped treatment, were lost to follow-up or at their last visit if before week 24. The Kaplan Meier method was used to compare time-to-viral-suppression between groups. Multivariate proportional hazards regression was used to estimate hazard ratios, controlling for baseline HIV RNA, CD4 count and age. The final model was built using backwards elimination with a 10% change in estimate criteria for retaining confounding variables, and was adjusted for baseline log10HIV RNA and CD4 count. Log-rank tests were used to test differences in suppression times between groups. We performed a linear test for trend to determine factors associated with baseline frequency of activated CD8+ cells. Adjusted hazard ratios and 95% confidence intervals were calculated for activated CD8+ cells, controlling for baseline log HIV RNA.
We fit linear mixed effects regression models with random intercepts and slopes to examine the effect of treatment on HIV RNA levels among and between AHI participants and chronically-infected patients. We extended the mixed effects model allowing for an inflection point to separate the initial and subsequent phases of decay in plasma HIV RNA levels, and to account for left and right censoring due to lower and upper detection limits. We also tested a model in which the end of phase I decay was modeled independently in acute and chronic participants, resulting in a very similar duration of phase I decay and similar HIV RNA levels at the inflection point. The model with a single inflection point from 1st to 2nd phase decay for acutely- and chronically-infected patients resulted in a better fit with the data. Time zero was defined as the date of ART initiation. Only chronically-infected participants with baseline HIV RNA levels between −30 days and time zero and at least one HIV RNA measurement within 14 days following ART initiation were included in this analysis. Only AHI participants with a baseline HIV RNA level between −7 days and time zero, and at least one additional HIV RNA measurement within 14 days of starting ART were included. HIV RNA levels until a participant stopped an efavirenz-containing regimen or reached week 48 were included. For two piece models, we assumed the same estimated inflection point at 10 days for both acute and chronic participants. The three random effects considered can be summarized as follows: (1) random intercepts, ai; (2) random slopes from time zero until the inflection point, bi; and (3) random slopes from the inflection point until the participant’s last HIV RNA measurement or end date, ci. All analyses were conducted using SAS version 9.2 (SAS institute, Cary, NC). The finite sample corrected Akaike Information Criterion (AICC), provided from SAS NLMIXED output as a measure of goodness-of-fit (the smaller the AICC, the better the fit.) was used to select whether to include an inflection point and the number of random effects. Detailed description of the linear mixed effects regression models and the likelihood function for the lognormal random effects model with left and right censoring is available (see Appendix).
Results
Sixty-one acutely-infected participants enrolled on study. The median age was 30 years, most (89%) were men who have sex with men (MSM), and approximately half were white (Table 1). Ninety-eight percent reported at least one ARS-associated symptom, with a median of 8 (range 0–15) symptoms reported. In the 8 weeks preceding AHI diagnosis, 15% had a documented sexually transmitted infection.
Table 1.
Baseline demographic and clinical characteristics of participants with acute HIV infection.
| Total N = 61 | |
|---|---|
| Demographic Characteristics | N (%) or Median (range) |
| Age (years) | 30 (18–66) |
| Sexual risk groupa | |
| Female | 6 (10) |
| Heterosexual Male | 6 (10) |
| MSM | 49 (80) |
| Race/ethnicity | |
| White, Non-Hispanic | 32 (52) |
| White, Hispanic | 1 (2) |
| African American | 27 (44) |
| Asian | 1 (2) |
| Symptoms | 60 (98) |
| STD ≤8 weeks prior to diagnosis | 9 (15) |
| Seronegative at ART start | 5 (8) |
| Number of symptoms | 8 (0–15) |
| Viral load (copies/mL) | |
| Initial | 173,150 (399–14,538,865) |
| Peak | 707,910 (12,803–84,545,454) |
| CD4 (cells/mm3) | |
| Baseline CD4 (cells/mm3) | 541 (13–1012) |
| Nadir CD4 (cells/mm3) | 425 (13–851) |
| Time, days | |
| Infection to ART | 43 (22–103) |
| Diagnosis to ART start | 19 (4–41) |
| ART start to viral load <50 copies/mLc | 93 (14–337) |
| ART start to viral load <200 copies/mL | 75 (10–239) |
Based on sex of reported partners
Peak HIV RNA levels prior to study enrollment were included when available
54 subjects had suppressed to VL<50 and VL<400 and were included in analysis.
Only 4 (7.8%) of 51 participants with the potential to reach week 24 met criteria for treatment failures. One participant was lost to follow-up, one terminated ART at week 12, another demonstrated isolated, low viremia at week 24 preceded and followed by viral suppression, and one had a HIV RNA level >200 copies/mL but <1000 copies/mL at week 24 (see below). Among the 4 treatment failures, none had baseline resistance to efavirenz, and only one had mutations (69S and 70R) associated with NRTI resistance. Among 41 participants with the potential to reach week 48, 35 (85.4%) demonstrated suppression to <50 copies/mL. Of 6 participants without documented suppression, 3 were lost to follow-up, 2 demonstrated isolated viremia preceded and followed by durable viral suppression, and one had a HIV RNA level of 54 copies/mL.
Among 61 participants enrolled, 9 (14.8 %) stopped or changed their initial study regimen. One discontinued ART at week 12, and was followed off treatment. Another participant interrupted ART due to dizziness after week 24 following suppression to <50 copies/mL, but re-suppressed after restarting the study regimen. Two other participants discontinued efavirenz due to side effects; one secondary to rash and another with depressed mood, fatigue and gastrointestinal upset. Both participants switched to FDC tenofovir/emtricitabine with a boosted PI. One participant underwent ART intensification with lopinavir/ritonavir added to the study regimen due to HIV RNA of 1489 copies/mL at week 8, and was switched to tenofovir/emtricitabine, ritonavir-boosted darunavir and zidovudine with HIV RNA of 376 copies/mL at week 24 without additional genotype data due to low viremia, and subsequently suppressed to <50 copies/mL at week 36.
Four of 61 (6.6%) participants had at least one mutation on baseline genotype associated with resistance to NNRTIs. Two participants had the K103N mutation, one had the K103S and one demonstrated the Y181C mutation. All four subjects were switched to FDC tenofovir/emtricitabine with ritonavir-boosted atazanavir. Two participants with baseline NNRTI resistance suppressed to <200 copies/mL at week 8 following genotype-guided change in ART; one was subsequently lost to follow-up before week 48, and the other maintained HIV RNA <50 copies/mL at week 48. The other 2 subjects with baseline resistance suppressed to <200 copies/mL by week 16 following a change in their ART regimen, and maintained HIV RNA <50copies/mL at week 48.
The median initial HIV-1 RNA level for AHI participants was 173,150 copies/mL (range 399–14,538,865), and the median highest observed HIV RNA level was 707,910 copies/mL (range 12,803–84,545,454). The median delay from estimated-date-of-infection to ART start was 43 days (range 22–103), and the median time from ART initiation to viral suppression <50 copies/mL was 93 days (range 14–337) (Figure 1A). Higher viremia at ART initiation (p=0.02) (Figure 1A), but not time from estimated-date-of-infection to ART start (p= 0.86) was associated with a longer time-to-viral-suppression.
Figure 1.
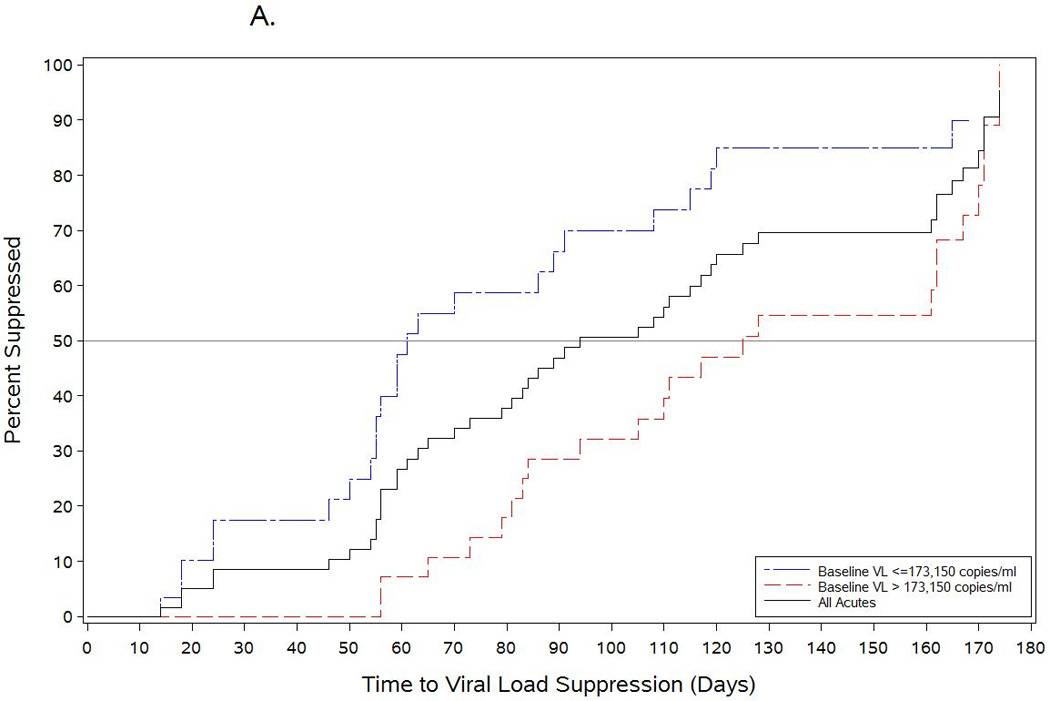
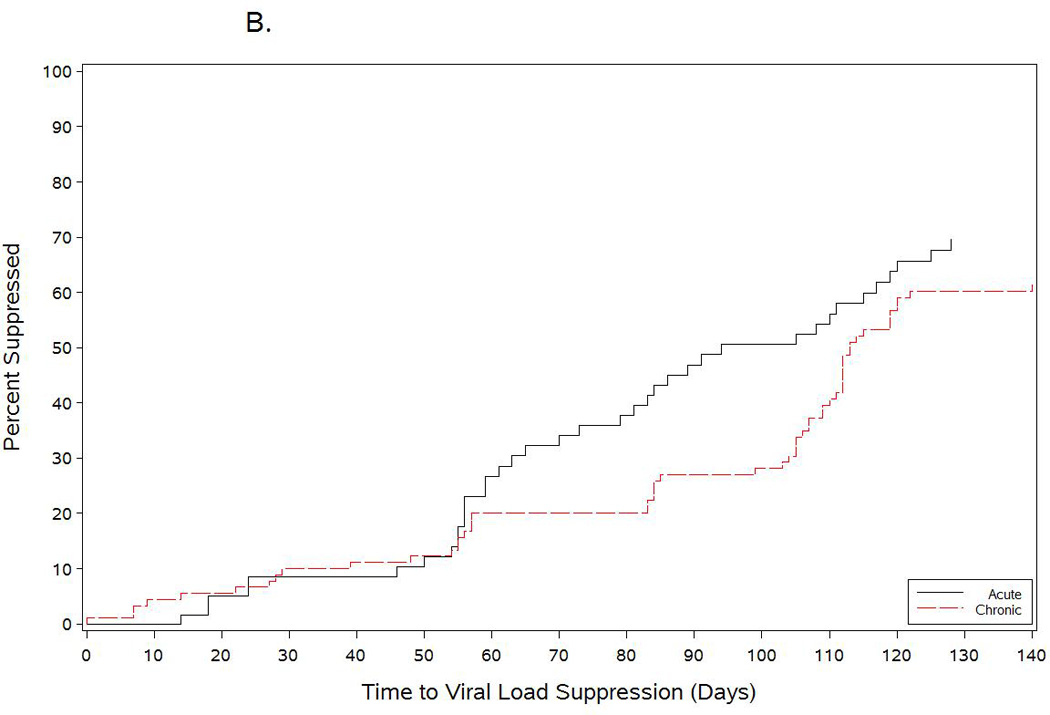
Time to viral load suppression among acutitely-infected participants who initiated antiretroviral therapy during acute HIV infection compared with chronically infected patients starting an efavirenz-based regimen. The black line in Figure 1A shows the time-to-viral-suppression to <50 copies/mL among all acutely infected participants started on antiretroviral therapy during the acute period. The blue and red lines show the time-to-viral-suppression <50 copies/mL stratified by baseline HIV RNA levels among acutely-infected subjects who started antiretroviral therapy. Figure 1B shows the comparison of time-to-viral-suppression with a NNRTI-based regimen between participants starting antiretroviral therapy during acute HIV infection and chronically-infected participants starting treatment during established HIV infection.
Baseline characteristics of the AHI and chronically-infected cohorts are listed in Table 2. The chronically-infected cohort was older, and had fewer MSM (39% versus 80% among AHI participants.) Median CD4 count at ART initiation was 180 cells/mm3 among chronically-infected participants versus 541 cells/mm3 among AHI participants. Median HIV RNA level at ART initiation was higher among the AHI cohort versus the chronic cohort (5.2 versus 4.8 log10 copies/mL, respectfully.) AHI participants achieved viral suppression more rapidly than chronically-infected participants in unadjusted analysis (HR=1.41; 95%CI: 0.97, 2.06) (Figure 1B), a trend which remained after adjustment for baseline log10 HIV RNA and CD4 count (adjusted HR=1.32; 95%CI: 0.79, 2.23) (Figure 1B).
Table 2.
Acute vs. Historical Chronic Cohort
| Acutes | Chronics | |||
|---|---|---|---|---|
| N | % | N | % | |
| Total | 61 | 100% | 92 | 100% |
| HIV RNA <50 copies/mL by week 24 | 48 | 79% | 66 | 72% |
| Sexual Risk Group | ||||
| Female | 6 | 10% | 23 | 25% |
| Heterosexual Male | 6 | 10% | 12 | 13% |
| MSM | 49 | 80% | 34 | 37% |
| Unknown | - | - | 23 | 25% |
| Race/Ethnicity | ||||
| White, Non-Hispanic | 32 | 52% | 29 | 32% |
| Other | 29 | 48% | 63 | 68% |
| IVDU | 2 | 3.2% | 3 | 3% |
| Median | IQRb | Median | IQR | |
| Age at ART start | 30 | (24–39) | 44 | (34–53) |
| Time from diagnosis to ART start | 19 | (14–24) | 138a | (71–398) |
| Log10 HIV RNA at ART start | 5.2 | (4.5–5.8) | 4.8 | (4.5–5.4) |
| CD4 at ART start | 541 | (343–644) | 184 | (52–311) |
| Days to HIV RNA <50 copies/mL | 93 | (59–162) | 117 | (83–168) |
Missing one observation
IQR = interquartile range
We performed a mixed model analysis of viral dynamics using data from 57 of 61 AHI participants (4 did not have HIV RNA measured within 14 days of ART start) and 33 of 92 chronically-infected participants that met HIV RNA sampling criteria. An AICC goodness-of-fit test indicated the model with the best fit included an inflection point and all three random effects (Figure 2). The inflection point was estimated to be 10 days (95% CI: 9, 11 days) after ART initiation. The mean plasma HIV RNA of AHI participants and chronically-infected individuals at the inflection point were similar, log10HIV RNA=3.2 (1,471 copies/ml) and log10HIV RNA=3.1 (1,254 copies/ml), respectively. The mean slope of log10HIV RNA during the first phase of decay was −2.1 over 10 days in both AHI and chronically-infected participants.
Figure 2.
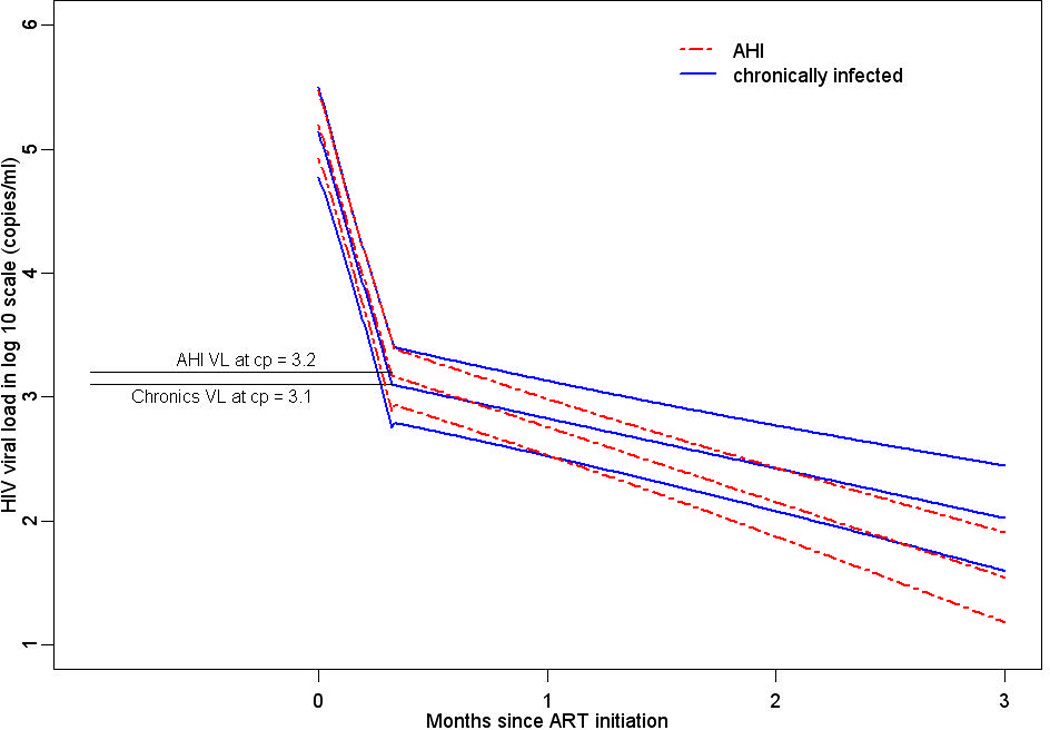
Estimates of log10HIV RNA from a nonlinear mixed model from 0 to 11 months following ART initiation among acutely- and chronically-infected participants with one inflection point at 10 days.
The log10HIV RNA mean slope for both AHI and chronically-infected participants after the inflection point was negative, but much more gradual. During phase II decay, the slope of log10HIV RNA per week was significantly steeper for AHI versus chronically-infected participants, −0.14 (95%CI: −0.15, −0.13) log10 versus −0.094 (95%CI: −0.11, −0.08) log10 decrease per week, respectively (p=0.02). Statistical analysis excluding 14 AHI participants without HIV RNA measured on the exact date of ART start were essentially the same (results not shown). Variance estimates reflect a high level of heterogeneity between participants, the largest of which was the variation between phase I slopes.
The median frequency of CD8+CD38+HLADR+ T-cells among AHI participants at baseline was 67% (range 40–95) (Figure 3A), and was significantly higher compared with a median frequency of 9% (range 3–22) among a seronegative cohort (Figure 3B). High frequency of activated CD8+ T-cells among AHI participants was associated with lower baseline CD4 count (p=0.05) and higher baseline HIV RNA (p=0.03). However, frequency of CD8+CD38+HLADR+ T-cells >67% was not significantly associated with longer time-to-viral-suppression (Adjusted HR=0.74; 95%CI: 0.33, 1.59). There was a substantial and significant decline in immune activation as measured by CD8+CD38+HLADR+ frequency from baseline to week 12 among AHI participants on therapy (p<0.0001) compared to untreated acute patients, but levels remained significantly higher than uninfected controls (p<0.0001) (Figure 3B).
Figure 3.


Figure 3A shows immune activation dynamics among acutely-infected participants from the time of antiretroviral initiation. Figure 3B compares levels of immune activation among acutely-infected individuals by time since antiretroviral initiation with a seronegative cohort.
Discussion
Our findings indicate that once daily emtricitabine/tenofovir/efavirenz initiated during AHI achieves rapid and sustained HIV suppression despite initial high viremia. Ninety-two percent of AHI participants suppressed to <200 copies/mL by week 24, and 85% with the potential to reach week 48 remained suppressed. Our work supports prior studies of ART efficacy in AHI. In one study, all 12 acutely-infected participants suppressed to <50 copies/mL by week 24 [24], and 94% of AHI participants remained suppressed ≤50 copies/mL at one year in another study [25]. In further work, 97% of subjects with acute or early HIV infection suppressed by a median of 11 weeks, and there was no difference in time-to-suppression between PI- and NNRTI-based regimens [26].
The prevalence of NNRTI resistance in our cohort was low, and did not prevent rapid and sustained viral suppression with ART modification based on baseline genotype. This result suggests that prompt initiation of ART during AHI need not be delayed pending baseline genotype information, but supports obtaining genotypes on all AHI patients, to guide rapid ART changes if needed. A one-pill, once-a-day regimen facilitated rapid initiation of ART in out AHI participants. However, our study cannot address the long-term impact of initial NNRTI-based therapy with prompt ART modification per resistance information versus a more complex initial regimen less likely to be affected by baseline resistance.
Not surprisingly, higher HIV RNA levels at ART initiation were associated with longer time-to-viral-suppression among AHI participants. However, given substantially higher viremia at or prior to ART initiation among AHI participants, a trend towards a shorter time to virologic suppression among AHI versus chronic participants was unexpected. We used linear mixed effects regression models to further explore viral decay on therapy between acutely and chronically-infected individuals. This analysis confirmed initial rapid decline in viremia following ART initiation during AHI similar to the declines in chronic infection. The model with the best fit incorporated an estimated inflection point at day 10 for both acute and chronic participants, consistent with a phase I and phase II decay. Similar HIV RNA levels at the inflection point for both acute and chronic participants suggest the size of the pool of cells comprising second (and later) phases of decay is also similar. We demonstrated a steeper decline in HIV RNA in phase II decay among AHI participants versus chronic participants, supporting our finding of earlier time-to-viral-suppression among AHI participants. A shorter half-life of T cells in pre-integration latency in AHI and/or lower concentrations of infected longer-lived cells (i.e. macrophages) due to the shorter duration of infection in AHI compared to chronic infection are possible explanations. The shorter half-life of pre-integration T cells may be due to the higher activation state during AHI and more rapid division of these cells. Finally, more effective HIV specific immune responses in AHI may also contribute to a shorter half-life.
Our findings support prior work showing a two phase HIV RNA decline with acute infection [27], and similar first phase decay among AHI versus chronically-infected participants [27–29]. The latter suggests the half-life of infected, activated T cells is similar in acute and chronic patients during phase I decay. Our results are in contrast with one study that showed a, slower HIV RNA decline on ART in primary versus chronic HIV infection, which was attributed to immature immune responses resulting in slower decay of virion-producing infected cells [30]. Our results showing a rapid decline in HIV RNA with ART are consistent with reports of strong and early HIV specific T-cell responses during AHI [27, 31, 32].
The mixed model analysis was limited by the small group of chronically-infected participants who met HIV RNA criteria from ART initiation, and the timing of HIV RNA sampling in the immediate period following treatment among both acutely- and chronically-infected participants. Nevertheless, our findings of a steep viral decline following ART initiation during AHI and sustained efficacy after suppression may be relevant to the concept of ART as a prevention strategy [33]. During this same time period we also followed 12 acutely-infected individuals who declined ART during AHI. These individuals initiated ART a median of 384 days (range 87–827) from the date of AHI diagnosis consistent with the results of other groups [34]. Therefore, acutely infected individuals presenting with symptoms may be spared only 1–2 years of ART; a fact that may weigh in the balance when considering initiation of ART in acutely infected individuals.
Our work confirms high levels of immune activation among AHI participants compared to seronegative individuals [35]. Baseline frequency of CD8+CD38+HLADR+ T-cells was associated with lower baseline CD4 count and higher baseline HIV RNA possibly related to the loss of immune regulation as suggested by the high level of pro-inflammatory cytokines detected during acute infection [36]. We hypothesized that immune activation might affect time-to-viral-suppression; however, after controlling for baseline HIV RNA, CD4 count and age, baseline frequency of CD8+CD38+HLADR+ T-cells was not associated with increased time-to-viral-suppression or nadir CD4 count. In contrast, another study found that a more rapid time-to-viral-suppression to <50 copies/mL was associated with higher frequency of activated CD8+ T-cells, as well as higher baseline CD4 count (p<0.001) and lower viremia, after adjustment for age and gender [37]. Our results may suggest a different biological relevance for activated CD8 T cells at ART initiation during AHI, when activated CD8 subsets may have a more critical role in controlling viral replication in the setting of relatively preserved CD4 counts, as generally seen in AHI.
Although there are potential risks with NNRTI-based therapy in AHI, our results demonstrate that acutely-infected patients, many from difficult social backgrounds and with substantial barriers to treatment (distance-to-care, young age, MSM-related stigma) are rapidly suppressed with simple and easily administered treatment. We feel our findings lend support to the use of ART during AHI given demonstrated efficacy, and the high retention-in-care and on study. Our findings also endorse the use of a once daily, co-formulated NNRTI-based regimen, used in conjunction with baseline genotype data and appropriate treatment adjustment if needed.
Supplementary Material
Acknowledgements
Support: This study is supported by the generous contributions of Bristol Myers Squibb and Gilead Sciences, Inc, and the following NIH funded programs: the UNC Center for AIDS Research (CFAR) (1P30AI 50410-04), the Duke CFAR (1P30 AI 64518), a grant (R01 A01050483), and a grant (RR00046) from the General Clinical Research Centers program of the Division of Research Resources, and a 2K24 AI01608 award.
We would like to acknowledge and thank Lynn McNeil, RN, Sandra McCoy, MPH, PhD, Mehri McKellar, MD and Christopher Pilcher, MD and the Duke CFAR FlowCore laboratory for their contributions to this study. We greatly appreciate the support of all study staff members, HIV care providers and particularly the individuals who participated in this study.
Footnotes
Role of Authors: Study design was done by C.L.G, C.K.M., H.C., D.M.M., C.B.H., G.F., J.J.E.; data generation/assay performance was done by C.L.G., A.J.M., C.K.M., A.C.B., J.D.K., K.S.M., M.K, J.S., S.A.F., G.F.; drafting of the paper was done by C.L.G., A.J.M., C.K.M., H.C., S.A.F., D.M.M., G.F., J.J.E.
Financial Disclosure: Bristol Myers Squibb and Gilead Sciences, Inc, provided antiretroviral medications for this study. The funders had no role in study design, data collection and analysis, decision to publish, or preparation of the manuscript.
Potential Financial Conflicts of Interest: C.G. has received research support from Bristol Myers Squibb, Gilead Sciences, Abbott and Tibotec Therapeutics. C.H. has received grant support and/or consulting/honoraria from BMS, GSK, Merck, Tibotec, Gilead, Myriad Pharmaceuticals, Pfizer. D.M. has received research support from Bristol Myers Squibb, Gilead Sciences, Merck, Abbott, and Roche, and is a honoraria for professional services to Bristol Myers Squibb, Merck, Chimerix, and Tibotec Therapeutics. J.E. receives research support from Merck and GlaxoSmithKline and is a consultant to Bristol Myers Squibb, Merck, and Tibotec Therapeutics. A.M., A.B., J.K., K.M., M.K., S.F., G.F. - No conflicts.
References
- 1.Powers K, Ghani A, Miller W, Hoffman I, Pettifor A, Kamanga G, et al. The contribution of early HIV infection to HIV spread in Lilongwe, Malawi: implications for transmission prevention strategies. XVIII International AIDS Conference; Vienna, Austria. 2010. [Google Scholar]
- 2.Chakraborty H, Sen PK, Helms RW, Vernazza PL, Fiscus SA, Eron JJ, et al. Viral burden in genital secretions determines male-to-female sexual transmission of HIV-1: a probabilistic empiric model. AIDS. 2001;15:621–627. doi: 10.1097/00002030-200103300-00012. [DOI] [PubMed] [Google Scholar]
- 3.Quinn TC, Wawer MJ, Sewankambo N, Serwadda D, Li C, Wabwire-Mangen F, et al. Viral load and heterosexual transmission of human immunodeficiency virus type 1. Rakai Project Study Group. N Engl J Med. 2000;342:921–929. doi: 10.1056/NEJM200003303421303. [DOI] [PubMed] [Google Scholar]
- 4.Tovanabutra S, Robison V, Wongtrakul J, Sennum S, Suriyanon V, Kingkeow D, et al. Male viral load and heterosexual transmission of HIV-1 subtype E in northern Thailand. J Acquir Immune Defic Syndr. 2002;29:275–283. doi: 10.1097/00126334-200203010-00008. [DOI] [PubMed] [Google Scholar]
- 5.Fideli US, Allen SA, Musonda R, Trask S, Hahn BH, Weiss H, et al. Virologic and immunologic determinants of heterosexual transmission of human immunodeficiency virus type 1 in Africa. AIDS Res Hum Retroviruses. 2001;17:901–910. doi: 10.1089/088922201750290023. [DOI] [PMC free article] [PubMed] [Google Scholar]
- 6.Brenner BG, Roger M, Routy JP, Moisi D, Ntemgwa M, Matte C, et al. High rates of forward transmission events after acute/early HIV-1 infection. J Infect Dis. 2007;195:951–959. doi: 10.1086/512088. [DOI] [PubMed] [Google Scholar]
- 7.Wawer MJ, Gray RH, Sewankambo NK, Serwadda D, Li X, Laeyendecker O, et al. Rates of HIV-1 transmission per coital act, by stage of HIV-1 infection, in Rakai, Uganda. J Infect Dis. 2005;191:1403–1409. doi: 10.1086/429411. [DOI] [PubMed] [Google Scholar]
- 8.Pilcher CD, Tien HC, Eron JJ, Jr, Vernazza PL, Leu SY, Stewart PW, et al. Brief but efficient: acute HIV infection and the sexual transmission of HIV. J Infect Dis. 2004;189:1785–1792. doi: 10.1086/386333. [DOI] [PubMed] [Google Scholar]
- 9.Yerly S, Vora S, Rizzardi P, Chave JP, Vernazza PL, Flepp M, et al. Acute HIV infection: impact on the spread of HIV and transmission of drug resistance. AIDS. 2001;15:2287–2292. doi: 10.1097/00002030-200111230-00010. [DOI] [PubMed] [Google Scholar]
- 10.Salazar-Gonzalez JF, Bailes E, Pham KT, Salazar MG, Guffey MB, Keele BF, et al. Deciphering human immunodeficiency virus type 1 transmission and early envelope diversification by single-genome amplification and sequencing. J Virol. 2008;82:3952–3970. doi: 10.1128/JVI.02660-07. [DOI] [PMC free article] [PubMed] [Google Scholar]
- 11.Ma ZM, Stone M, Piatak M, Jr, Schweighardt B, Haigwood NL, Montefiori D, et al. High specific infectivity of plasma virus from the pre-ramp-up and ramp-up stages of acute simian immunodeficiency virus infection. J Virol. 2009;83:3288–3297. doi: 10.1128/JVI.02423-08. [DOI] [PMC free article] [PubMed] [Google Scholar]
- 12.Royce R, Sena A, Cates WJ, Cohen MS. Sexual Transmission of HIV. N Engl J Med. 1997;336:1072–1078. doi: 10.1056/NEJM199704103361507. [DOI] [PubMed] [Google Scholar]
- 13.Cohen MS, Pilcher CD. Amplified HIV transmission and new approaches to HIV prevention. J Infect Dis. 2005;191:1391–1393. doi: 10.1086/429414. [DOI] [PubMed] [Google Scholar]
- 14.Colfax GN, Buchbinder SP, Cornelisse PG, Vittinghoff E, Mayer K, Celum C. Sexual risk behaviors and implications for secondary HIV transmission during and after HIV seroconversion. AIDS. 2002;16:1529–1535. doi: 10.1097/00002030-200207260-00010. [DOI] [PubMed] [Google Scholar]
- 15.Granich RM, Gilks CF, Dye C, De Cock KM, Williams BG. Universal voluntary HIV testing with immediate antiretroviral therapy as a strategy for elimination of HIV transmission: a mathematical model. Lancet. 2009;373:48–57. doi: 10.1016/S0140-6736(08)61697-9. [DOI] [PubMed] [Google Scholar]
- 16.DHHS. Guidelines for the use of antiretroviral agents in HIV-1-infected adults and adolescents. 2008. [Google Scholar]
- 17.Cellerai C, Little SJ, Kinloch-de Loes S. Treatment of acute HIV-1 infection: are we getting there? Current Opinion in HIV and AIDS. 2008;3:67–74. doi: 10.1097/COH.0b013e3282f31d4b. [DOI] [PubMed] [Google Scholar]
- 18.Hurt CB, McCoy SI, Kuruc J, Nelson JA, Kerkau M, Fiscus S, et al. Transmitted antiretroviral drug resistance among acute and recent HIV infections in North Carolina from 1998 to 2007. Antivir Ther. 2009;14:673–678. [PMC free article] [PubMed] [Google Scholar]
- 19.Riddler SA, Haubrich R, DiRienzo AG, Peeples L, Powderly WG, Klingman KL, et al. Class-sparing regimens for initial treatment of HIV-1 infection. N Engl J Med. 2008;358:2095–2106. doi: 10.1056/NEJMoa074609. [DOI] [PMC free article] [PubMed] [Google Scholar]
- 20.Deeks SG, Kitchen CM, Liu L, Guo H, Gascon R, Narvaez AB, et al. Immune activation set point during early HIV infection predicts subsequent CD4+ T-cell changes independent of viral load. Blood. 2004;104:942–947. doi: 10.1182/blood-2003-09-3333. [DOI] [PubMed] [Google Scholar]
- 21.Giorgi JV, Hultin LE, McKeating JA, Johnson TD, Owens B, Jacobson LP, et al. Shorter survival in advanced human immunodeficiency virus type 1 infection is more closely associated with T lymphocyte activation than with plasma virus burden or virus chemokine coreceptor usage. J Infect Dis. 1999;179:859–870. doi: 10.1086/314660. [DOI] [PubMed] [Google Scholar]
- 22.Ribaudo H, Lennow J, Currier J, Kuritzkes D, Gulick R, Haubrich R, et al. Virologic failure endpoint definition in clinical trials: is using HIV-1 RNA threshold <200 copies/mL better than <50 copies/mL? An analysis of ACTG studies. 16th Conference on Retroviruses and Opportunistic Infections; Montreal, Canada. 2009. [Google Scholar]
- 23.Lindback S, Thorstensson R, Karlsson AC, von Sydow M, Flamholc L, Blaxhult A, et al. Diagnosis of primary HIV-1 infection and duration of follow-up after HIV exposure. Karolinska Institute Primary HIV Infection Study Group. AIDS. 2000;14:2333–2339. doi: 10.1097/00002030-200010200-00014. [DOI] [PubMed] [Google Scholar]
- 24.Streeck H, Jessen H, Alter G, Teigen N, Waring MT, Jessen A, et al. Immunological and virological impact of highly active antiretroviral therapy initiated during acute HIV-1 infection. J Infect Dis. 2006;194:734–739. doi: 10.1086/503811. [DOI] [PubMed] [Google Scholar]
- 25.Hoen B, Cooper DA, Lampe FC, Perrin L, Clumeck N, Phillips AN, et al. Predictors of virological outcome and safety in primary HIV type 1-infected patients initiating quadruple antiretroviral therapy: QUEST GW PROB3005. Clin Infect Dis. 2007;45:381–390. doi: 10.1086/519428. [DOI] [PubMed] [Google Scholar]
- 26.Kassutto S, Maghsoudi K, Johnston MN, Robbins GK, Burgett NC, Sax PE, et al. Longitudinal analysis of clinical markers following antiretroviral therapy initiated during acute or early HIV type 1 infection. Clin Infect Dis. 2006;42:1024–1031. doi: 10.1086/500410. [DOI] [PubMed] [Google Scholar]
- 27.Kilby JM, Lee HY, Hazelwood JD, Bansal A, Bucy RP, Saag MS, et al. Treatment response in acute/early infection versus advanced AIDS: equivalent first and second phases of HIV RNA decline. AIDS. 2008;22:957–962. doi: 10.1097/QAD.0b013e3282fbd1da. [DOI] [PMC free article] [PubMed] [Google Scholar]
- 28.Little SJ, McLean AR, Spina CA, Richman DD, Havlir DV. Viral dynamics of acute HIV-1 infection. J Exp Med. 1999;190:841–850. doi: 10.1084/jem.190.6.841. [DOI] [PMC free article] [PubMed] [Google Scholar]
- 29.Louie M, Hogan C, Di Mascio M, Hurley A, Simon V, Rooney J, et al. Determining the relative efficacy of highly active antiretroviral therapy. J Infect Dis. 2003;187:896–900. doi: 10.1086/368164. [DOI] [PubMed] [Google Scholar]
- 30.Putter H, Prins JM, Jurriaans S, Roos M, Ferguson NM, van Praag R, et al. Slower decline of plasma HIV-1 RNA following highly suppressive antiretroviral therapy in primary compared with chronic infection. AIDS. 2000;14:2831–2839. doi: 10.1097/00002030-200012220-00004. [DOI] [PubMed] [Google Scholar]
- 31.McMichael AJ, Borrow P, Tomaras GD, Goonetilleke N, Haynes BF. The immune response during acute HIV-1 infection: clues for vaccine development. Nat Rev Immunol. 2010;10:11–23. doi: 10.1038/nri2674. [DOI] [PMC free article] [PubMed] [Google Scholar]
- 32.Goonetilleke N, Liu MK, Salazar-Gonzalez JF, Ferrari G, Giorgi E, Ganusov VV, et al. The first T cell response to transmitted/founder virus contributes to the control of acute viremia in HIV-1 infection. J Exp Med. 2009;206:1253–1272. doi: 10.1084/jem.20090365. [DOI] [PMC free article] [PubMed] [Google Scholar]
- 33.Rieder P, Joos B, von Wyl V, Boni J, Yerly S, Klimkait T, et al. Strong effect of early ART during primary HIV-1 infection in preventing further spread of HIV in sexually active men having sex with men. 17th Conference on Retroviruses and Opportunistic Infections; San Francisco, CA. 2010. [Google Scholar]
- 34.Hogan C, DeGruttola V, Daar E, Sun X, Del Rio C, Fiscus S, et al. A finite course of ART during early HIV-1 Infection modestly delays need for subsequent ART initiation: ACTG A5217, The SETPOINT Study. XVIII International AIDS Conference; Vienna, Austria. 2010. [Google Scholar]
- 35.Zaunders J, Carr A, McNally L, Penny R, Cooper DA. Effects of primary HIV-1 infection on subsets of CD4+ and CD8+ T lymphocytes. AIDS. 1995;9:561–566. doi: 10.1097/00002030-199506000-00005. [DOI] [PubMed] [Google Scholar]
- 36.Stacey AR, Norris PJ, Qin L, Haygreen EA, Taylor E, Heitman J, et al. Induction of a striking systemic cytokine cascade prior to peak viremia in acute human immunodeficiency virus type 1 infection, in contrast to more modest and delayed responses in acute hepatitis B and C virus infections. J Virol. 2009;83:3719–3733. doi: 10.1128/JVI.01844-08. [DOI] [PMC free article] [PubMed] [Google Scholar]
- 37.Robbins GK, Spritzler JG, Chan ES, Asmuth DM, Gandhi RT, Rodriguez BA, et al. Incomplete reconstitution of T cell subsets on combination antiretroviral therapy in the AIDS Clinical Trials Group protocol 384. Clin Infect Dis. 2009;48:350–361. doi: 10.1086/595888. [DOI] [PMC free article] [PubMed] [Google Scholar]
Associated Data
This section collects any data citations, data availability statements, or supplementary materials included in this article.