

Abstract
Background
For patients presenting with acute coronary syndrome (ACS) to the emergency department, early identification of those that are at high risk for subsequent myocardial necrosis or adverse outcomes would allow earlier or more aggressive treatment. We determined if a panel of biomarkers can be used to identify high risk patients.
Methods
A cohort (84 females/132 males) from our 1996 ACS study population that had EDTA specimens stored (−70 °C) was selected and the earliest available specimen was analyzed for 11 biomarkers (IL-6, IL-8, MCP-1, VEGF, L-selectin, P-selectin, E-selectin, ICAM-1, VCAM-1, NT-proBNP, cTnT). These data were linked to the existing cTnI and health outcome databases for this population. ROC curve analysis for myocardial necrosis (i.e., peak cTnI >0.04 μg/l) identified 3 candidate biomarkers. These 3 biomarkers were applied together to generate a panel test (2 of the 3 biomarkers increased for a positive result) and assessed for its ability to identify patients at risk for myocardial necrosis and the combined endpoint of death, myocardial infarction (MI) and heart failure (HF).
Results
The panel test (IL-6, NT-proBNP, E-selectin) alone detected 60% (95% CI: 49–69; false positive rate: 26%) of subjects that would be classified with myocardial necrosis. Kaplan–Meier and Cox proportional analyses indicated that patients positive by the biomarker panel (including those with cTnI ≤0.04 μg/l) had significantly worse outcomes (death/MI/HF) as compared to those negative by both cTnI and the panel test.
Conclusion
A biomarker panel analyzed early after pain onset can identify individuals at risk for both myocardial necrosis and the combined endpoint of death/MI/HF. Additional prospective studies are required to assess this panel for both early MI detection and to further refine which health outcomes (death, MI, HF) are associated with positive panel results.
Keywords: Acute coronary syndrome, Myocardial necrosis, Biomarker panel, Outcomes
1. Introduction
Several putative biomarkers have been identified as possible early markers of impending plaque rupture and thus of incipient acute myocardial infarction (AMI) [1–3]. These biomarkers have the potential to allow for extremely early diagnosis of AMI, before increases in biomarkers of necrosis, even when highly sensitive troponin (cTn) assays using contemporary cutoff values are employed. We analyzed a panel of proteins that have been implicated in the events leading to AMI [1,4–11]. Accordingly, we measured biomarkers thought to be involved in vascular inflammation, plaque destabilization and myocardial dysfunction to determine if different proteins and their combinations could be used synergistically to identify patients that subsequently would develop myocardial necrosis. We also tested whether identification of patients by these biomarker combinations would provide additional prognostic information on long-term health outcomes.
2. Patients and methods
2.1. Study subjects and specimens
The study population and its characteristics have been previously reported [12–15]. The 216 subject cohort presented to the emergency department in 1996 with symptoms suggestive of cardiac ischemia and were selected for this biomarker analysis because each subject had at least 2 specimens collected into tubes with EDTA available in storage (−70 °C). For this analysis only the earliest available (1st specimen) was used for biomarker measurements.
2.2. Biomarker testing
In 2006 the EDTA specimens were thawed for the first time and were measured by the cytokine array (evidence investigator™, Randox Ltd), NT-proBNP and cTnT (Elecsys® 1010, Roche). In early 2007, after a second thaw, the cell adhesion array was measured (evidence investigator). A priori the decision was made to only evaluate IL-6, IL-8, VEGF, MCP-1 from the cytokine array (4 of 12 cytokines measured), as these biomarkers have been reported in the ACS literature. All biomarkers on the cell adhesion array (L-selectin, P-selectin, E-selectin, ICAM-1, VCAM-1) as well as NT-proBNP and cTnT were used in the analysis. The interassay (n =20 assays) imprecision (CV), determined by measuring 3 levels of quality control material, ranged from 10.9–16.2% for IL-6, 8.3–16.1% for IL-8, 10.9–15.6% for VEGF, 7.6–13.0% for MCP-1, 13.3–21.6% for VCAM-1, 10.8–19.3% for ICAM-1, 11.0–20.8% for E-selectin, 12.1–18.0% for P-selectin, and 12.1–15.8% for L-selectin.
There is evidence to support the stability of the cytokines and cell adhesion molecules measured in the present study after 10-year storage, in that the reference ranges for IL-8, VEGF, and MCP-1 published in 2006 for this method were derived from samples collected as early as 1994 [16]. IL-6 and NT-proBNP also appear to be stable during long-term storage [17–19]. The cell adhesion molecules also have been measured in samples stored >10 years [20]. The NT-proBNP and cTnT were measured with the Elecsys® 1010 (Roche) with interassay impression <7%. cTnI concentrations (AccuTnI™, Beckman Coulter) used in this study were measured in 2003, and stability of troponin with this assay has been well documented [21,22]. During the biomarker measurement phase of the study, 8 samples for the cell adhesion array and 3 samples for cTnT either had high background or error codes and were not used in the analysis. In total, 205 subjects had a measured concentration for all 12 biomarkers (IL-6, IL-8, MCP-1, VEGF, L-selectin, P-selectin, E-selectin, ICAM-1, VCAM-1, NT-proBNP, cTnT, cTnI).
2.3. Panel description
To characterize our population the peak cTnI concentration was used to classify individuals as having myocardial necrosis as per the 2000 ESC/ACC guideline (i.e., peak cTnI >99th percentile, which for the AccuTnI assay is >0.04 μg/l [23]). Receiver operator characteristic (ROC) curves were constructed based on whether myocardial necrosis was present (peak cTnI> 0.04 μg/l). The 3 top biomarkers based on ROC analysis (NT-proBNP area under the curve, AUC: 0.66, 95% CI: 0.58–0.74; IL-6 AUC: 0.65, 0.58–0.72; E-selectin: 0.58, 0.50–0.65) were selected and the cutoffs used were concentrations derived from ROC analysis (NT-proBNP >156 ng/l; IL-6 >4.4 ng/l) and the 75th percentile for E-selectin (>24 μg/l) as the AUC for E-selection was of borderline significance.
IL-6, E-selectin, and NT-proBNP have different biological functions and perhaps different roles in patients with ACS. As such, we reasoned that increases of any 2 of these 3 biomarkers might represent a pathological condition. Thus as a pre hoc decision, individuals were classified as positive by the panel test if any 2 of the 3 biomarkers in this panel had increased concentrations (i.e., above the cutoffs). The sensitivity for detecting myocardial necrosis (as determined by the peak cTnI >0.04 μg/l in the 205 cohort) was determined using only the early specimen based on either cTn or the panel test alone, or the combination of both tests.
2.4. Health outcome analysis based on panel test
Research ethics board approval was obtained for this study and all analyses were performed using SAS version 9.1.3 and GraphPad Prism ver. 5.00. In the 205 subjects evaluated using the panel, health outcomes were determined from the Registered Persons Data Base (RPDB) for mortality outcomes and the Canadian Institute for Health Information Discharge Abstract Database (CIHI-DAD) for hospital discharges associated with MI and HF. Both the RPDB and CIHI-DAD (i.e., administrative databases) have been reported to be highly accurate in identifying these endpoints [24,25]. Based on the death date and earliest subsequent readmission for MI and HF, indicators were created to reflect whether or not an event (death, MI, or HF readmission) occurred within 8-year post-presentation (patients who died without previous MI or HF readmission, follow-up were censored at the date of death).
The analyses were based on the following classifications (see Table 4; cTnI and panel row): Group 1 (n=74) — those with an increased cTnI (e.g., >0.04 μg/l) at the time of presentation and/or a panel positive test with a subsequent elevation in cTnI >0.04 μg/l; Group 2 (n=29) — those with a presentation positive panel test but with a peak cTnI ≤ 0.04 μg/l (i.e., not increased); Group 3 (n=18) — those with both a negative cTnI and negative panel test at presentation but with a subsequent increased peak cTnI to >0.04 μg/l; Group 4 (n=84) —those negative for both cTnI and the panel test without an increased peak cTnI (e.g., ≤0.04 μg/l). To maximize on the number of events for the 205 cohort, the combined endpoint (death/MI/HF) was used. Kaplan–Meier curves were constructed to display time to an event (death/MI/HF), with differences between groups assessed by the log rank test. Cox proportional hazard models (adjusted for age) were also used to compare time to an event with Group 4 (above) being the referent, respectively. Significance of the association was based on the Wald χ2 statistic, with significance set at p<0.05.
Table 4.
Sensitivity of the panel test in the early specimen (1st) to identify a peak cTnI >99th percentile
| Test | ESC/ACC criteria for necrosis using peak cTnI >99th percentile
|
Sensitivity (95% CI) | Specificity (95% CI) | ||
|---|---|---|---|---|---|
| Yes | NO | ||||
| cTnI >99th percentile | Yes | 46 | 0 | 0.50 | 1.00 |
| No | 46 | 113 | (0.39–0.60) | (0.96–1.00) | |
| cTnT >99th percentile | Yes | 49 | 10 | 0.53 | 0.91 |
| No | 43 | 103 | (0.43–0.63) | (0.84–0.95) | |
| Panel | Yes | 55 | 29 | 0.60 | 0.74 |
| No | 37 | 84 | (0.49–0.69) | (0.65–0.81) | |
| cTnI & Panel | Yes | 74 | 29 | 0.80 | 0.74 |
| No | 18 | 84 | (0.71–0.87) | (0.65–0.81) | |
| cTnT & Panel | Yes | 68 | 33 | 0.74 | 0.71 |
| No | 24 | 80 | (0.64–0.82) | (0.62–0.78) | |
2.5. Health outcome analysis on group with detectable cTnI concentrations
We and others have previously shown that detectable concentrations of cTnI (i.e., ≥0.02 μg/l) are prognostic for poor outcomes [14,22]. Accordingly, we also analyzed patients using a value for peak cTnI that was above the limit of detection (i.e., >0.01 μg/l for the AccuTnI assay [12,14]). This cohort (n=161 subjects with a detectable cTnI) was also classified into 4 groups based on: Group C (n=54) — positive for both tests in the first specimen; Group B (n=24) —positive only for the panel test in the first specimen; Group A (n=42) — cTnI only increased (n=42) or Group D (n=41) — negative by both tests in this early specimen. To maximize on the number of events for the troponin detectable subgroup (n=161) the combined endpoint (death/MI/HF) was used. Kaplan–Meier curves were constructed to display time to an event (death/MI/HF), with differences between groups assessed by the log rank test. Cox proportional hazard models (adjusted for age) were also used to compare time to an event with Group A being the referent, respectively. Significance of the association was based on the Wald χ2 statistic, with significance set at p<0.05. Between-group comparisons of central tendency for cTnI concentrations in Groups A–D were based on the Krustal–Wallis test and Dunn’s multiple comparisons tests.
3. Results
The 216 cohort (84 females and 132 males) had a median age of 66 years (IQR: 53–76). The median time after pain onset for the first specimen was 2 h (2–4). The median cTnI concentration in the earliest specimen was significantly lower than the peak cTnI (0.01 μg/l (0.00–0.04) vs. 0.04 μg/l (0.02–0.34), p<0.001) obtained at a median 9 h (4–12) after pain onset (Table 1). For the top 3 biomarkers identified by ROC analysis (NT-proBNP, IL-6, E-selectin, see Table 2) there was correlation between IL-6 and NT-proBNP concentrations (r=0.43) but not for E-selectin and the 2 other biomarkers (r<0.2, Table 3). Applying the panel test (i.e., 2 of the 3 biomarkers: IL-6, NT-proBNP, E-selectin had to be positive as defined by concentrations exceeding their respective cutoffs in the 205 cohort — see Method section), the sensitivity for detecting myocardial necrosis using this test was 0.60 (95% CI: 0.49–0.69) with a specificity 0.74 (0.65–0.81). Applying the panel with troponin (e.g., either cTnI or cTnT) in the first specimen significantly increased the overall sensitivity for myocardial necrosis as compared to the troponins alone (e.g., cTnI with panel: 0.80 (0.71–0.87) vs. cTnI alone: 0.50 (0.39–0.60); cTnT with panel: 0.74 (0.64–0.82) vs. cTnT alone: 0.53 (0.43–0.63) (Table 4). The panel test had a false positive rate of 26%, so both Kaplan–Meier and Cox proportional analyses were performed to determine whether this panel positive group with a negative peak cTnI (i.e., ≤0.04 μg/l) had worse outcomes as compared to those with both a negative peak cTnI and panel test. The data demonstrate that those classified positive by the panel test have worse outcomes as compared to those negative by both troponin and the panel test (Fig. 1, Table 5).
Table 1.
Biomarker concentrations in the early (1st specimen) from the study cohort (n=216)
| Variable (# of subjects with measurements) | Median (IQRa) |
|---|---|
| Peak cTnI (216) | 0.04 μg/l (0.02–0.34) |
| Time for Peak cTnI (hours from pain onset) | 9 h (4–12) |
| Time for 1st specimen (hours from pain onset) | 2 h (2–4) |
| cTnI (216) | 0.01 μg/l (0.00–0.04) |
| cTnT (213) | 0.00 μg/l (0.00–0.02) |
| IL-6 (216) | 4.0 ng/l (1.8–11.5) |
| VEGF (216) | 24.2 ng/l (14.5–48.1) |
| L-selectin (208) | 1354 μg/l (1057–1761) |
| NT-proBNP (216) | 147 ng/l (47–867) |
| IL-8 (216) | 6.1 ng/l (4.5–9.5) |
| P-selectin (208) | 100 μg/l (76–126) |
| ICAM-1 (208) | 323 μg/l (263–411) |
| MCP-1 (216) | 150 ng/l (116–202) |
| E-selectin (208) | 17.7 μg/l (11.8–24.1) |
| VCAM-1 (208) | 486 μg/l (372–671) |
IQR: interquartile range.
Table 2.
ROC curve analysis for detecting cardiac necrosis (i.e., peak cTnI >0.04 μg/l) using 1st specimen
| Biomarker | AUC | 95% CI | p-value |
|---|---|---|---|
| NT-proBNP | 0.66 | 0.58–0.736 | <0.01 |
| IL-6 | 0.65 | 0.58–0.72 | <0.01 |
| E-selectin | 0.58 | 0.50–0.65 | 0.06 |
| VEGF | 0.56 | 0.48–0.63 | 0.15 |
| ICAM-1 | 0.54 | 0.46–0.62 | 0.31 |
| P-selectin | 0.54 | 0.46–0.62 | 0.33 |
| L-selectin | 0.53 | 0.45–0.61 | 0.50 |
| MCP-1 | 0.52 | 0.44–0.60 | 0.62 |
| IL-8 | 0.51 | 0.43–0.59 | 0.78 |
| VCAM-1 | 0.51 | 0.43–0.59 | 0.83 |
Table 3.
Spearman correlation of biomarkers in early specimen
| cTnT | NT-proBNP | IL-6 | E-sel | |
|---|---|---|---|---|
| cTnI | 0.65* | 0.28* | 0.24* | 0.03 |
| cTnT | 0.40* | 0.36* | −0.09 | |
| NT-proBNP | 0.43* | −0.09 | ||
| IL-6 | 0.17* |
p<0.05.
Fig. 1.

Kaplan–Meier curves using the early specimen concentrations for classification of subjects positive by the panel test and/or troponin with a peak cTnI >0.04 μg/l (n=74, Group 1); subjects with both a negative panel test and cTnI in the early specimen, but with a peak cTnI >0.04 μg/l (n=18,Group 3); subjects positive for the panel test with a peak cTnI ≤0.04 μg/l (n=29, Group 2), and subjects negative by both tests with a peak TnI ≤ 0.04 μg/l (n=84, Group 4).
Table 5.
Cox proportional model for death/MI/HF comparing Groups 1–3 vs. Group 4 (negative for cTnI and panel tests)
| Time since presentation | Group | HR relative to Group 4 | 95% CI | p-value |
|---|---|---|---|---|
| 6 months | 1 | 16.9 | 5.1–55.8 | <0.001 |
| 2 | 7.0 | 1.7–28.7 | 0.007 | |
| 3 | 9.7 | 2.3–40.6 | 0.002 | |
| 2 years | 1 | 10.5 | 4.7–23.5 | <0.001 |
| 2 | 5.6 | 2.2–14.2 | <0.001 | |
| 3 | 4.7 | 1.6–13.9 | 0.006 | |
| 8 years | 1 | 5.2 | 3.2–8.4 | <0.001 |
| 2 | 4.2 | 2.3–7.5 | <0.001 | |
| 3 | 2.4 | 1.1–5.0 | 0.021 |
Group 1 (n=74): subjects with an elevated cTnI (e.g. >0.04 μg/l) at the time of presentation and/or a panel positive test with a subsequent elevation in cTnI >0.04 μg/l.
Group 2 (n=29): subjects with a presentation positive panel test but with a peak cTnI ≤0.04 μg/l (i.e. not elevated).
Group 3 (n=18): subjects with both a negative cTnI and negative panel test at presentation but with a subsequent elevated peak cTnI to >0.04 μg/l.
Group 4 (n=84): subjects negative for both cTnI and the panel test without an elevated peak cTnI (e.g. ≤0.04 μg/l).
To assess how the panel test performed in only the group of patients with detectable cTnI concentrations (n=161, ≥0.02 μg/l), Kaplan–Meier and Cox analyses were performed based on subjects classified as positive for both tests in the first specimen (n=54, Group C), positive only for the panel (n=24, Group B), positive only for cTnI (n=42, Group A) or negative by both tests (n=41, Group D) in this early specimen. Long-term differences exist in the survival curves between subjects positive for the panel test vs. negative (p<0.001, Fig. 2). Cox analysis demonstrated that those positive for the panel test (Groups B and C) were at greater long-term risk (e.g., 2 and 8 years) for adverse events (death/MI/HF) as compared to those negative for the panel (Groups A and D). Of note the median peak cTnI concentration in the panel only group (Group B) was not significantly different than those negative for both tests (Group D) at presentation (0.04 μg/l (0.02–0.11) vs. 0.02 μg/l (0.02–0.03), p>0.05), but was significantly lower than the 2 groups with a presentation positive cTnI (≥0.02 μg/l) (Group C cTnI: 0.24 μg/l (0.05–3.03) and Group A cTnI: 0.36 μg/l (0.04–15.1); p<0.05).
Fig. 2.
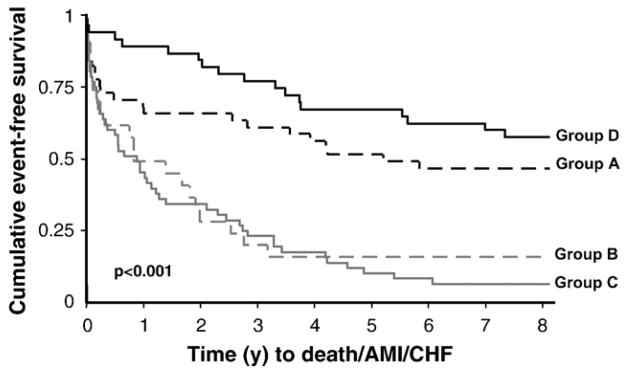
Kaplan–Meier curves using the early specimen concentrations in those subjects with detectable peak cTnI concentrations (≥0.02 μg/l; n=161). Subjects were classified based on being positive for both tests in the first specimen (n=54, Group C — positive panel and detectable cTnI (≥0.02 μg/l) at presentation), positive only for the panel test (n=24, Group B — positive panel test and a cTnI concentration that is not detectable (≤ 0.01 μg/l) at presentation), positive only for TnI (n=42, Group A — a cTnI concentration that is detectable (≥0.02 μg/l) with a negative panel test at presentation) or negative by both tests (n=41, Group D — negative cTnI (≤0.01 μg/l) and negative panel test at presentation but with a subsequent peak cTnI that is detectable, i.e. ≥0.02 μg/l).
4. Discussion
Early identification of patients in the emergency setting who are at high risk for subsequent myocardial necrosis and adverse health outcomes would be beneficial for both the care of these patients and resource utilization in the emergency department. The processes leading up to AMI have been well described in the literature, yet the sequence of events and more specifically, the biomarkers that may precede myocardial necrosis have been the focus of much research [1]. We examined biomarkers that represent distinct phases of the ACS spectrum, such as inflammation, endothelial and myocardial dysfunction. Inflammation is thought to play an important role in the events preceding plaque rupture, with many publications documenting the role of CRP in ACS [26]. However, earlier mediators of inflammation, for example IL-6, not only result in CRP production by the liver [26] but IL-6 concentrations have also been reported to be derived from cardiac sources in ACS patients [6,27]. Our hypothesis was that elevations of biomarkers representing any 2 of these 3 conditions (i.e., inflammation, endothelial and myocardial dysfunction) early after chest pain onset would represent an unfavorable clinical situation for patients with ACS. It is reasonable to expect that several processes preceding necrosis should be evident by biomarker analysis, yet we made no stipulation which of the processes needed to be increased. Rather, our algorithm relied on identification of at least 2 increased biomarkers of which we found that IL-6, E-selectin, and NT-proBNP represented the best panel for predicting necrosis and long-term health outcomes. Of note, even in the group of subjects with detectable cTnI (n=161), those with a positive panel test were at a higher risk for the combined endpoint of death/MI/HF after 2-year post-presentation (see Fig. 2, Table 6).
Table 6.
Cox proportional model for death/MI/HF in only those subjects with a detectable cTnI concentration (≥0.02 μg/l; n=161)
| Time since presentation | Group | HR relative to Group A | 95% CI | p-value |
|---|---|---|---|---|
| 6 months | B | 1.5 | 0.6–3.5 | 0.388 |
| C | 1.6 | 0.8–3.3 | 0.195 | |
| D | 0.2 | 0.1–0.8 | 0.018 | |
| 2 years | B | 2.3 | 1.1–4.7 | 0.024 |
| C | 2.2 | 1.2–4.2 | 0.013 | |
| D | 0.4 | 0.1–1.0 | 0.045 | |
| 8 years | B | 2.5 | 1.4–4.7 | 0.003 |
| C | 2.8 | 1.7–4.8 | <0.001 | |
| D | 0.7 | 0.4–1.3 | 0.249 |
Group A (n=42): subjects with a cTnI concentration that is detectable (≥0.02 μg/l) with a negative panel test at presentation.
Group B (n=24): subjects with a positive panel test and a cTnI concentration that is not detectable (≤ 0.01 μg/l) at presentation.
Group C (n=54): subjects with both a positive panel and detectable cTnI (≥ 0.02 μg/l) at presentation.
Group D (n=41): subjects with both a negative cTnI (≤0.01 μg/l) and negative panel test at presentation but with a subsequent peak cTnI that is detectable (i.e. ≥ 0.02 μg/l).
There are several limitations to our study, such as the small sample size, which precluded separating events (e.g., death, MI, HF) as well as limiting the number of analyses that can be done. Also, our study population was recruited in 1996 and received much less medical management as compared to current practices. The 216 cohort used in this analysis was obtained from our original 448 study population, and was on average older, stayed in the hospital longer and had a higher peak cTnI concentration than the group that was excluded (n=232, due to insufficient samples). In any case, the 216 cohort probably represents an enriched cardiac population in the ED and as such has the advantage of being a good cohort to interrogate the natural history of ACS. We feel that the platform and strategy we used was adequate for exploring the roles of these biomarkers for early MI detection and risk stratification in ACS patients. This discovery phase is part of the biomarker validation process, which is needed to justify an investment in making the panel test performance acceptable for the clinical laboratory (CV <10%). However, we must stress that additional studies in contemporary ACS populations are required in conjunction with better analytical performance of the panel test before considering application in the service laboratory. In short, this is the preliminary analysis of a panel test in a small cohort, thus these findings need to be replicated.
Furthermore, larger studies are required to look at each endpoint alone (death, MI, HF) as the pathophysiology of heart failure and MI are different, and additional information on the cause of death (e.g., cardiac death) is important as well when considering using this panel for risk stratification. Moreover, despite reports documenting stability of the biomarkers after long-term storage, more data is required on this as well as a larger sample size before determining what the proper concentration cutoffs are for each of the biomarkers in the panel test. Thus it would be important to assess this strategy in prospective studies, thus allowing real-time measurements as well as testing other pre-analytical and storage conditions to determine the effect these have on the panel test interpretation. In conclusion, observational studies are by nature hypothesis generating. With better assays and more studies to suggest clinical utility, larger more controlled or even randomized trials might be justified in using this panel test to determine if early risk identification translates to better outcomes in ACS patients presenting early after onset of pain.
Acknowledgments
This work was supported by a grant from the Canadian Institutes of Health Research. The Cell Adhesion array was contributed for the study by Randox Laboratories Ltd. Special thanks to the staff at the Clinical Research and Clinical Trials Laboratory at the Hamilton Regional Laboratory Medicine Program and Randox Laboratories Ltd. for technical support.
References
- 1.Apple FS, Wu AH, Mair J, et al. Future biomarkers for detection of ischemia and risk stratification in acute coronary syndrome. Clin Chem. 2005;51:810–24. doi: 10.1373/clinchem.2004.046292. [DOI] [PubMed] [Google Scholar]
- 2.Jaffe AS, Babuin L, Apple FS. Biomarkers in acute cardiac disease: the present and the future. J Am Coll Cardiol. 2006;48:1–11. doi: 10.1016/j.jacc.2006.02.056. [DOI] [PubMed] [Google Scholar]
- 3.Jaffe AS. Cardiovascular biomarkers: the state of the art in 2006. Clin Chim Acta. 2007;381:9–13. doi: 10.1016/j.cca.2007.02.029. [DOI] [PubMed] [Google Scholar]
- 4.Lindmark E, Diderholm E, Wallentin L, Siegbahn A. Relationship between interleukin 6 and mortality in patients with unstable coronary artery disease. JAMA. 2001;286:2107–13. doi: 10.1001/jama.286.17.2107. [DOI] [PubMed] [Google Scholar]
- 5.Jernberg T, Lindahl B, Siegbahn A, et al. N-Terminal pro-brain natriuretic peptide in relation to inflammation, myocardial necrosis, and the effect of an invasive strategy in unstable coronary artery disease. J Am Coll Cardiol. 2003;42:1909–16. doi: 10.1016/j.jacc.2003.07.015. [DOI] [PubMed] [Google Scholar]
- 6.Maier W, Altwegg LA, Corti R, et al. Inflammatory markers at the site of ruptured plaque in acute myocardial infarction: locally increased interleukin-6 and serum amyloid A but decreased C-reactive protein. Circulation. 2005;111:1355–61. doi: 10.1161/01.CIR.0000158479.58589.0A. [DOI] [PubMed] [Google Scholar]
- 7.Aukrust P, Berg RK, Ueland T, et al. Interaction between chemokines and oxidative stress: possible pathogenic role in acute coronary syndromes. J Am Coll Cardiol. 2001;37:485–91. doi: 10.1016/s0735-1097(00)01110-4. [DOI] [PubMed] [Google Scholar]
- 8.Heeschen C, Dimmeler S, Hamm CW, Fichtlscherer S, Simoons ML, Zeilher AM. Pregnancy-associated plasma protein-a levels in patients with acute coronary syndromes. J Am Coll Cardiol. 2005;45:229–37. doi: 10.1016/j.jacc.2004.09.060. [DOI] [PubMed] [Google Scholar]
- 9.Lee KW, Lip GY, Blann AD. Plasma angiopoietin-1, angiopoietin-2, angiopoietin receptor tie-2, and vascular endothelial growth factor levels in acute coronary syndromes. Circulation. 2004;110:2355–60. doi: 10.1161/01.CIR.0000138112.90641.7F. [DOI] [PubMed] [Google Scholar]
- 10.de Lemos JA, Morrow DA, Sabatine MS, et al. Association between plasma levels of monocyte chomoattractant protein-1 and long-term clinical outcomes in patients with acute coronary syndromes. Circulation. 2003;107:690–5. doi: 10.1161/01.cir.0000049742.68848.99. [DOI] [PubMed] [Google Scholar]
- 11.Wang J, Zhang S, Jin Y, Qin G, Yu L, Zhang J. Elevated levels of platelet–monocyte aggregates and related circulating biomarkers in patients with acute coronary syndrome. Int J Cardiol. 2007;115:361–5. doi: 10.1016/j.ijcard.2006.03.019. [DOI] [PubMed] [Google Scholar]
- 12.Kavsak PA, MacRae AR, Lustig V, et al. The impact of the ESC/ACC redefinition of myocardial infarction and new sensitive troponin assays on the frequency of acute myocardial infarction. Am Heart J. 2006;152:118–25. doi: 10.1016/j.ahj.2005.09.022. [DOI] [PubMed] [Google Scholar]
- 13.MacRae AR, Kavsak PA, Lustig V, et al. Assessing the requirement for the six-hour interval between specimens in the American Heart Association classification of myocardial infarction in epidemiology and clinical research studies. Clin Chem. 2006;52:812–8. doi: 10.1373/clinchem.2005.059550. [DOI] [PubMed] [Google Scholar]
- 14.Kavsak PA, Newman AM, Lustig V, et al. Long-term health outcomes associated with detectable troponin I concentrations. Clin Chem. 2007;53:220–7. doi: 10.1373/clinchem.2006.076885. [DOI] [PubMed] [Google Scholar]
- 15.Kavsak PA, MacRae AR, Newman AM, et al. Effects of contemporary troponin assay sensitivity on the utility of the early markers myoglobin and CKMB isoforms in evaluating patients with possible acute myocardial infarction. Clin Chim Acta. 2007;380:213–6. doi: 10.1016/j.cca.2007.01.001. [DOI] [PubMed] [Google Scholar]
- 16.Berrahmoune H, Lamont JV, Herbeth B, Fitzgerald PS, Visvikis-Siest S. Biological determinants of reference values for plasma interleukin-8, monocyte chemoattractant protein-1, epidermal growth factor, and vascular endothelial growth factor: results from the STANISLAS Cohort. Clin Chem. 2006;52:504–10. doi: 10.1373/clinchem.2005.055798. [DOI] [PubMed] [Google Scholar]
- 17.Kenis G, Teunissen C, De Jongh R, Bosmans E, Steinbusch H, Maes M. Stability of interleukin 6, soluble interleukin 6 receptor, interleukin 10 and CC16 in human serum. Cytokine. 2002;19:228–35. [PubMed] [Google Scholar]
- 18.Blankenberg S, McQueen M, Smieja M, et al. Comparative impact of multiple biomarkers and N-terminal pro-brain natriuretic peptide in the context of conventional risk factors for the prediction of recurrent cardiovascular events in the Heart Outcomes Prevention Evaluation (HOPE) Study. Circulation. 2006;114:201–8. doi: 10.1161/CIRCULATIONAHA.105.590927. [DOI] [PubMed] [Google Scholar]
- 19.Kragelund C, Gronning B, Kober L, Hildebrandt P, Steffensen R. N-Terminal Pro-B-type natriuretic peptide and long-term mortality in stable coronary heart disease. N Engl J Med. 2005;352:666–75. doi: 10.1056/NEJMoa042330. [DOI] [PubMed] [Google Scholar]
- 20.Malik I, Danesh J, Whincup P, et al. Soluble adhesion molecules and prediction of coronary heart disease: a prospective study and meta-analysis. Lancet. 2001;358:971–6. doi: 10.1016/S0140-6736(01)06104-9. [DOI] [PubMed] [Google Scholar]
- 21.Venge P, Lindahl B, Wallentin L. New generation cardiac troponin I assay for the access immunoassay system. Clin Chem. 2001;47:959–61. [PubMed] [Google Scholar]
- 22.Zethelius B, Johnston N, Venge P. Troponin I as a predictor of coronary heart disease and mortality in 70-year-old men: a community-based cohort study. Circulation. 2006;113:1071–8. doi: 10.1161/CIRCULATIONAHA.105.570762. [DOI] [PubMed] [Google Scholar]
- 23.Apple FS, Quist HE, Doyle PJ, Otto AP, Murakami MM. Plasma 99th percentile reference limits for cardiac troponin and creatine kinase MB mass for use with European Society of Cardiology/American College of Cardiology Consensus Recommendations. Clin Chem. 2003;49:1331–6. doi: 10.1373/49.8.1331. [DOI] [PubMed] [Google Scholar]
- 24.Austin PC, Daly PA, Tu JV. A multicentre study of the coding accuracy of hospital discharge administrative data for patients admitted to cardiac care units in Ontario. Am Heart J. 2002;144:290–6. doi: 10.1067/mhj.2002.123839. [DOI] [PubMed] [Google Scholar]
- 25.Tu JV, Pashos C, Naylor CD, et al. Use of cardiac procedures and outcomes in elderly patients with myocardial infarction in the United States and Canada. N Engl J Med. 1997;336:1500–5. doi: 10.1056/NEJM199705223362106. [DOI] [PubMed] [Google Scholar]
- 26.Blake GJ, Ridker PM. C-reactive protein and other inflammatory risk markers in acute coronary syndromes. J Am Coll Cardiol. 2003;41:37S–42S. doi: 10.1016/s0735-1097(02)02953-4. [DOI] [PubMed] [Google Scholar]
- 27.Deliargyris EN, Raymond RJ, Theoharides TC, Boucher WS, Tate DA, Dehmer GJ. Sites of interleukin-6 release in patients with acute coronary syndrome and in patients with congestive heart failure. Am J Cardiol. 2000;86:913–8. doi: 10.1016/s0002-9149(00)01121-8. [DOI] [PubMed] [Google Scholar]