

Abstract
Using resting-state functional magnetic resonance imaging data from two independent samples of healthy adults, we parsed the amygdala's intrinsic connectivity into three partially distinct large-scale networks that strongly resemble the known anatomical organization of amygdala connectivity in rodents and monkeys. Moreover, in a third independent sample, we discovered that people who fostered and maintained larger and more complex social networks not only had larger amygdala volumes, but also amygdalae with stronger intrinsic connectivity within two of these networks: one putatively subserving perceptual abilities and one subserving affiliative behaviors. Our findings were anatomically specific to amygdalar circuitry in that individual differences in social network size and complexity could not be explained by the strength of intrinsic connectivity between nodes within two networks that do not typically involve the amygdala (i.e., the mentalizing and mirror networks), and were behaviorally specific in that amygdala connectivity did not correlate with other self-report measures of sociality.
Introduction
Like most primates, humans are a very social species. For humans, other people can be a source of stress or the greatest source of joy. Having a rich social network with many relationships has quantifiable health benefits (Cohen et al., 1997; Hawkley and Cacioppo, 2010). Yet people vary greatly from one another in the size of their social networks (Dunbar and Spoors, 1995; Hill and Dunbar, 2003). In 2011, our laboratory demonstrated that individuals with larger amygdala volumes have larger and more complex social networks (Bickart et al., 2011). This initial study extended comparative neuroanatomy findings that, across species, primates living in larger social groupings also have larger amygdalae (Barton and Aggleton, 2000; Barton, 2006). Building on this work, two recent papers have shown that the amygdala's gray matter density is correlated with both online and real-world social network size (Kanai et al., 2012), and seems to increase in monkeys housed in larger social groups (Sallet et al., 2011). Although the amygdala is a key structure within the “social brain” (Brothers, 1990; Lieberman, 2007; Adolphs, 2009), individuals with larger social networks also have more gray matter in other brain regions implicated in adaptive social behaviors such as the subgenual anterior cingulate cortex (ACC) (Bickart et al., 2011), ventromedial prefrontal cortex (vmPFC) (Lewis et al., 2011), orbitofrontal cortex (OFC) (Sallet et al., 2011; Powell et al., 2012), superior temporal sulcus (STS), temporal pole, and frontal pole (Sallet et al., 2011).
In this paper, we tested the hypothesis that more socially connected people have brains characterized by stronger intrinsic connectivity between the amygdala and other brain regions subserving social cognition, using resting-state functional connectivity magnetic resonance imaging (fcMRI). Intrinsic connectivity provides a basis for understanding the large-scale anatomic organization of brain networks (Fox and Raichle, 2007), and individual differences in intrinsic connectivity strength within certain networks predicts individual differences in motor function (Fox et al., 2007), memory (Wang et al., 2010), executive function (Seeley et al., 2007), and affect (Seeley et al., 2007; van Marle et al., 2010; Touroutoglou et al., 2012).
Because the amygdala is composed of multiple nuclei with differing connectivity profiles, we first sought to delineate the anatomical networks anchored in the amygdala that might each subserve distinct functions needed to build and maintain larger social networks. Based on our synthesis of published anatomical and functional data in humans and nonhuman animals (see Materials and Methods), we hypothesized that the amygdala would parse into three subregions that each anchor a large-scale network of brain regions implicated in distinct processes of social cognition. The anatomic studies provided a priori hypotheses about the network constitution, and the functional studies supported these hypotheses while providing a priori descriptions of their psychological importance in social cognition. In two independent samples contained in Experiment 1 (n = 89 and n = 83), we tested and replicated our hypothetical neuroanatomical framework using a two-step data-driven fcMRI analytic approach. The results of this first experiment generated three sets of brain regions of interest (ROIs) representing the three hypothesized networks. In the second experiment, using a third independent sample (n = 29), we used the ROIs generated from the first experiment in an a priori fashion to test the hypothesis that the strength of amygdala-based network connectivity would predict social network size and complexity over and above amygdala volume, thereby significantly extending our findings from Bickart et al. (2011).
Materials and Methods
Experiment 1: identifying amygdala-based intrinsic connectivity networks
Participants
Discovery sample.
The discovery sample consisted of 89 young adults (45 females, age M = 22.4, SD = 3.34, range = 18–33 years) (Yeo et al., 2011; Touroutoglou et al., 2012). Participants were included if they were right-handed, native English speakers with normal or corrected-to-normal vision and reported no history of neurological or psychiatric disorders with a confirmed absence of DSM-IV Axis I diagnoses using the Structured Clinical Interview for DSM-IV and were also free of psychoactive medications and had a verbal IQ ≥ 97, performance IQ ≥ 98, and full-scale IQ ≥ 98 as measured by the American National Adult Reading Test. Each participant gave written informed consent in accordance with institutional Human Subjects Research Committee guidelines.
Replication sample.
The replication sample consisted of 83 young adults (53 females, age M = 23.6, SD = 3.13, range = 18–35 years). All participants in this sample fulfilled the same inclusion criteria and consent procedures as the discovery sample.
Amygdala-based networks important for social connectedness
Based on our synthesis of tract-tracing work in rodents and monkeys (Haber and Knutson, 2010; Price and Drevets, 2010; Barbas et al., 2011) and human functional neuroimaging and neuropsychological studies in social cognition (Moll et al., 2005; Lieberman, 2007; Adolphs, 2009; Rilling and Sanfey, 2011), we developed a hypothetical neuroanatomical framework in which separate subregions of the amygdala each anchor a large-scale network of brain regions subserving distinct processes of social cognition (Fig. 1). Specifically, we hypothesized a network supporting social perception would be anchored in the ventrolateral sector of the amygdala, which contains nuclei that share anatomical connections with sensory association areas of the temporal cortex and OFC (Aggleton et al., 1980; Barbas and De Olmos, 1990; Carmichael and Price, 1995; Ghashghaei and Barbas, 2002; Höistad and Barbas, 2008). These regions are implicated in decoding and interpreting social signals from others in the context of past experience and current goals (Morris et al., 1996; Allison et al., 2000; Hart et al., 2000; Phelps et al., 2000; George et al., 2001; Cunningham et al., 2004; Gobbini and Haxby, 2006; Richeson et al., 2008). We hypothesized a network supporting social affiliation would be anchored in the medial sector of the amygdala, which contains nuclei that share anatomical connections with mesolimbic, reward-related areas of the vmPFC, medial temporal lobe, and ventromedial striatum and hypothalamus (McDonald, 1987, 1991a,b; Kunishio and Haber, 1994; Carmichael and Price, 1996; An et al., 1998; Ongür et al., 1998, 2003; Ferry et al., 2000; Ongür and Price, 2000; Fudge et al., 2002; Kondo et al., 2003, 2005; Haber et al., 2006; Hsu and Price, 2007; Price, 2007; Saleem et al., 2008; Haber and Calzavara, 2009; Haber and Knutson, 2010; Price and Drevets, 2010). These regions are implicated in motivating prosocial or affiliative behaviors, such as cooperating with a trustworthy partner or comforting a loved one (Bartels and Zeki, 2004; Rilling et al., 2004; Delgado et al., 2005; Moll et al., 2006, 2007; Harbaugh et al., 2007; Tabibnia et al., 2008; Li et al., 2009; Zahn et al., 2009; Izuma et al., 2010). Finally, we hypothesized a network supporting social aversion would be anchored in the dorsal sector of the amygdala, which contains nuclei that share anatomical connections with interoceptive, pain-sensitive areas of the caudal ACC (cACC), insula, and ventrolateral striatum, hypothalamus, and brainstem (Mufson et al., 1981; McDonald, 1987, 1991a,b; Fudge et al., 2002; Stefanacci and Amaral, 2002). These regions are implicated in motivating avoidant behaviors, such as rejecting cooperation with an unfair partner or avoiding a seemingly untrustworthy stranger (Phillips et al., 1997; Winston et al., 2002; Eisenberger et al., 2003; Sanfey et al., 2003; Moll et al., 2006, 2007; Cheng et al., 2007; Buckholtz et al., 2008; Rilling et al., 2008; Zahn et al., 2009; Kross et al., 2011).
Figure 1.

Hypothetical topographic model of amygdala subregions and their affiliated large-scale networks subserving social cognition. A schematic of (a) the amygdala subregions in coronal view that we hypothesize are anchors for (b) three large-scale networks subserving processes important for social cognition. Ins, insula; SS, somatosensory operculum; dTP, dorsal temporal pole; cACC, caudal anterior cingulate cortex; rACC, rostral anterior cingulate cortex; sgACC, subgenual anterior cingulate cortex; MTL, medial temporal lobe; FG, fusiform gyrus; vTP, ventral temporal pole; vlSt, ventrolateral striatum; vmSt, ventromedial striatum.
Structural MRI data acquisition
Imaging data for the discovery and replication samples were collected on a 3T Magnetom Tim Trio system at Massachusetts General Hospital (Siemens), using a 12-channel phased-array head coil. Structural MRI data for the discovery sample were acquired using a T1-weighted 3D MPRAGE sequence (TR/TE/flip angle = 2.20 s/1.54 ms/7°, resolution = 1.2 mm isotropic). Structural MRI data for the replication sample were acquired using two similar T1-weighted 3D MPRAGE sequences (n = 55: TR/TE/flip angle = 2.30 s/2.98 ms/9°, resolution = 1 mm isotropic; n = 28: TR/TE/flip angle = 2.53 s/3.48 ms/7°, resolution = 1 mm isotropic).
Resting-state fMRI data acquisition and preprocessing
fMRI data for the discovery sample were acquired during rest using a gradient-echo, echo-planar sequence sensitive to blood oxygen level-dependent (BOLD) contrast (discovery sample: TR = 3000 ms; TE = 30 ms; flip angle = 85°, 47 slices; acquisition voxel = 3 mm isotropic; replication sample: TR = 5000 ms; TE = 30 ms; flip angle = 90°, 55 slices, acquisition voxel = 2 mm isotropic). During all resting-state fMRI runs, participants in both samples were directed to keep their eyes open without fixating and to remain as still as possible. In both samples, resting-state fMRI runs were interleaved with task-based fMRI runs, which are unrelated to this study.
Next, resting-state data were preprocessed using a series of algorithms. After removing the first four functional volumes, the following steps were completed: correction for slice-dependent time shifts (SPM2, Wellcome Department of Cognitive Neurology, London, UK), correction for head motion with rigid-body transformation in three translation and three rotations (FMRIB, Oxford, UK), spatial normalization to Montreal Neurological Institute (MNI) atlas space, resampling to 2 mm isotropic voxels, spatial smoothing using a 6 mm full width at half-maximum Gaussian kernel, and temporal bandpass filtering to remove frequencies >0.08 Hz. We then removed sources of spurious variance and their temporal derivatives from the data through linear regression (six parameters derived from the rigid-body head motion correction, the signal averaged over the whole brain, the signal averaged over a region within the deep white matter, and the signal averaged over the ventricles) and the residual BOLD time course was retained for functional connectivity analysis.
Resting-state fMRI connectivity analysis
Delineating connectional subregions of the amygdala.
In validating fcMRI results against nonhuman animal tract-tracing studies, the topography of putative origins and terminations of large-scale networks is often defined using an iterative seed-target-seed approach (Vincent et al., 2006, 2008; Yeo et al., 2011). Using a similar logic, we first tested our hypothetical topographic model of the functional-anatomic organization of brain networks subserving social cognition (Fig. 1).
We identified three brain ROIs outside the amygdala that represent core nodes within each of our three hypothesized networks: lateral OFC (lOFC: MNI coordinates +/− 38, 34, −18), vmPFC (0, 32, −12), and cACC (0, 16, 32), anchoring the perception, affiliation, and aversion networks, respectively (see Fig. 3a). We chose these areas because they are each heavily interconnected with one of the amygdala's subregions and other regions within each respective network (Haber and Knutson, 2010; Price and Drevets, 2010; Barbas et al., 2011).
Figure 3.

Three connectionally defined subregions of the amygdala. a, A priori seed regions were placed within the vmPFC, cACC, and lOFC. b, c, Each voxel in the amygdala was assigned to the seed region with which it demonstrated the strongest connectivity in the discovery sample (N = 89). Connectivity data are overlaid on a T1 MNI152 2 mm template brain in radiologic convention (b) and depicted in a 3D rendering (C).
We selected the MNI coordinates of each seed ROI within each anatomically defined cortical region based on the approximate location of peak voxels derived from a resting-state functional connectivity map of a whole amygdala seed. To generate the resting-state functional connectivity map of the whole amygdala seed, we computed a Pearson's product moment correlation coefficient, r, between fluctuations in BOLD signal within the left and right whole amygdala, averaged between the hemispheres, and all other voxels in the brain for each participant in the discovery sample. We defined the whole amygdala using probabilistic maps from the Harvard–Oxford Subcortical Structural Atlas available for FSL, only including voxels that had 25% or greater probability of being labeled as the amygdala (left: 3368 mm3, right: 3944 mm3). The resultant correlation maps were then converted to z (r) values, which are unbiased estimators of the population correlation coefficients, using Fisher's r-to-z transformation. We conducted a one-sample group mean analysis using the FreeSurfer general linear model command (mri_glmfit with the –osgm flag), which tests whether the correlation z (r) value in each voxel is significantly >0 for the group, producing a group-level statistical significance map (Fig. 2). Next, we searched this significance map to select MNI coordinates approximating voxels of peak significance within each cortical region of interest.
Figure 2.
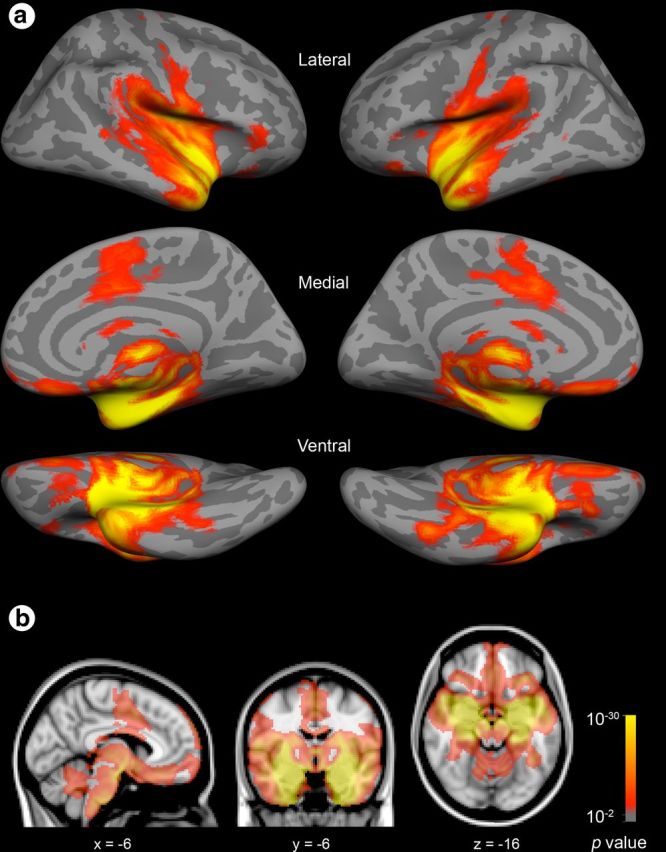
Topography of intrinsic connectivity for the whole amygdala in the discovery sample (N = 89). Intrinsic connectivity statistical significance maps are displayed for left and right amygdala seed regions in the discovery sample. Significance maps were thresholded at p < 0.01, averaged across hemisphere for display purposes, and overlaid on Freesurfer's “fsaverage” surface template (a) and a T1 MNI152 2 mm template brain in radiologic convention (b).
We then created spherical seed ROIs, 3 mm in radius, around each peak voxel and computed a Pearson's product moment correlation coefficient, r, between fluctuations in BOLD signal within these cortical seeds and all voxels in the brain for each participant. We converted the resultant correlation maps to z (r) values and conducted contrast analyses on the z (r) maps from each cortical seed ROI (i.e., cACC > vmPFC and lOFC; vmPFC > cACC and lOFC; lOFC > vmPFC and cACC). Finally, we assigned each voxel within the amygdala (within the Harvard–Oxford 25% probability maps of the whole amygdala) to the cortical region with which it shared the strongest connectivity. We also conducted this analysis using data processed with 2 and 4 mm smoothing kernels to determine whether this would enable finer grained parcellation of amygdala subregions. Because both kernels produced virtually equivalent results to the data smoothed with a 6 mm kernel, we only present the latter results.
Delineating large-scale networks connected to each amygdala subregion.
Next, we constructed spherical seed ROIs, 2 mm in radius, approximating the peak voxel location within each amygdala subregion (making sure that the spheres were centered in the amygdala): dorsal amygdala subregion (MNI coordinates +/−22, −4, −12), medial amygdala subregion (+/−14, −4, −20), and ventrolateral amygdala subregion (+/− 28, −4, −22). We used these seed ROIs to produce resting-state functional connectivity maps by computing Pearson's product moment correlation coefficient, r, between fluctuations in BOLD signal within each amygdala subregion seed ROI, averaged between hemispheres, and all other voxels in the brain for each participant in our discovery sample. We also analyzed the data using the larger subregions of the amygdala as seeds, and found that this method produces virtually equivalent maps (data not shown) to that of the smaller spherical seeds, although there is more overlap between the maps, which is to be expected as a result of autocorrelation effects of adjacent voxels at the borders of the subregions. Thus, we chose to present the maps derived from the smaller spherical seeds. We then converted the resultant correlation maps to z (r) values and conducted a one-sample group mean generalized linear model (GLM) as above. We binarized each amygdala subregion's significance map at p < 10−5 (uncorrected for multiple comparisons with a cluster size constraint of 10 contiguous voxels) to explore the overlapping and unique topography of functional connectivity associated with each subregion. Each of the three maps (excluding voxels that fell within the amygdala ROI) was used as a mask in the brain-behavior analysis below.
Replication of amygdala subregions and networks in an independent sample
To examine the reliability of our findings in the discovery sample, we conducted additional analyses in the independent replication sample (n = 83) with higher resolution scans (2 mm isotropic). For these analyses, we used the same procedures as described for our discovery sample. First, we used the three cortical seed regions (lOFC, vmPFC, cACC) to identify voxels with the strongest connectivity within the amygdala, aiming to replicate the connectional parcellation of the amygdala into subregions. Next, we used this analysis to generate three seeds within the amygdala and then performed an exploratory whole-brain analysis to identify maps of regions sharing functional connectivity with each amygdala seed. In addition to visual inspection of the results, we quantified the similarity of each of the three connectivity maps in the discovery sample to the map from the same seed in the replication sample, calculated using η2 as described in detail previously (Cohen et al., 2008). This is a measure calculated from a pair of maps and indicates the degree of similarity between two maps, with values ranging from 0 (not at all similar) to 1 (identical). The formula computes, on a point-by-point basis, the fraction of the variance in one measure that is accounted for by the variance in another measure.
Experiment 2: amygdala connectivity and social network size
Participants
A third independent sample consisting of 30 young adults (19 females, age M = 24.2, SD = 2.89, range = 19–32 years) was used for the brain-behavior analyses reported in Experiment 2. Using standard self-report measures, participants described their social network size and complexity (Cohen et al., 1997), satisfaction with life (Diener et al., 1985), and availability of social support (Russell et al., 1984). Each also completed structural and resting-state MRI scans. One female participant was excluded from brain-behavior analyses because her computed social network size was 3 SDs greater than the group mean. Amygdala volume and self-report data from 19 participants have been previously published (Bickart et al., 2011). The remaining participants were run after the publication of Bickart et al. (2011). All participants in this sample fulfilled the same inclusion criteria and consent procedures as the two samples reported as part of Experiment 1.
Self-report data acquisition
To assess the size and complexity of participants' social networks in our brain-behavior sample, we used the Social Network Index (SNI) (Cohen et al., 1997), a 13-item questionnaire containing two subscales of interest. The Number of People in Social Network Subscale indexed the size of participants' social networks by counting the total number of people that they interacted with at least once every 2 weeks. The Number of Embedded Networks Subscale indexed the complexity of participants' social networks by counting the total number of different groups with at least four members with whom each participant regularly interacted (e.g., family, friends, church/temple, school, work, neighbors, volunteering, and others). The Number of High-Contact Roles Subscale indexed the diversity of participants' social networks by counting the number of roles that the participant, himself or herself, performed (e.g., mother, child, employer, etc.). Scoring procedures for these subscales can be found online (http://www.psy.cmu.edu/∼scohen/SNIscore.html). As control variables, we also measured participants' reported levels of social support and life satisfaction. We used the Social Provisions Scale (Russell et al., 1984) to assess perceived availability of social support based on participants' views of their current relationships. The scale consists of 24 items (e.g., “I feel part of a group of people who share my attitudes and beliefs.”) rated on a scale from 1 (strongly disagree) to 4 (strongly agree). The Social Provisions Scale provides a summary score as well as a score for six provisions of social relationships including guidance (advice or information), reliable alliance (assurance that others can be counted on in times of stress), reassurance of worth (recognition of one's competence), attachment (emotional closeness), social integration (a sense of belonging to a group of friends), and opportunity for nurturance (providing assistance to others). We used the Satisfaction with Life Scale (Diener et al., 1985) to assess participants' global life satisfaction. The scale consists of five items (e.g., “So far I have gotten the important things I want in life.”) rated on a scale from 1 (strongly agree) to 7 (strongly disagree) and provides an overall life satisfaction score.
Structural MRI data acquisition and morphometric analysis
Imaging data for the brain-behavior sample were collected on a 3T Magnetom Tim Trio system at Massachusetts General Hospital (Siemens), using a 12-channel phased-array head coil. Structural MRI data were acquired using a T1-weighted 3D MPRAGE sequence (TR/TE/flip angle = 2.53 s/3.5 ms/7°, resolution = 1 mm isotropic). To measure amygdala volume, we used FreeSurfer's (http://surfer.nmr.mgh.harvard.edu) automated segmentation method, which employs a manually labeled atlas dataset from 40 individuals to automatically segment and assign neuroanatomic ROI labels to 40 different brain structures (including the amygdala) based on probabilistic estimations. Corrections were made for differences in head size by dividing each participant's amygdala volume by estimated total intracranial volume (Buckner et al., 2004). This automated segmentation procedure has been widely used in volumetric studies and was shown to be comparable in accuracy to that of manual labeling (Fischl et al., 2002) and is reliable across sessions within the same scanner (Jovicich et al., 2009). In the present study, each anatomic dataset was processed using the fully automated algorithm and then the amygdala segmentation was manually verified. A trained operator, blind to the hypothesis, manually inspected the results of the automated segmentation. In the present study, no adjustments, modifications, or edits were made; the results of the automated segmentation were verified as accurate without need for correction. The criteria used for this inspection with regard to the amygdala are an in-house laboratory manual of the boundaries of the amygdala (Wright et al., 2006; Entis et al., 2012).
Resting-state fMRI data acquisition and preprocessing
fMRI data for the brain-behavior sample were acquired during rest using a gradient-echo, echo-planar sequence sensitive to BOLD contrast (128 contiguous volumes; TR = 2000 ms; TE = 30 ms; flip angle = 90°, 33 slices, matrix = 64 × 64; FOV = 200 mm; acquisition voxel = 3.1 × 3.1 × 5.0). During all resting-state fMRI runs, participants were directed to keep their eyes open without fixating and to remain as still as possible. Resting-state fMRI runs were interleaved with task-based fMRI runs, which are unrelated to this study. All preprocessing procedures were identical to that of the discovery and replication samples.
A priori ROI-based calculation of connectivity strengths in amygdala-based networks
For brain-behavior analyses in Experiment 2, we measured the strength of intrinsic connectivity between each of the three amygdala subregions and an average of the signal from all the voxels within its respective large-scale network mask defined independently in the discovery and replication samples. This resulted in three amygdala-network intrinsic connectivity strength (z (r)) values for each participant: z (r)ventrolateral amygdala subregion-perception network, z (r)medial amygdala subregion-affiliation network, and z (r)dorsal amygdala subregion-aversion network.
Amygdala-network intrinsic connectivity and social network size analysis
To test the hypothesis that individual differences in the strength of intrinsic amygdala-network connectivity predict larger social network size, over and above amygdala volume, we conducted a series of linear regression analyses using both amygdala volume (adjusted for intracranial volume) and intrinsic connectivity strength as independent variables and social network size as the dependent variable. For each of the two networks that produced significant results in this hypothesis-driven analysis, we also explored the localization of amygdala subregion connectivity within each large-scale network that best predicted social network size. Using FreeSurfer's implementation of GLM analysis, we entered social network size values as the independent variable and the amygdala-network connectivity strength values as the dependent variable. The resultant map was masked by the network mask defined in the discovery sample as above and results were considered significant if they met the criteria of p < 0.01 with a cluster size constraint of 10 contiguous voxels.
Finally, to assess the discriminant validity of the a priori hypothesized relationships, we tested whether the strength of connectivity within two social-relevant but nonamygdala-based networks (serving as controls for the prior analyses) predicted variance in social network size and complexity. We defined a mentalizing network composed of the dorsomedial prefrontal cortex (MNI coordinates 0, 50, 24), precuneus (0, −64, 40), and temporoparietal junction (+/− 50, −58, 24) and a mirror network composed of the ventral premotor cortex (+/− 40, 4, 44), posterior STS (+/− 50, −58, 8), and intraparietal sulcus (+/− 40, −44, 46) using coordinates derived from a recent meta-analysis of mentalizing and mirroring tasks in fMRI studies (Van Overwalle and Baetens, 2009). We created spherical nodes, 3 mm in radius, around each of these MNI coordinates and computed pairwise correlations z (r) between the averaged BOLD signal time course in each node. We then computed a composite connectivity strength for each of these networks by averaging across all pairwise z (r) correlations between nodal pairs within the network. We only included nodal pairs that demonstrated pairwise z (r) correlations that were reliably greater than zero in both samples (n = 89 and n = 29) in the calculation of composite connectivity strength scores.
As another test of discriminant validity, we examined whether the strength of connectivity in any of the amygdala networks correlated with other self-report measures of sociality including perceived social support and life satisfaction.
Brain-behavior analyses were conducted using PASW Statistics 18, Release Version 18.0.0 (SPSS, 2009, Chicago, IL, www.spss.com). For these analyses, we selected an α of 0.05.
Results
Experiment 1: identifying amygdala-based intrinsic connectivity networks
As predicted, using the three cortical ROIs as seed regions, the connectional analysis revealed three voxel clusters within the amygdala (Fig. 3b). As predicted, we found the strongest connectivity between the lOFC and the ventrolateral amygdala, the vmPFC and the medial amygdala, and the cACC with the dorsal amygdala. These connectionally defined amygdala subregions strongly resemble the subregions of the amygdala depicted in Figure 1a as well as cytoarchitectonically defined nuclear groups of the amygdala (Fig. 4).
Figure 4.
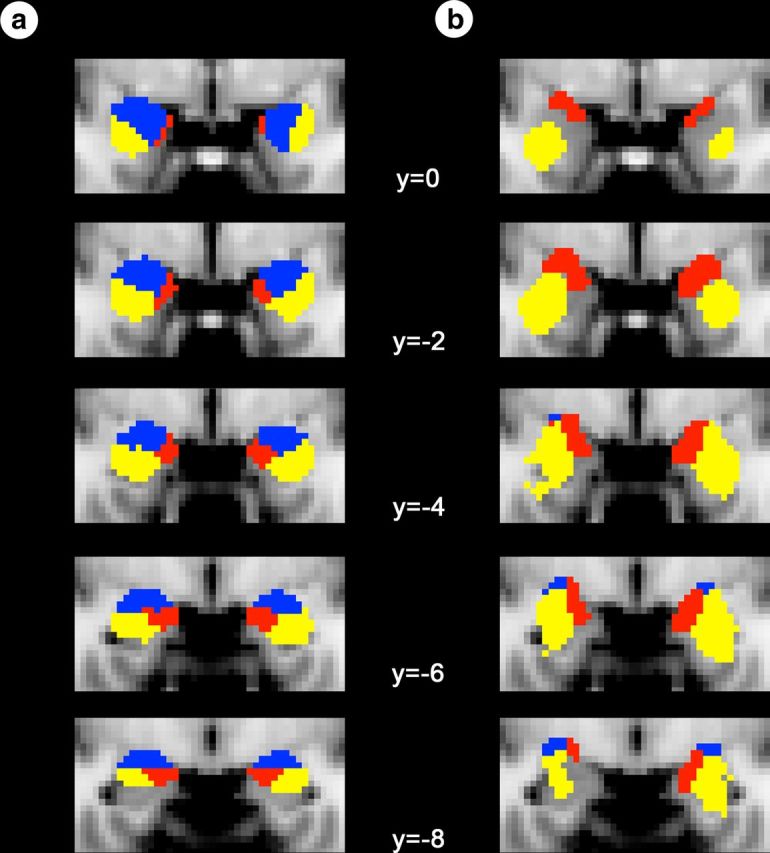
Connectionally defined amygdala subregions from this study and cytoarchitectonically defined amygdala subregions from the Juelich Histological Atlas. Connectionally defined amygdala subregions from our study (a) and cytoarchitectonically defined amygdala subregions obtained from FSL's Juelich Histological Atlas (b) are overlaid on coronal slices of a T1 MNI152 2 mm template brain in radiologic convention. MNI coordinates can be seen in the middle of the figure. The cytoarchitectonically defined subregions are based on probabilistic maps created by Amunts et al. (2005). They include only the voxels that had at least a 50% chance of being assigned to one nuclear group (laterobasal, yellow; superficial, red; centromedial, blue), as used in a previous fcMRI study of these amygdala subregions (Roy et al., 2009).
Using spherical seed ROIs placed within each amygdala subregion (Fig. 5a), we next delineated partially distinct large-scale intrinsic functional connectivity maps (Fig. 5b–d) for a network supporting social perception, a network supporting social affiliation, and a network supporting social aversion; these networks largely resemble the hypothesized networks derived from animal tract-tracing studies and human task-related fMRI studies (Fig. 1b). As predicted, the ventrolateral amygdala subregion showed strongest connectivity with areas important for perceptual processes including the fusiform gyrus and neighboring areas of the ventromedial temporal cortex extending to the pole, as well as the rostral STS, and caudal, medial, and lateral OFC. The medial amygdala subregion showed strongest connectivity with limbic areas important for affiliative behaviors including the vmPFC and neighboring subgenual and rostral ACC, the ventromedial striatum localized largely in the nucleus accumbens, and the ventromedial hypothalamus. Finally, the dorsal amygdala subregion showed strongest connectivity with areas important for aversion behaviors including the cACC, the insula and somatosensory operculum, the ventrolateral striatum localized in the putamen, the caudolateral hypothalamus, and regions in the thalamus and brainstem.
Figure 5.
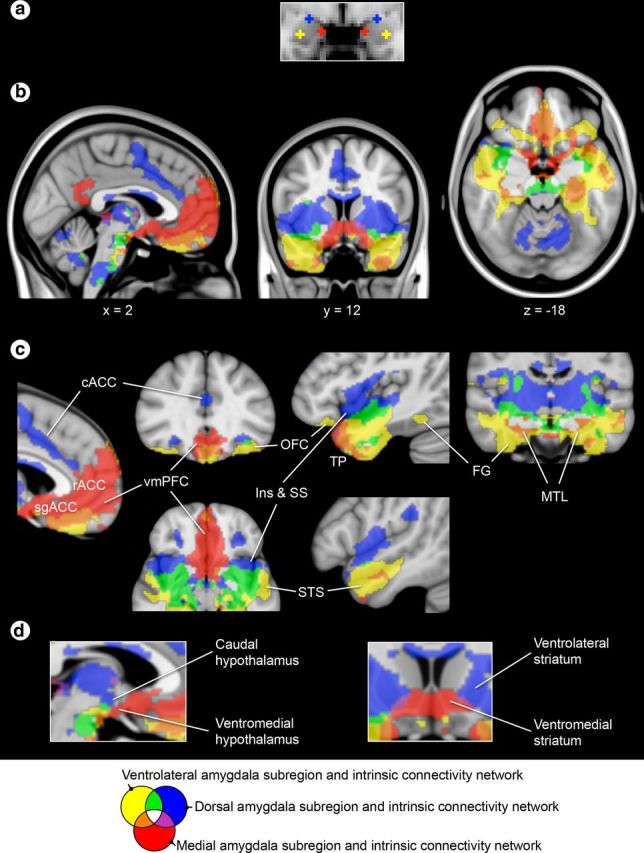
Each amygdala subregion anchors one of three distinct large-scale corticolimbic networks. a, Seeds are localized within the connectionally defined amygdala subregions shown in Figure 2. b–d, One sample group mean statistical significance map for each amygdala seed is displayed in standard views (b) as well as views highlighting specific cortical (c) and subcortical brain regions in the discovery sample (N = 89) (d). The maps are binarized at p < 10−5 and overlaid on a T1 MNI152 0.5 mm template brain in radiologic convention to demonstrate the distinct and shared connectivity across maps. A color key is displayed at the bottom of the figure. cACC, caudal anterior cingulate cortex; Ins, insula; SS, somatosensory operculum; TP, temporal pole; FG, fusiform gyrus; MTL, medial temporal lobe.
We replicated all three amygdala subregions and networks in our independent replication sample. The three initial cortical seed regions (lOFC, vmPFC, and cACC) identified clusters of voxels within the amygdala that were highly similar to those identified within our discovery sample (Fig. 6a,b). Seeds within these three subregions produced large-scale connectivity maps in the replication sample that were reliable with those identified within the discovery sample (Fig. 6c,d). The η2 coefficients were 0.88, 0.82, and 0.86 for lateral, medial, and dorsal amygdala seeds, respectively.
Figure 6.

Replication of amygdala subregions and networks in an independent sample (N = 83). a, A priori seed regions were placed within the vmPFC, cACC, and lOFC. b, Each voxel in the amygdala was assigned to the seed region with which it demonstrated the strongest connectivity in the replication sample (N = 83). The cluster maps are overlaid on a T1 MNI152 2 mm template brain in radiologic convention. c, Seeds within the connectionally defined amygdala subregions. d, One sample group mean statistical significance maps for each amygdala seed displayed in standard views. The maps are binarized at p < 10−5 and overlaid on a MNI152 T1 1.0 mm template brain in radiologic convention. A color key is displayed at the bottom of the figure.
Experiment 2: amygdala connectivity and social network size
As hypothesized, individual differences in the strength of connectivity within the networks supporting social perception and affiliation predicted social network size over and above variations in amygdala volume (which predicted 15% of the variance in social network size). The results demonstrated that participants with stronger amygdala connectivity within these networks had larger social networks relative to those individuals with weaker connectivity within these networks (Fig. 7b). Individual differences in the strength of the amygdala's connectivity within the network supporting social aversion did not predict differences in social network size (Fig. 7b), however. Furthermore, using a multiple linear regression analysis, we found that stronger amygdala connectivity within the networks supporting social perception and affiliation each contributed independently to larger social network size (along with amygdala volume), predicting a total of 41% of its variance (see Table 1). We found similar patterns of results for individual differences in the complexity participants' social networks (i.e., the number of groups in which participants have at least four network members) and the diversity of their networks (i.e., the number of roles participants play within their networks); this is not surprising given that both social network complexity and diversity were strongly correlated with social network size (Tables 2, 3).
Figure 7.

A larger social network is predicted by stronger connectivity between amygdala subregions and corticolimbic regions important for perception and affiliative behavior. a, Each amygdala subregion and its intrinsic connectivity network were independently defined in the discovery sample (shown here) and then used in the brain-behavior sample to compute the connectivity strength between each amygdala subregion and the rest of the network. b, Scatter plots show that social network size (y-axis) is predicted by the strength of connectivity between two of the three amygdala subregions and their respective networks (x-axis), over and above amygdala volume, in the brain-behavior sample. *p < 0.05; †p = 0.06; **the x-axis displays the residual variance in the strength of the resting-state connectivity measure (Fisher's r-to-z) after partialling out its shared variance with amygdala volume.
Table 1.
Larger amygdala volume and stronger intrinsic connectivity of the ventrolateral and medial amygdala subregions each contributed independently to larger social network size in our brain-behavior sample (N = 29)
| Social network size |
|||
|---|---|---|---|
| B | R2 change | Total R2 | |
| Mean adjusted amygdala volume | 0.35* | 0.14 | 0.41 |
| Strength of the ventrolateral amygdala's connectivity within the network supporting social perception | 0.40* | 0.16 | |
| Strength of the medial amygdala's connectivity within the network supporting social affiliation | 0.34* | 0.12 | |
Note: This table displays standardized regression coefficients (B) as well as the incremental (R2 change) and total variance (Total R2) in social network size predicted by the independent variables entered into a single multiple linear regression model. Mean adjusted amygdala volume was corrected for total intracranial volume (as described in the text).
*p < 0.05.
Table 2.
Larger amygdala volumes and stronger intrinsic connectivity for the ventrolateral and medial amygdala subregions each contributed independently to more complex social networks in our brain-behavior sample (N = 29)
| Social network complexity |
|||
|---|---|---|---|
| B | R2 change | Total R2 | |
| Mean adjusted amygdala volume | 0.43* | 0.19 | 0.39 |
| Strength of the medial amygdala's connectivity within the network supporting social affiliation | 0.32* | 0.10 | |
| Strength of the ventrolateral amygdala's connectivity within the network supporting social perception | 0.30† | 0.09 | |
Note: This table displays standardized regression coefficients (B) as well as the incremental (R2 change) and total variance (Total R2) in social network complexity predicted by all independent variables entered into a single multiple linear regression model. Mean adjusted amygdala volume was corrected for total intracranial volume (as described in the text).
*p < 0.05;
†p = 0.07.
Table 3.
Larger amygdala volumes and stronger intrinsic functional connectivity for the ventrolateral amygdala subregion each contributed independently to more diverse social networks in our brain-behavior sample (N = 29)
| Social network diversity |
|||
|---|---|---|---|
| B | R2 change | Total R2 | |
| Mean adjusted amygdala volume | 0.30† | 0.12 | 0.28 |
| Strength of the ventrolateral amygdala's connectivity within the network supporting social perception | 0.40* | 0.16 | |
Note: This table displays standardized regression coefficients (B) as well as the incremental (R2 change) and total variance (Total R2) in social network diversity predicted by both independent variables entered into a single multiple linear regression model. Mean adjusted amygdala volume was corrected for total intracranial volume (as described in the text).
*p < 0.05;
†p = 0.10.
We next explored the specific regions within the networks supporting social perception and affiliation that were driving the relationship between intrinsic connectivity and social network size. As seen in Figure 8, people with larger social networks had stronger connectivity between the ventrolateral amygdala and the STS and fusiform gyrus within the network supporting social perception. They also had stronger connectivity between the medial amygdala and the vmPFC within the network supporting social affiliation. See Table 4 for MNI coordinates of these and additional regions that demonstrated correlations with social network size.
Figure 8.

Exploratory analyses revealed that the connectivity between the amygdala and specific regions within the networks supporting social perception and affiliation are the best predictors of social network size. a, Brain images show location of voxels within the medial and ventrolateral amygdala's intrinsic connectivity networks (defined in the discovery sample) that correlated with social network size at p < 0.01 in the brain-behavior sample, uncorrected with a cluster size constraint of 10 voxels. Color bars indicate the p values (10−2–10−4) of correlated voxels, which are overlaid on slices of a T1 MNI152 0.5 mm template brain in radiologic convention. b, Scatter plots show the effects for peak voxels with the strength of intrinsic connectivity on the y-axis and social network size on the x-axis; **p < 0.001.
Table 4.
Regions within the ventrolateral and medial amygdala's intrinsic connectivity networks (defined in the discovery sample) that correlated with social network size in an exploratory GLM analysis in our brain-behavior sample (N = 29)
| MNI coordinates of peak voxels |
r | |||
|---|---|---|---|---|
| x | y | z | ||
| Ventrolateral amygdala subregion's intrinsic connectivity with the following regions correlated with social network size | ||||
| Superior temporal sulcus | −50 | −4 | −20 | 0.59** |
| Fusiform gyrus | 38 | −10 | −40 | 0.62** |
| −40 | 4 | −44 | 0.56* | |
| Rostral hippocampus | 24 | −10 | −24 | 0.50* |
| Caudal hippocampus | 24 | −30 | −10 | 0.58** |
| −24 | −30 | −12 | 0.57* | |
| Caudal orbitofrontal cortex | 26 | 10 | −22 | 0.58** |
| Medial amygdala subregion's intrinsic connectivity with the following regions correlated with social network size | ||||
| Ventromedial prefrontal cortex | 2 | 40 | −8 | 0.63** |
Note: This table displays Pearson's r values and MNI coordinates for voxels within the ventrolateral and medial amygdala subregions' intrinsic connectivity networks in which connectivity strength correlated with social network size at a p value greater than 0.01 (two-tailed).
*p < 0.01;
**p < 0.001.
A final set of analyses characterized the anatomical and behavioral specificity of the results above. Intrinsic connectivity within two networks important for social cognition, but not involving the amygdala—the mentalizing and mirror networks—was not related to either social network size or complexity (r = 0.01–0.02; p > 0.3). Intrinsic amygdala connectivity was not related to other self-report measures of sociality, perceived social support or life satisfaction (r = −0.28–0.16; p > 0.15).
Discussion
Amygdala-based intrinsic connectivity networks
In this paper, we used resting-state fcMRI data in humans to refine our understanding of the topography of amygdala connectivity and investigate its relationship to social network size. In the first experiment, using a priori predictions derived from anatomical organization of the amygdala's connectivity in rodents and monkeys (Haber and Knutson, 2010; Price and Drevets, 2010; Barbas et al., 2011), we parsed the amygdala's intrinsic connectivity into three partially distinct large-scale networks. Specifically, we found distinct connectivity between three major subdivisions of the amygdala and limbic cortical structures as well as the ventral striatum, hypothalamus, and brainstem. This is congruent with prior work that directly demonstrated a correspondence between the topography of resting-state functional connectivity and anatomical connectivity in monkeys (Vincent et al., 2007). Moreover, our data-driven approach extends previous studies that have used similar approaches including tract-tracing in animals (McDonald, 1991a,b) and diffusion tensor imaging in humans (Bach et al., 2011; Saygin et al., 2011) to delineate subregions of the amygdala based on connectional profiles. The overall topography of the three amygdala-based networks identified here converges with and builds on previous human resting-state functional connectivity studies of the amygdala (Roy et al., 2009; van Marle et al., 2010; Kim et al., 2011).
Amygdala connectivity and social network size
A growing body of work is revealing that resting-state intrinsic connectivity reflects functional properties of the brain that relate to individual differences in a variety of abilities and behaviors (Fox et al., 2007; Seeley et al., 2007; van Marle et al., 2010; Wang et al., 2010; Touroutoglou et al., 2012). To date, no study has yet investigated whether people with larger social networks possess stronger connectivity between brain regions subserving adaptive social behaviors, although Sallet et al. (2011) did report that monkeys housed with larger (versus smaller) cohorts had stronger intrinsic connectivity between the STS and ACC; connectivity of the amygdala was not reported in that study. In the second experiment reported here, we discovered that people who fostered and maintained larger and more complex social networks not only had larger amygdala volumes, but also had stronger intrinsic connectivity between the amygdala and regions of the brain implicated in perceptual and affiliative, but not avoidant, aspects of social cognition. This finding suggests that the dorsal amygdala (associated with the aversion network, putatively motivating decisions about who to avoid, punish, or reject) might not be directly relevant to social network size or complexity. Stronger intrinsic connectivity between the amygdala and regions in this network has been recently observed in healthy participants in the acute aftermath of stress induction (van Marle et al., 2010), suggesting that the amygdala's role in social cognition and anxiety might be separable.
Our network and region-level findings for the network supporting social perception are consistent with a growing body of neuroimaging and neuropsychological work that implicates regions within this network in processing social cues, such as socially salient features in the human face including facial expressions, racial identity, and trustworthiness (Morris et al., 1996; Phelps et al., 2000; Winston et al., 2002; Cunningham et al., 2004). Although we did not directly test the functional role of this network, in the context of this prior work, our findings suggest that people with stronger intrinsic amygdala connectivity within the perception network, particularly with the STS and fusiform gyrus, might be better at detecting and decoding the meaning of these social cues and thus better able to navigate the dynamic and often-ambiguous nature of social interactions with more people in more social contexts. In line with this interpretation, findings from recent functional neuroimaging studies suggest that the amygdala plays a modulatory role within this network, capable of enhancing neural responses in visual areas and perceptual ability for affect-laden stimuli (Duncan and Barrett, 2007; Pessoa, 2011). For example, enhanced amygdala activity is linked to increased visual acuity (Lim et al., 2009) and greater visual cortex activation including area V1 (Padmala and Pessoa, 2008). Similarly, the normal enhancement of fMRI signal in the fusiform gyrus and STS to affective facial expressions is reduced in amygdala-damaged patients compared with controls (Vuilleumier et al., 2004). The magnitude of this reduction correlates with the degree of amygdalar damage.
Our network and region-level findings for the network supporting social affiliation are consistent with a growing body of neuroimaging and neuropsychological work in human social and moral judgment and decision making that implicates regions within this network in processing socially rewarding stimuli, generating sentiments of social attachment, and motivating prosocial behaviors involved in cooperation, trust, and altruism (Moll et al., 2005; Rilling and Sanfey, 2011). Although we did not directly test the functional role of this network, in the context of this prior work, our findings suggest that people with enhanced functional connectivity between the amygdala and this circuitry, particularly the vmPFC, might derive more value from connecting with others, which would motivate them to form and maintain more social relationships. In line with this interpretation, people who place a higher premium on connecting with others, or exhibit a heightened “propensity to connect,” tend to have larger social networks (Totterdell et al., 2008). Also supporting this interpretation, a recent study found that bonobos, characterized by their cooperative social nature, had larger tracts measured with diffusion-tensor imaging between the amygdala and the vmPFC than chimpanzees who are a more aggressive primate species (Rilling et al., 2012).
Furthermore, the link between intrinsic connectivity and social network size/complexity was anatomically specific to corticolimbic networks including the amygdala; we found no link between social network characteristics and intrinsic connectivity strength in the mentalizing and mirror networks that have been implicated in social cognition, but which do not routinely include the amygdala or other affective circuitry. This dissociation underscores the value of studying the component processes that contribute to social connectedness since there are clearly important divisions of labor. In this case, the size and complexity of a person's social network depends more on corticolimbic circuitry that is important for affective processing (Barrett and Bar, 2009), which in part evaluates the salience of signals from other people (Seeley et al., 2007), than on corticocortical networks that have more limited relevance for affective processing.
Conclusions
Humans with amygdalae that are more strongly connected to brain regions important for social perception and affiliation also have larger and more complex social networks. These findings begin to suggest the mechanisms that support larger and more complex social networks. More connected individuals might be better equipped to perceive social cues like facial expression and be more motivated to or receive more reward from responding to these cues in a manner that promotes social affiliation. A limitation in the present investigation and all similar human studies to date is that their design precludes causal inferences: we do not yet know whether these structural and functional properties of the social brain are inborn and thus endow an individual with the propensity to be more gregarious or whether they are potentially modifiable by experience. A recent study in monkeys suggests that brain structure changes with social experience (Sallet et al., 2011), although this conclusion is not firm because the monkeys were not randomly assigned to cages for living groups of different sizes. A parsing of social function into specific processes subserved by distinct brain networks will enable future research to focus on how these psychological processes and their neural correlates not only differ among healthy adults but also how they fail to develop or disintegrate in neuropsychiatric conditions marked by social impairment like autism, antisocial personality disorder, and frontotemporal dementia.
Footnotes
This study was supported by grants from the U.S. National Institutes of Health Director's Pioneer Award (DP1OD003312) and the U.S. National Institute on Aging (R01-AG030311, R01-AG029411 and P50-AG005134). The content is solely the responsibility of the authors and does not necessarily represent the official views of the National Institutes of Health or the National Institute on Aging. We thank Randy Buckner for providing the data used in the analysis of the discovery sample and the tools used for fcMRI preprocessing and Rebecca Dautoff for assistance.
References
- Adolphs R. The social brain: neural basis of social knowledge. Annu Rev Psychol. 2009;60:693–716. doi: 10.1146/annurev.psych.60.110707.163514. [DOI] [PMC free article] [PubMed] [Google Scholar]
- Aggleton JP, Burton MJ, Passingham RE. Cortical and Sub-Cortical Afferents to the Amygdala of the Rhesus-Monkey (Macaca-Mulatta) Brain Res. 1980;190:347–368. doi: 10.1016/0006-8993(80)90279-6. [DOI] [PubMed] [Google Scholar]
- Allison T, Puce A, McCarthy G. Social perception from visual cues: role of the STS region. Trends Cogn Sci. 2000;4:267–278. doi: 10.1016/s1364-6613(00)01501-1. [DOI] [PubMed] [Google Scholar]
- Amunts K, Kedo O, Kindler M, Pieperhoff P, Mohlberg H, Shah NJ, Habel U, Schneider F, Zilles K. Cytoarchitectonic mapping of the human amygdala, hippocampal region and entorhinal cortex: intersubject variability and probability maps. Anat Embryol. 2005;210:343–352. doi: 10.1007/s00429-005-0025-5. [DOI] [PubMed] [Google Scholar]
- An X, Bandler R, Ongür D, Price JL. Prefrontal cortical projections to longitudinal columns in the midbrain periaqueductal gray in macaque monkeys. J Comp Neurol. 1998;401:455–479. [PubMed] [Google Scholar]
- Bach DR, Behrens TE, Garrido L, Weiskopf N, Dolan RJ. Deep and superficial amygdala nuclei projections revealed in vivo by probabilistic tractography. J Neurosci. 2011;31:618–623. doi: 10.1523/JNEUROSCI.2744-10.2011. [DOI] [PMC free article] [PubMed] [Google Scholar]
- Barbas H, De Olmos J. Projections from the amygdala to basoventral and mediodorsal prefrontal regions in the rhesus monkey. J Comp Neurol. 1990;300:549–571. doi: 10.1002/cne.903000409. [DOI] [PubMed] [Google Scholar]
- Barbas H, Zikopoulos B, Timbie C. Sensory pathways and emotional context for action in primate prefrontal cortex. Biol Psychiatry. 2011;69:1133–1139. doi: 10.1016/j.biopsych.2010.08.008. [DOI] [PubMed] [Google Scholar]
- Barrett LF, Bar M. See it with feeling: affective predictions during object perception. Philos Trans R Soc Lond B Biol Sci. 2009;364:1325–1334. doi: 10.1098/rstb.2008.0312. [DOI] [PMC free article] [PubMed] [Google Scholar]
- Bartels A, Zeki S. The neural correlates of maternal and romantic love. Neuroimage. 2004;21:1155–1166. doi: 10.1016/j.neuroimage.2003.11.003. [DOI] [PubMed] [Google Scholar]
- Barton RA. Olfactory evolution and behavioral ecology in primates. Am J Primatol. 2006;68:545–558. doi: 10.1002/ajp.20251. [DOI] [PubMed] [Google Scholar]
- Barton RA, Aggleton JP. Aggleton JP, editor. Primate evolution and the amygdala. The amygdala: a functional analysis. 2000:480–508. [Google Scholar]
- Bickart KC, Wright CI, Dautoff RJ, Dickerson BC, Barrett LF. Amygdala volume and social network size in humans. Nat Neurosci. 2011;14:163–164. doi: 10.1038/nn.2724. [DOI] [PMC free article] [PubMed] [Google Scholar]
- Brothers L. The social brain: a project for integrating primate behavior and neurophysiology in a new domain. Concepts Neurosci. 1990;1:27–51. [Google Scholar]
- Buckholtz JW, Asplund CL, Dux PE, Zald DH, Gore JC, Jones OD, Marois R. The neural correlates of third-party punishment. Neuron. 2008;60:930–940. doi: 10.1016/j.neuron.2008.10.016. [DOI] [PubMed] [Google Scholar]
- Buckner RL, Head D, Parker J, Fotenos AF, Marcus D, Morris JC, Snyder AZ. A unified approach for morphometric and functional data analysis in young, old, and demented adults using automated atlas-based head size normalization: reliability and validation against manual measurement of total intracranial volume. Neuroimage. 2004;23:724–738. doi: 10.1016/j.neuroimage.2004.06.018. [DOI] [PubMed] [Google Scholar]
- Carmichael ST, Price JL. Limbic connections of the orbital and medial prefrontal cortex in macaque monkeys. J Comp Neurol. 1995;363:615–641. doi: 10.1002/cne.903630408. [DOI] [PubMed] [Google Scholar]
- Carmichael ST, Price JL. Connectional networks within the orbital and medial prefrontal cortex of macaque monkeys. J Comp Neurol. 1996;371:179–207. doi: 10.1002/(SICI)1096-9861(19960722)371:2<179::AID-CNE1>3.0.CO;2-#. [DOI] [PubMed] [Google Scholar]
- Cheng Y, Lin CP, Liu HL, Hsu YY, Lim KE, Hung D, Decety J. Expertise modulates the perception of pain in others. Curr Biol. 2007;17:1708–1713. doi: 10.1016/j.cub.2007.09.020. [DOI] [PubMed] [Google Scholar]
- Cohen AL, Fair DA, Dosenbach NU, Miezin FM, Dierker D, Van Essen DC, Schlaggar BL, Petersen SE. Defining functional areas in individual human brains using resting functional connectivity MRI. Neuroimage. 2008;41:45–57. doi: 10.1016/j.neuroimage.2008.01.066. [DOI] [PMC free article] [PubMed] [Google Scholar]
- Cohen S, Doyle WJ, Skoner DP, Rabin BS, Gwaltney JM., Jr Social ties and susceptibility to the common cold. JAMA. 1997;277:1940–1944. [PubMed] [Google Scholar]
- Cunningham WA, Johnson MK, Raye CL, Chris Gatenby J, Gore JC, Banaji MR. Separable neural components in the processing of black and white faces. Psychol Sci. 2004;15:806–813. doi: 10.1111/j.0956-7976.2004.00760.x. [DOI] [PubMed] [Google Scholar]
- Delgado MR, Frank RH, Phelps EA. Perceptions of moral character modulate the neural systems of reward during the trust game. Nat Neurosci. 2005;8:1611–1618. doi: 10.1038/nn1575. [DOI] [PubMed] [Google Scholar]
- Diener E, Emmons RA, Larsen RJ, Griffin S. The satisfaction with life scale. J Pers Assess. 1985;49:71–75. doi: 10.1207/s15327752jpa4901_13. [DOI] [PubMed] [Google Scholar]
- Dunbar RIM, Spoors M. Social networks, support cliques, and kinship. Hum Nat. 1995;6:273–290. doi: 10.1007/BF02734142. [DOI] [PubMed] [Google Scholar]
- Duncan S, Barrett LF. The role of the amygdala in visual awareness. Trends Cogn Sci. 2007;11:190–192. doi: 10.1016/j.tics.2007.01.007. [DOI] [PMC free article] [PubMed] [Google Scholar]
- Eisenberger NI, Lieberman MD, Williams KD. Does rejection hurt? An FMRI study of social exclusion. Science. 2003;302:290–292. doi: 10.1126/science.1089134. [DOI] [PubMed] [Google Scholar]
- Entis JJ, Doerga P, Barrett LF, Dickerson BC. A reliable protocol for the manual segmentation of the human amygdala and its subregions using ultra-high resolution MRI. Neuroimage. 2012;60:1226–1235. doi: 10.1016/j.neuroimage.2011.12.073. [DOI] [PMC free article] [PubMed] [Google Scholar]
- Ferry AT, Ongür D, An X, Price JL. Prefrontal cortical projections to the striatum in macaque monkeys: evidence for an organization related to prefrontal networks. J Comp Neurol. 2000;425:447–470. doi: 10.1002/1096-9861(20000925)425:3<447::aid-cne9>3.0.co;2-v. [DOI] [PubMed] [Google Scholar]
- Fischl B, Salat DH, Busa E, Albert M, Dieterich M, Haselgrove C, van der Kouwe A, Killiany R, Kennedy D, Klaveness S, Montillo A, Makris N, Rosen B, Dale AM. Whole brain segmentation: automated labeling of neuroanatomical structures in the human brain. Neuron. 2002;33:341–355. doi: 10.1016/s0896-6273(02)00569-x. [DOI] [PubMed] [Google Scholar]
- Fox MD, Raichle ME. Spontaneous fluctuations in brain activity observed with functional magnetic resonance imaging. Nat Rev Neurosci. 2007;8:700–711. doi: 10.1038/nrn2201. [DOI] [PubMed] [Google Scholar]
- Fox MD, Snyder AZ, Vincent JL, Raichle ME. Intrinsic fluctuations within cortical systems account for intertrial variability in human behavior. Neuron. 2007;56:171–184. doi: 10.1016/j.neuron.2007.08.023. [DOI] [PubMed] [Google Scholar]
- Fudge JL, Kunishio K, Walsh P, Richard C, Haber SN. Amygdaloid projections to ventromedial striatal subterritories in the primate. Neuroscience. 2002;110:257–275. doi: 10.1016/s0306-4522(01)00546-2. [DOI] [PubMed] [Google Scholar]
- George N, Driver J, Dolan RJ. Seen gaze-direction modulates fusiform activity and its coupling with other brain areas during face processing. Neuroimage. 2001;13:1102–1112. doi: 10.1006/nimg.2001.0769. [DOI] [PubMed] [Google Scholar]
- Ghashghaei HT, Barbas H. Pathways for emotion: interactions of prefrontal and anterior temporal pathways in the amygdala of the rhesus monkey. Neuroscience. 2002;115:1261–1279. doi: 10.1016/s0306-4522(02)00446-3. [DOI] [PubMed] [Google Scholar]
- Gobbini MI, Haxby JV. Neural response to the visual familiarity of faces. Brain Res Bull. 2006;71:76–82. doi: 10.1016/j.brainresbull.2006.08.003. [DOI] [PubMed] [Google Scholar]
- Haber SN, Calzavara R. The cortico-basal ganglia integrative network: the role of the thalamus. Brain Res Bull. 2009;78:69–74. doi: 10.1016/j.brainresbull.2008.09.013. [DOI] [PMC free article] [PubMed] [Google Scholar]
- Haber SN, Knutson B. The reward circuit: linking primate anatomy and human imaging. Neuropsychopharmacology. 2010;35:4–26. doi: 10.1038/npp.2009.129. [DOI] [PMC free article] [PubMed] [Google Scholar]
- Haber SN, Kim KS, Mailly P, Calzavara R. Reward-related cortical inputs define a large striatal region in primates that interface with associative cortical connections, providing a substrate for incentive-based learning. J Neurosci. 2006;26:8368–8376. doi: 10.1523/JNEUROSCI.0271-06.2006. [DOI] [PMC free article] [PubMed] [Google Scholar]
- Harbaugh WT, Mayr U, Burghart DR. Neural responses to taxation and voluntary giving reveal motives for charitable donations. Science. 2007;316:1622–1625. doi: 10.1126/science.1140738. [DOI] [PubMed] [Google Scholar]
- Hart AJ, Whalen PJ, Shin LM, McInerney SC, Fischer H, Rauch SL. Differential response in the human amygdala to racial outgroup vs ingroup face stimuli. Neuroreport. 2000;11:2351–2355. doi: 10.1097/00001756-200008030-00004. [DOI] [PubMed] [Google Scholar]
- Hawkley LC, Cacioppo JT. Loneliness matters: a theoretical and empirical review of consequences and mechanisms. Ann Behav Med. 2010;40:218–227. doi: 10.1007/s12160-010-9210-8. [DOI] [PMC free article] [PubMed] [Google Scholar]
- Hill RA, Dunbar RIM. Social network size in humans. Hum Nat. 2003;14:53–72. doi: 10.1007/s12110-003-1016-y. [DOI] [PubMed] [Google Scholar]
- Höistad M, Barbas H. Sequence of information processing for emotions through pathways linking temporal and insular cortices with the amygdala. Neuroimage. 2008;40:1016–1033. doi: 10.1016/j.neuroimage.2007.12.043. [DOI] [PMC free article] [PubMed] [Google Scholar]
- Hsu DT, Price JL. Midline and intralaminar thalamic connections with the orbital and medial prefrontal networks in macaque monkeys. J Comp Neurol. 2007;504:89–111. doi: 10.1002/cne.21440. [DOI] [PubMed] [Google Scholar]
- Izuma K, Saito DN, Sadato N. Processing of the incentive for social approval in the ventral striatum during charitable donation. J Cogn Neurosci. 2010;22:621–631. doi: 10.1162/jocn.2009.21228. [DOI] [PubMed] [Google Scholar]
- Jovicich J, Czanner S, Han X, Salat D, van der Kouwe A, Quinn B, Pacheco J, Albert M, Killiany R, Blacker D, Maguire P, Rosas D, Makris N, Gollub R, Dale A, Dickerson BC, Fischl B. MRI-derived measurements of human subcortical, ventricular and intracranial brain volumes: Reliability effects of scan sessions, acquisition sequences, data analyses, scanner upgrade, scanner vendors and field strengths. Neuroimage. 2009;46:177–192. doi: 10.1016/j.neuroimage.2009.02.010. [DOI] [PMC free article] [PubMed] [Google Scholar]
- Kanai R, Bahrami B, Roylance R, Rees G. Online social network size is reflected in human brain structure. Proc Biol Sci. 2012;279:1327–1334. doi: 10.1098/rspb.2011.1959. [DOI] [PMC free article] [PubMed] [Google Scholar]
- Kim MJ, Gee DG, Loucks RA, Davis FC, Whalen PJ. Anxiety dissociates dorsal and ventral medial prefrontal cortex functional connectivity with the amygdala at rest. Cereb Cortex. 2011;21:1667–16673. doi: 10.1093/cercor/bhq237. [DOI] [PMC free article] [PubMed] [Google Scholar]
- Kondo H, Saleem KS, Price JL. Differential connections of the temporal pole with the orbital and medial prefrontal networks in macaque monkeys. J Comp Neurol. 2003;465:499–523. doi: 10.1002/cne.10842. [DOI] [PubMed] [Google Scholar]
- Kondo H, Saleem KS, Price JL. Differential connections of the perirhinal and parahippocampal cortex with the orbital and medial prefrontal networks in macaque monkeys. J Comp Neurol. 2005;493:479–509. doi: 10.1002/cne.20796. [DOI] [PubMed] [Google Scholar]
- Kross E, Berman MG, Mischel W, Smith EE, Wager TD. Social rejection shares somatosensory representations with physical pain. Proc Natl Acad Sci U S A. 2011;108:6270–6275. doi: 10.1073/pnas.1102693108. [DOI] [PMC free article] [PubMed] [Google Scholar]
- Kunishio K, Haber SN. Primate cingulostriatal projection: limbic striatal versus sensorimotor striatal input. J Comp Neurol. 1994;350:337–356. doi: 10.1002/cne.903500302. [DOI] [PubMed] [Google Scholar]
- Lewis PA, Rezaie R, Brown R, Roberts N, Dunbar RI. Ventromedial prefrontal volume predicts understanding of others and social network size. Neuroimage. 2011;57:1624–1629. doi: 10.1016/j.neuroimage.2011.05.030. [DOI] [PMC free article] [PubMed] [Google Scholar]
- Li J, Xiao E, Houser D, Montague PR. Neural responses to sanction threats in two-party economic exchange. Proc Natl Acad Sci U S A. 2009;106:16835–16840. doi: 10.1073/pnas.0908855106. [DOI] [PMC free article] [PubMed] [Google Scholar]
- Lieberman MD. Social cognitive neuroscience: a review of core processes. Annu Rev Psychol. 2007;58:259–289. doi: 10.1146/annurev.psych.58.110405.085654. [DOI] [PubMed] [Google Scholar]
- Lim SL, Padmala S, Pessoa L. Segregating the significant from the mundane on a moment-to-moment basis via direct and indirect amygdala contributions. Proc Natl Acad Sci U S A. 2009;106:16841–16846. doi: 10.1073/pnas.0904551106. [DOI] [PMC free article] [PubMed] [Google Scholar]
- McDonald AJ. Organization of amygdaloid projections to the mediodorsal thalamus and prefrontal cortex: a fluorescence retrograde transport study in the rat. J Comp Neurol. 1987;262:46–58. doi: 10.1002/cne.902620105. [DOI] [PubMed] [Google Scholar]
- McDonald AJ. Organization of amygdaloid projections to the prefrontal cortex and associated striatum in the rat. Neuroscience. 1991a;44:1–14. doi: 10.1016/0306-4522(91)90247-l. [DOI] [PubMed] [Google Scholar]
- McDonald AJ. Topographical organization of amygdaloid projections to the caudatoputamen, nucleus accumbens, and related striatal-like areas of the rat brain. Neuroscience. 1991b;44:15–33. doi: 10.1016/0306-4522(91)90248-m. [DOI] [PubMed] [Google Scholar]
- Moll J, Zahn R, de Oliveira-Souza R, Krueger F, Grafman J. Opinion: the neural basis of human moral cognition. Nat Rev Neurosci. 2005;6:799–809. doi: 10.1038/nrn1768. [DOI] [PubMed] [Google Scholar]
- Moll J, Krueger F, Zahn R, Pardini M, de Oliveira-Souza R, Grafman J. Human fronto-mesolimbic networks guide decisions about charitable donation. Proc Natl Acad Sci U S A. 2006;103:15623–15628. doi: 10.1073/pnas.0604475103. [DOI] [PMC free article] [PubMed] [Google Scholar]
- Moll J, de Oliveira-Souza R, Garrido GJ, Bramati IE, Caparelli-Daquer EM, Paiva ML, Zahn R, Grafman J. The self as a moral agent: linking the neural bases of social agency and moral sensitivity. Soc Neurosci. 2007;2:336–352. doi: 10.1080/17470910701392024. [DOI] [PubMed] [Google Scholar]
- Morris JS, Frith CD, Perrett DI, Rowland D, Young AW, Calder AJ, Dolan RJ. A differential neural response in the human amygdala to fearful and happy facial expressions. Nature. 1996;383:812–815. doi: 10.1038/383812a0. [DOI] [PubMed] [Google Scholar]
- Mufson EJ, Mesulam MM, Pandya DN. Insular interconnections with the amygdala in the rhesus monkey. Neuroscience. 1981;6:1231–1248. doi: 10.1016/0306-4522(81)90184-6. [DOI] [PubMed] [Google Scholar]
- Ongür D, Price JL. The organization of networks within the orbital and medial prefrontal cortex of rats, monkeys and humans. Cereb Cortex. 2000;10:206–219. doi: 10.1093/cercor/10.3.206. [DOI] [PubMed] [Google Scholar]
- Ongür D, An X, Price JL. Prefrontal cortical projections to the hypothalamus in macaque monkeys. J Comp Neurol. 1998;401:480–505. [PubMed] [Google Scholar]
- Ongür D, Ferry AT, Price JL. Architectonic subdivision of the human orbital and medial prefrontal cortex. J Comp Neurol. 2003;460:425–449. doi: 10.1002/cne.10609. [DOI] [PubMed] [Google Scholar]
- Padmala S, Pessoa L. Affective learning enhances visual detection and responses in primary visual cortex. J Neurosci. 2008;28:6202–6210. doi: 10.1523/JNEUROSCI.1233-08.2008. [DOI] [PMC free article] [PubMed] [Google Scholar]
- Pessoa L. Reprint of: emotion and cognition and the amygdala: from “what is it?” to “what's to be done?”. Neuropsychologia. 2011;49:681–694. doi: 10.1016/j.neuropsychologia.2011.02.030. [DOI] [PMC free article] [PubMed] [Google Scholar]
- Phelps EA, O'Connor KJ, Cunningham WA, Funayama ES, Gatenby JC, Gore JC, Banaji MR. Performance on indirect measures of race evaluation predicts amygdala activation. J Cogn Neurosci. 2000;12:729–738. doi: 10.1162/089892900562552. [DOI] [PubMed] [Google Scholar]
- Phillips ML, Young AW, Senior C, Brammer M, Andrew C, Calder AJ, Bullmore ET, Perrett DI, Rowland D, Williams SC, Gray JA, David AS. A specific neural substrate for perceiving facial expressions of disgust. Nature. 1997;389:495–498. doi: 10.1038/39051. [DOI] [PubMed] [Google Scholar]
- Powell J, Lewis PA, Roberts N, García-Fiñana M, Dunbar RI. Orbital prefrontal cortex volume predicts social network size: an imaging study of individual differences in humans. Proc Biol Sci. 2012;279:2157–2162. doi: 10.1098/rspb.2011.2574. [DOI] [PMC free article] [PubMed] [Google Scholar]
- Price JL. Definition of the orbital cortex in relation to specific connections with limbic and visceral structures and other cortical regions. Ann N Y Acad Sci. 2007;1121:54–71. doi: 10.1196/annals.1401.008. [DOI] [PubMed] [Google Scholar]
- Price JL, Drevets WC. Neurocircuitry of mood disorders. Neuropsychopharmacology. 2010;35:192–216. doi: 10.1038/npp.2009.104. [DOI] [PMC free article] [PubMed] [Google Scholar]
- Richeson JA, Todd AR, Trawalter S, Baird AA. Eye-gaze direction modulates race-related amygdala activity. Group Proc Intergroup Relations. 2008;11:233–246. [Google Scholar]
- Rilling JK, Sanfey AG. The neuroscience of social decision-making. Annu Rev Psychol. 2011;62:23–48. doi: 10.1146/annurev.psych.121208.131647. [DOI] [PubMed] [Google Scholar]
- Rilling JK, Sanfey AG, Aronson JA, Nystrom LE, Cohen JD. Opposing BOLD responses to reciprocated and unreciprocated altruism in putative reward pathways. Neuroreport. 2004;15:2539–2543. doi: 10.1097/00001756-200411150-00022. [DOI] [PubMed] [Google Scholar]
- Rilling JK, Goldsmith DR, Glenn AL, Jairam MR, Elfenbein HA, Dagenais JE, Murdock CD, Pagnoni G. The neural correlates of the affective response to unreciprocated cooperation. Neuropsychologia. 2008;46:1256–1266. doi: 10.1016/j.neuropsychologia.2007.11.033. [DOI] [PubMed] [Google Scholar]
- Rilling JK, Scholz J, Preuss TM, Glasser MF, Errangi BK, Behrens TE. Differences between chimpanzees and bonobos in neural systems supporting social cognition. Soc Cogn Affect Neurosci. 2012;7:369–379. doi: 10.1093/scan/nsr017. [DOI] [PMC free article] [PubMed] [Google Scholar]
- Roy AK, Shehzad Z, Margulies DS, Kelly AM, Uddin LQ, Gotimer K, Biswal BB, Castellanos FX, Milham MP. Functional connectivity of the human amygdala using resting state fMRI. Neuroimage. 2009;45:614–626. doi: 10.1016/j.neuroimage.2008.11.030. [DOI] [PMC free article] [PubMed] [Google Scholar]
- Russell D, Cutrona CE, Rose J, Yurko K. Social and emotional loneliness: an examination of Weiss's typology of loneliness. J Pers Soc Psychol. 1984;46:1313–1321. doi: 10.1037//0022-3514.46.6.1313. [DOI] [PubMed] [Google Scholar]
- Saleem KS, Kondo H, Price JL. Complementary circuits connecting the orbital and medial prefrontal networks with the temporal, insular, and opercular cortex in the macaque monkey. J Comp Neurol. 2008;506:659–693. doi: 10.1002/cne.21577. [DOI] [PubMed] [Google Scholar]
- Sallet J, Mars RB, Noonan MP, Andersson JL, O'Reilly JX, Jbabdi S, Croxson PL, Jenkinson M, Miller KL, Rushworth MF. Social network size affects neural circuits in macaques. Science. 2011;334:697–700. doi: 10.1126/science.1210027. [DOI] [PubMed] [Google Scholar]
- Sanfey AG, Rilling JK, Aronson JA, Nystrom LE, Cohen JD. The neural basis of economic decision-making in the Ultimatum Game. Science. 2003;300:1755–1758. doi: 10.1126/science.1082976. [DOI] [PubMed] [Google Scholar]
- Saygin ZM, Osher DE, Augustinack J, Fischl B, Gabrieli JD. Connectivity-based segmentation of human amygdala nuclei using probabilistic tractography. Neuroimage. 2011;56:1353–1361. doi: 10.1016/j.neuroimage.2011.03.006. [DOI] [PMC free article] [PubMed] [Google Scholar]
- Seeley WW, Menon V, Schatzberg AF, Keller J, Glover GH, Kenna H, Reiss AL, Greicius MD. Dissociable intrinsic connectivity networks for salience processing and executive control. J Neurosci. 2007;27:2349–2356. doi: 10.1523/JNEUROSCI.5587-06.2007. [DOI] [PMC free article] [PubMed] [Google Scholar]
- Stefanacci L, Amaral DG. Some observations on cortical inputs to the macaque monkey amygdala: an anterograde tracing study. J Comp Neurol. 2002;451:301–323. doi: 10.1002/cne.10339. [DOI] [PubMed] [Google Scholar]
- Tabibnia G, Satpute AB, Lieberman MD. The sunny side of fairness: preference for fairness activates reward circuitry (and disregarding unfairness activates self-control circuitry) Psychol Sci. 2008;19:339–347. doi: 10.1111/j.1467-9280.2008.02091.x. [DOI] [PubMed] [Google Scholar]
- Totterdell P, Holman D, Hukin A. Social networkers: measuring and examining individual differences in propensity to connect with others. Social Networks. 2008;30:283–296. [Google Scholar]
- Touroutoglou A, Hollenbeck M, Dickerson BC, Feldman Barrett L. Dissociable large-scale networks anchored in the right anterior insula subserve affective experience and attention. Neuroimage. 2012;60:1947–1958. doi: 10.1016/j.neuroimage.2012.02.012. [DOI] [PMC free article] [PubMed] [Google Scholar]
- van Marle HJ, Hermans EJ, Qin S, Fernández G. Enhanced resting-state connectivity of amygdala in the immediate aftermath of acute psychological stress. Neuroimage. 2010;53:348–354. doi: 10.1016/j.neuroimage.2010.05.070. [DOI] [PubMed] [Google Scholar]
- Van Overwalle F, Baetens K. Understanding others' actions and goals by mirror and mentalizing systems: a meta-analysis. Neuroimage. 2009;48:564–584. doi: 10.1016/j.neuroimage.2009.06.009. [DOI] [PubMed] [Google Scholar]
- Vincent JL, Snyder AZ, Fox MD, Shannon BJ, Andrews JR, Raichle ME, Buckner RL. Coherent spontaneous activity identifies a hippocampal-parietal memory network. J Neurophysiol. 2006;96:3517–3531. doi: 10.1152/jn.00048.2006. [DOI] [PubMed] [Google Scholar]
- Vincent JL, Patel GH, Fox MD, Snyder AZ, Baker JT, Van Essen DC, Zempel JM, Snyder LH, Corbetta M, Raichle ME. Intrinsic functional architecture in the anaesthetized monkey brain. Nature. 2007;447:83–86. doi: 10.1038/nature05758. [DOI] [PubMed] [Google Scholar]
- Vincent JL, Kahn I, Snyder AZ, Raichle ME, Buckner RL. Evidence for a frontoparietal control system revealed by intrinsic functional connectivity. J Neurophysiol. 2008;100:3328–3342. doi: 10.1152/jn.90355.2008. [DOI] [PMC free article] [PubMed] [Google Scholar]
- Vuilleumier P, Richardson MP, Armony JL, Driver J, Dolan RJ. Distant influences of amygdala lesion on visual cortical activation during emotional face processing. Nat Neurosci. 2004;7:1271–1278. doi: 10.1038/nn1341. [DOI] [PubMed] [Google Scholar]
- Wang L, Negreira A, LaViolette P, Bakkour A, Sperling RA, Dickerson BC. Intrinsic interhemispheric hippocampal functional connectivity predicts individual differences in memory performance ability. Hippocampus. 2010;20:345–351. doi: 10.1002/hipo.20771. [DOI] [PMC free article] [PubMed] [Google Scholar]
- Winston JS, Strange BA, O'Doherty J, Dolan RJ. Automatic and intentional brain responses during evaluation of trustworthiness of faces. Nat Neurosci. 2002;5:277–283. doi: 10.1038/nn816. [DOI] [PubMed] [Google Scholar]
- Wright CI, Williams D, Feczko E, Barrett LF, Dickerson BC, Schwartz CE, Wedig MM. Neuroanatomical correlates of extraversion and neuroticism. Cereb Cortex. 2006;16:1809–1819. doi: 10.1093/cercor/bhj118. [DOI] [PubMed] [Google Scholar]
- Yeo BT, Krienen FM, Sepulcre J, Sabuncu MR, Lashkari D, Hollinshead M, Roffman JL, Smoller JW, Zöllei L, Polimeni JR, Fischl B, Liu H, Buckner RL. The organization of the human cerebral cortex estimated by intrinsic functional connectivity. J Neurophysiol. 2011;106:1125–1165. doi: 10.1152/jn.00338.2011. [DOI] [PMC free article] [PubMed] [Google Scholar]
- Zahn R, Moll J, Paiva M, Garrido G, Krueger F, Huey ED, Grafman J. The neural basis of human social values: evidence from functional MRI. Cereb Cortex. 2009;19:276–283. doi: 10.1093/cercor/bhn080. [DOI] [PMC free article] [PubMed] [Google Scholar]