Summary
In China, the majority of human immunodeficiency virus (HIV) infections are predominately subtype B. It is important to characterize the HIV-1 subtype B-specific and its T cell response within the Chinese population, with the aim of identifying protective correlates of immunity to control HIV-1 infections. In this study, we performed a comprehensive analysis looking into the magnitude/strength of T cell responses directed at the Gag protein of the HIV-1 subtype B, one of the most conserved HIV-1 proteins. The study group consisted of anti-retroviral native and chronic HIV-1 subtype B-infected individuals. We used enzyme-linked immunospot (ELISPOT) assay to quantify the total T cell responses to HIV-1 Gag at the single peptide level. Twenty-eight (38%) peptides were recognized in 24 (82·8%) individuals. The p24 was identified as the most frequently recognized subunit protein with the greatest T cell response in the test, which correlated positively with CD4+ T cell count and inversely with viral load (VL). At the level of the human leucocyte antigen (HLA) supertypes, we detected the highest levels and a significant correlation with both the CD4+ T cell count and the VL with Gag T cell responses in Bw4/Bw4. These findings demonstrate that (i) the HIV-1B Gag p24-specific immune responses play an important role in controlling viral replication and slowing clinical progression; and (ii) HLA-Bw4/Bw4 allele has stronger T cell responses, which is associated with slow clinical progression in Chinese HIV patients.
Keywords: Gag, HIV-1-specific, HLA, T cells
Introduction
Human immunodeficiency virus (HIV) viral load (VL) and CD4+ T cell count are the key markers of disease progression. The relationship between HIV-induced immune responses and virological control remains contentious. Inverse correlations between HIV-specific T cell responses and concurrent plasma VL have been demonstrated by some researchers [1–4], but could not be confirmed by others [5–9]. Furthermore, some studies reported discordant correlations between T cell responses and VL (count/response), and those numbers demonstrated these relationships to be determined by the infecting clade, targeting of the subdominant epitopes [10], region of HIV targeted [4,11,12] and how far the disease has developed [13]. HIV-1 subtype B (HIV-1B) is the most prevalent HIV-1 subtype both in China and globally. The emergent ascendancy of HIV-1B indicates a need for a comprehensive analysis of HIV-1B-specific immune responses, dealing with both CD4 and CD8, in the context of a vaccine design. The introduction of major human leucocyte antigen (HLA) class I supertypes that grouped the major histocompatibility complex (MHC) class I alleles, on the basis of their functional properties, allowed us to address associations between T cell responses and plasma VL within the HLA supertypes [14]. We focused on the Gag protein because it was the more highly conserved region of HIV-1.
Recently, the first successful Phase III HIV vaccine trial was reported from Thailand [15], although its efficacy was marginal. For the development of a more effective vaccine, it is crucial to understand accurately the influence of sequence variation among HIV subtypes and HLA diversity among ethnic groups. In this study we aimed to provide more information about T cell epitopes in HIV-B infections; we addressed the associations between the virus-specific T cell immune responses and plasma VL, CD4+ T cell count and the HLA supertype in the course of a natural HIV-1B infection in Chinese citizens and evaluated the possible ways in improving the HIV-1B Gag p24-specific immune responses during the progression of HIV.
Materials and methods
Study population
This study was approved specifically by Beijing YouAn Hospital Ethics Committee and was conducted according to the set guidelines for research. Written informed consent was obtained after explaining the purpose and expected consequences of the study. Twenty-nine HIV-1B-infected individuals were enrolled into an ongoing study concerning clinical progression of HIV infection in patients at the Beijing YouAn Hospital (Beijing, China). The study groups consisted of chronically infected individuals with confirmed serodiagnosis of HIV and reported as having no prior history of anti-retroviral therapy. Diagnosis of the HIV-1 infection was made using the solid-phase method with enzyme linked immunosorbent assay (ELISA) kits, which were provided by the National AIDS Control Organization, located in China, and infections were confirmed further by Western blot (WB) test. The characteristics of the subjects in our study are detailed in Table 1. Blood samples were obtained after written informed consent during scheduled visits. As health controls, we also included into our study 20 individuals who were tested as being seronegative for both HIV-1/2 and for hepatitis B and C. Along with the above-mentioned group, individuals who were screened for acute illnesses and infections requiring treatment were also included into our study, although pregnant females and patients with blood dyscrasias were excluded.
Table 1.
Characteristics of the study patient cohort.
| Patient no. | Laboratory ID | Age | Sex | First positive Test time | Route of transmit | CD4+ T cell count | VL (log) | HLA typing | |||||
|---|---|---|---|---|---|---|---|---|---|---|---|---|---|
| A1 | A2 | B1 | B2 | BW1 | BW2 | ||||||||
| 1 | C107 | 25 | Male | 2006 | Sex | 573 | 2·9 | A*02 | A*31 | B*15 | B*15 | BW6 | BW6 |
| 2 | C108 | 28 | Male | 2004 | Sex | 429 | 4·2 | A*02 | A*33 | B*58 | B*46 | BW4 | BW6 |
| 3 | C109 | 35 | Male | 2004 | Sex | 280 | 5·0 | A*02 | A*31 | B*40 | B*46 | BW6 | BW6 |
| 4 | C116 | 39 | Male | 2003 | Sex | 159 | 3·3 | A*02 | A*24 | B*40 | B*51 | BW4 | BW6 |
| 5 | C131 | 33 | Male | 2003 | Sex | 358 | 4·7 | A*03 | A*31 | B*51 | B*51 | BW4 | BW4 |
| 6 | C152 | 27 | Male | 2006 | Sex | 328 | 4·5 | A*02 | A*30 | B*13 | B*15 | BW4 | BW6 |
| 7 | C155 | 27 | Male | 2004 | Sex | 523 | 4·5 | A*01 | A*02 | B*57 | B*39 | BW4 | BW6 |
| 8 | C168 | 30 | Male | 2003 | Sex | 306 | 2·8 | A*02 | A*11 | B*40 | B*51 | BW4 | BW6 |
| 9 | C17 | 32 | Male | 2003 | Sex | 679 | 4·1 | A*02 | A*26 | B*08 | B*40 | BW4 | BW4 |
| 10 | C187 | 39 | Female | 2005 | Blood | 470 | 3·2 | A*03 | A*24 | B*07 | B*15 | BW6 | BW6 |
| 11 | C199 | 27 | Male | 2007 | Sex | 250 | 4·6 | A*24 | A*24 | B*40 | B*15 | BW6 | BW6 |
| 12 | C206 | 27 | Male | 2006 | Sex | 224 | 4·8 | A*02 | A*11 | B*40 | B*15 | BW6 | BW6 |
| 13 | C226 | 50 | Male | 1998 | Sex | 467 | 4·5 | A*02 | A*02 | B*48 | B*52 | BW4 | BW6 |
| 14 | C236 | 28 | Male | 2001 | Sex | 358 | 3·7 | A*02 | A*11 | B*46 | B*51 | BW4 | BW6 |
| 15 | C238 | 27 | Male | 2005 | Sex | 359 | 3·7 | A*11 | A*11 | B*07 | B*52 | BW4 | BW6 |
| 16 | C246 | 22 | Male | 2006 | Sex | 449 | 3·0 | A*02 | A*24 | B*40 | B*38 | BW4 | BW6 |
| 17 | C284 | 24 | Male | 2005 | Sex | 406 | 4·3 | A*02 | A*11 | B*39 | B*15 | BW6 | BW6 |
| 18 | C30 | 49 | Male | 2002 | Sex | 350 | 4·5 | A*02 | A*02 | B*13 | B*15 | BW4 | BW4 |
| 19 | C309 | 31 | Male | 2005 | Sex | 357 | 6·0 | A*02 | A*02 | B*40 | B*51 | BW4 | BW4 |
| 20 | C310 | 29 | Male | 2008 | Sex | 190 | 4·4 | A*33 | A*33 | B*44 | B*58 | BW4 | BW6 |
| 21 | C323 | 25 | Male | 2005 | Sex | 255 | 4·9 | A*02 | A*11 | B*07 | B*52 | BW6 | BW6 |
| 22 | C331 | 27 | Male | 2007 | Sex | 256 | 2·7 | A*02 | A*02 | B*46 | B*15 | BW6 | BW6 |
| 23 | C341 | 36 | Male | 2007 | Sex | 342 | 6·0 | A*03 | A*30 | B*13 | B*15 | BW4 | BW6 |
| 24 | C342 | 30 | Male | 2005 | Sex | 340 | 4·9 | A*03 | A*30 | B*07 | B*52 | BW4 | BW4 |
| 25 | C356 | 22 | Male | 2006 | Sex | 335 | 2·4 | A*02 | A*24 | B*27 | B*46 | BW4 | BW6 |
| 26 | C359 | 31 | Male | 2007 | Sex | 569 | 2·5 | A*02 | A*24 | B*07 | B*52 | BW4 | BW6 |
| 27 | C375 | 25 | Male | 2005 | Sex | 276 | 4·2 | A*02 | A*29 | B*40 | B*35 | BW6 | BW6 |
| 28 | C393 | 29 | Male | 2004 | Sex | 271 | 3·4 | A*02 | A*29 | B*39 | B*15 | BW6 | BW6 |
| 29 | C394 | 26 | Male | 2007 | Sex | 543 | 4·2 | A*02 | A*24 | B*40 | B*15 | BW6 | BW6 |
HLA: human leucocyte antigen.
HLA typing
Genomic DNA was extracted from the patient's peripheral blood mononuclear cells (PBMCs) with the QIAamp DNA Mini Kit (Qiagen, Hilden, Germany). HLA tissue typing was performed initially at low/medium resolution, using the polymerase chain reaction-sequence specific primers (PCR-SSP) method adapted from Bunce [16]. High-resolution HLA class I typing was performed by PCR, using reference strand conformational analysis (RSCA), as described previously [17].
PBMC isolation
Fresh blood was obtained by phlebotomy. PBMCs were then isolated from ethylenediamine tetraacetic acid (EDTA), treated and heparinized; the sample blood was then placed onto a Ficoll-Hypaque density gradient (Sigma, St Louis, MO, USA) and finally cryopreserved [90% fetal calf serum (FCS), 10% dimethylsulphoxide (DMSO)] at −196°C until needed for testing.
Plasma viral load, CD4+ T cell counts
The HIV-1 RNA plasma viral load and CD4+ counts were quantified using the HIV-1 RNA 3·0 bDNA assay (Bayer, Leverkusen, Germany) and fluorescence activating cell sorter (FACS) count (Becton Dickinson, San Jose, CA, USA), respectively, according to the manufacturer's instructions. The threshold for RNA detection was at 50 copies/ml. In our study all plasma viral loads are presented as log10 transformed data.
Synthetic HIV-1 Gag overlapping peptides (OLPs)
HIV peptides were obtained through the National Institute of Health, AIDS Research and Reference Reagent programme (https://www.aidsreagent.org/). Peptides were synthesized by Sigma and by the Medical Research Council Human Immunology Unit (WIMM, Oxford, UK); 18-mer peptides overlapping by 10 nucleotides and representing the consensus clade B proteome were pooled into the Gag protein, as described previously [18–20].
Interferon (IFN)-γ enzyme-linked immunospot (ELISPOT) assay
The lyophilized peptides were dissolved in DMSO (Sigma) and then in RPMI-1640 medium at a concentration of 1 mg/ml. The single peptide was pooled and the final concentration of each peptide was measured at 4 μg/ml. The PBMCs, stored at −180°C, were thawed and cultured at 37°C for 18 h in RPMI-1640 medium (Hyclone, Logan, UT, USA) with 10% FCS (Hyclone), 200 mmol/l L-glutamine (Sigma) and antibiotics (100 U penicillin and 100 mg/ml streptomycin; Lukang, Germany), the cultured cells (105) were then added to each well in a 96-well microtitre high-affinity plate (MAIPS4510; Millipore, Boston, MA, USA), precoated with an anti-interferon (IFN)-γ antibody (10 μg/ml; Mabtech, Nacka Strand, Sweden). The single peptide was added at a concentration of 4 μg/ml unstimulated; phytohaemagglutinin (PHA; Biostat, Germany)-stimulated cells served as negative (mock) and positive controls, respectively. The assay was performed in the same manner. The plate was incubated for 16 h at 37°C in 5% CO2. The IFN-γ producing cells were then made visual with a biotinylated anti-IFN-γ secondary antibody (Mabtech) and an enzyme–substrate complex, which included avidin-bounded biotinylated horseradish peroxidase (Bio-Rad, Hercules, CA, USA) and the chromogen substrate (Biorad). The deep-brown-coloured spots with decreasing density radiating from the centre were counted by the AT-Spot 3000 Elispot Analysis system (Antai Yongxin, Beijing, China). The assay was considered valid only if positive (PHA-stimulated) control wells showed 1100 spots/106 cells, and if the negative control wells showed 10 spots/106 cells. To determine the threshold background responses to HIV-1 peptides, PBMCs from 20 HIV-1-seronegative individuals were assessed by ELISPOT assay. The mean numbers of spots for HIV-1 Gag obtained from HIV-1-seronegative individuals were read at 3. The following two criteria were used to determine a positive response: (1) the mean number of spots against the respective antigen in HIV-1-seronegative subjects + 3 standard deviations (s.d.) was considered to be a cut-off point for a positive reading; and (2) peptide wells with > 10 spots more than the background (as opposed to the number of spots obtained in the negative control wells of the respective study subject) were considered positive. The results were expressed as spot-forming units (SFU)/106 cells.
Statistical analysis
Statistical analysis was performed using excel 2007 and spss. The number of individuals with positive responses to p17, p24 and p15 proteins was compared using Fisher's exact test. We then analysed the association between the breadth in terms of cell count and clinical outcome (CD4+ T cell count and VL) using the Mann–Whitney U-test and Spearman's correlation test measured between the magnitude of T cell response and clinical outcomes (CD4+ T cell count and VL). We also employed one-way analysis of variance (anova) of the differences in the various T cell responses among the MHC class I supertypes. The OLP recognition was confirmed by a single peptide ELISPOT experiment.
Results
Among 29 individuals, 24 (82·8%) were recognized to have at least one peptide present; the average cell count range was 874 SFU/106 cells (range 60–3905) (Fig. 1). Of 61 OLPs, 23 (37·7%) were recognized in at least one individual: five peptides located in p17 were targeted in 14% of the subjects; 14 peptides in p24 and four peptides in p15 were recognized in 48 and 17% of those who participated in the study; six OLPs were recognized in one subject and the other 17 OLPs were recognized in more than one of the volunteers. G5 (HIVWASRELERFAVNPGL) was the highest ratio sum of all the responses from the various individuals, with 3986 SFU/106 cells and peptide frequency at 17% in all the recognized peptides, which was located in P17. The other most frequently recognized peptides were located in p24: G33 (EIYKRWIILGLNKIVRMY), which was recognized in five individuals, G18 (GQMVHQAISPRTLNAWVK) in four individuals and G42 (TILKALGPAATLEEMMTA) in four others (Fig. 2).
Figure 1.
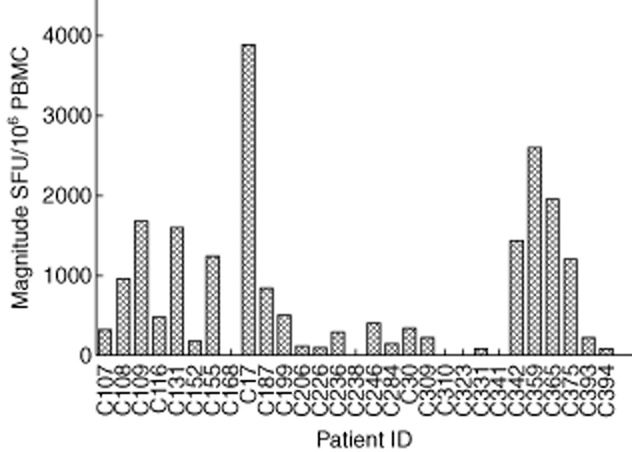
Magnitude of human immunodeficiency virus (HIV)-1 subtype B Gag-specific T cell responses in 29 HIV-1B-infected individuals. Measured as interferon (IFN)-γ enzyme-linked immunospot (ELISPOT), represented as spot-forming units (SFU)/106 peripheral blood mononuclear cells.
Figure 2.
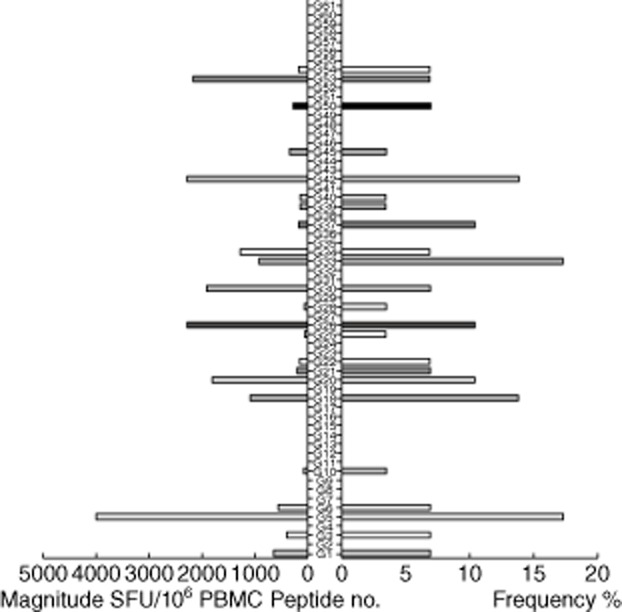
Magnitude and Frequency of 61 human immunodeficiency virus (HIV)-1 subtype B Gag overlapping peptides (OLPs). The total magnitude of T cell responses specific for each tested peptide is shown as bars in the left part of the graph. The frequency of each tested peptide is shown as bars on the right part of the graph. Significant differences were observed when comparing the magnitude and frequencies for different peptide sets.
When looking at the three subunits of Gag (P17, P24, P15), P24 was the most highly targeted protein region and its ratio was at 12 363 SFU/106 cells; average frequency per peptide was 4·2%. This was followed by p17 (sum magnitude 5799, frequency 2·9%). The one with the lowest magnitude was p15 (sum magnitude 2927, frequency 1·4%) (Fig. 3).
Figure 3.
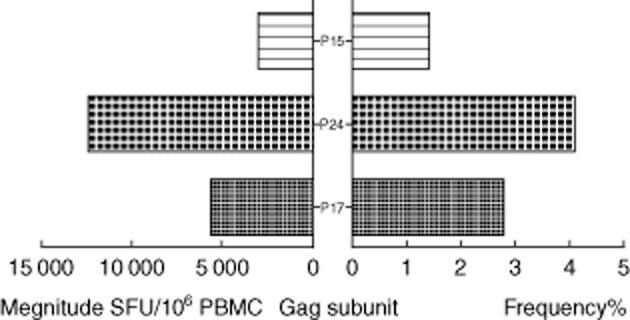
Total magnitude and average frequencies of the human immunodeficiency virus (HIV)-1B Gag subunit proteins (P17,P24,P15). The left histogram shows total magnitude per protein. The right histogram was average frequency per peptide per protein.
ELISPOT breadth, magnitude and clinical outcome
First, we examined the various correlations with the CD4+ T cell count and VL. The results showed that there were no significant correlations with the overall responses and the CD4+ T cell count; the same was found with the plasma VL (Fig. 4a). Interestingly, in a site-specific analysis, we found a significant association with CD4+ T cell count and VL only in p24. The CD4+ T cell's median count was significantly higher with regard to 402 cells/μl (range 270–573) than 297 cells/μl (range 159–406) among those with a greater breadth of responses, in individuals with two and one responses, respectively (P = 0·00018), but not in other sites (Fig. 4b, middle). The VL median was significantly higher in 4·91 log copies/ml (range 4·22–5·80) than 3·71 log copies/ml (range 2·36–4·93) individuals with a greater range of responses, in individuals with three and two responses, respectively (P = 0·0016), but not in other sites (Fig. 4c, middle).
Figure 4.
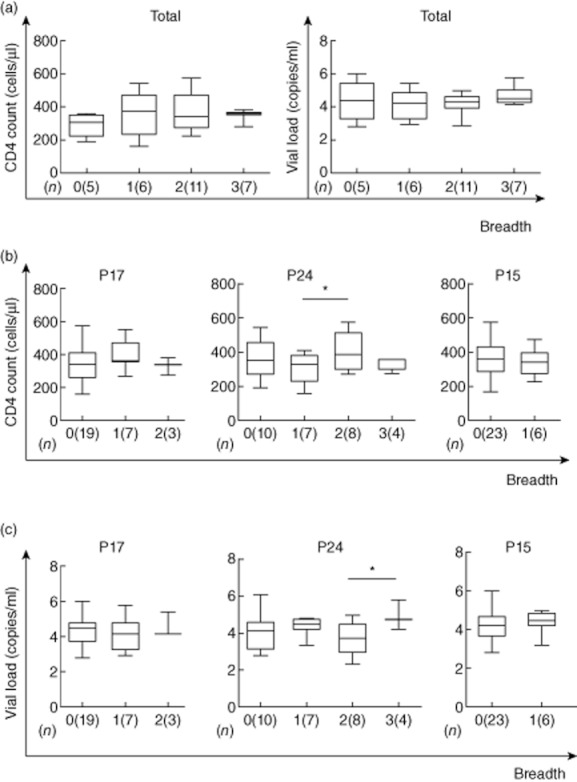
Enzyme-linked immunospot (ELISPOT) breadth is associated with CD4+ T cell count and viral load. The associations between ELISPOT breadth [the number of reacting overlapping peptides (OLPs)] and CD4+ T cell count or viral load were analysed using the Kruskal–Wallis test (a). The p17, p24 or p15 site-specific ELISPOT breadth was also compared with CD4+ T cell count (b) and viral load (c); (n) refers to the number of individuals; *significant difference of P < 0·05 (*) by Mann–Whitney U- test.
We next investigated the relationship between the various ranges of cell count and VL and clinical outcome. There were no significant correlations with the total magnitude of responses and the CD4+ T cell count and VL (R2 = 0·007, P = 0·656; R2 = 0·112, P = 0·076) (Fig. 5a). In a detailed site-specific analysis, the range of differences in cell count and VL in p24 had a significant correlation with clinical outcome, both in CD4+ T cell count (R2 = 0·229, P = 0·038) (Fig. 5b) and VL (R2 = 0·223, P = 0·041) (Fig. 5c), but not in other sites (samples).
Figure 5.
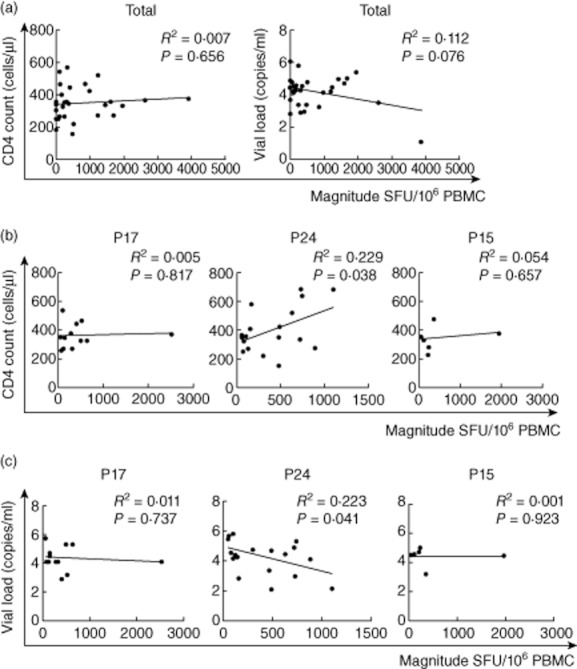
Enzyme-linked immunospot (ELISPOT)magnitude is associated with CD4+ T cell count and viral load. The associations between ELISPOT magnitude (total spot-forming units per 1·0 M peripheral blood mononuclear cells and CD4+ T cell count or viral load) were analysed by Spearman's correlation (a). The p17, p24 or p15 site-specific response was also compared with CD4+ T cell count (b) and viral load (c).
HLA supertypes and clinical outcome
Host genetic factors play an important role in mediating resistance to a HIV-1 infection and may modify the course of the virus infection. HLA-B alleles (Bw4 epitope; B*27 and B*57), as well as killer cell immunoglobulin-like receptors, have been associated with slow progression of HIV-1 infection. Based on this theory, the patients were classified as Bw4/Bw4, Bw6/Bw6 and Bw4/Bw6, three HLA supertypes, and the associations between HIV-1B-specific T cell responses and CD4+ T cell count and plasma VL were analysed. In a detailed HLA supertype analysis, numerical counts in Bw4/Bw4 had a significant correlation with clinical outcome both in CD4+ T cell count (R2 = 0·779, P = 0·048) (Fig. 6a) and VL (R2 = 0·797, P = 0·040) (Fig. 6b); no statistically significant association was observed between either CD4+ T cell count or plasma VL and responses with Bw4/Bw6 and Bw6Bw6 (Fig. 6a,b). Compared to the quantative T cell responses in Bw4/Bw4, Bw6/Bw6 and Bw4/Bw6, three HLA supertypes, the highest range of T cell responses was observed in Bw4/Bw4, significantly higher than Bw6/Bw6 (P < 0·05) and Bw4/Bw6 (P < 0·01) (Fig. 7).
Figure 6.
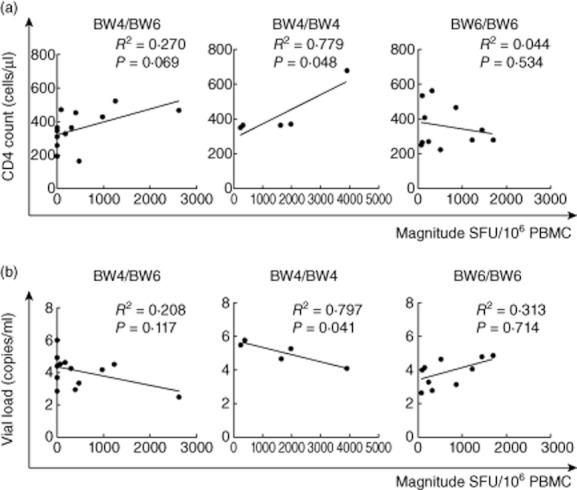
Bw4/Bw4, Bw6/Bw6 and Bw4/Bw6 allele-specific enzyme-linked immunospot (ELISPOT) magnitude were compared with CD4+ T cell count (a) and viral load (VL) (b). There was no association between magnitude and CD4+ T cell count or VL in Bw6/Bw6 and Bw4/Bw6; in contrast, there was a significant positive association between magnitude and CD4+ T cell count (a, middle) and significant negative association between magnitude and VL (b, middle) in Bw4/Bw4.
Figure 7.
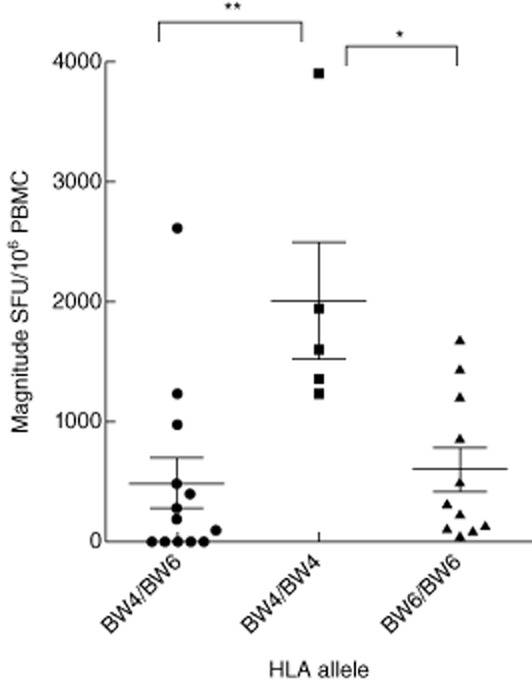
Relative magnitudes of human immunodeficiency virus (HIV) T cell responses to haemagglutination inhibition assay (HIA). The magnitude of T cell responses to Bw4 and Bw6 is shown. The greatest magnitude of T cell responses was in Bw4/Bw4, which was significantly higher than Bw6/Bw6 and Bw4/Bw6; * and **, significant difference of P=0·05(*) and P=0·01(**) by one-way analysis of variance analysis.
Discussion
In the past decade, the correlation between T cell responses and immune control of HIV-1 infection has been explored extensively, and some controversial results have been reported [21,25]. Some previous studies have shown an inverse correlation between the magnitude and frequency of HIV-specific CD8+ T cells and plasma VL [26,29], whereas such correlations were not observed in other studies [7,30,31]. In this study, our results showed that there were no statistically significant correlations between total quantitative range and breadth of T cell responses and plasma VL or CD4+ T cell count.
A recent study has demonstrated that the responses of T cells to different HIV proteins had discordant associations with plasma VL, which resulted in effective T cell responses without a demonstrable biological impact in patients with chronic HIV infection [32]. In this study, the data demonstrated that the relative quantitative magnitude of T cell responses targeting Gag-p24 correlated with CD4+ T cell count (> 350 cells/μl) and VL. The significance between these correlations has yet to be understood completely. In the present study, Gag p24 was the most recognized antigen among the study population, with 65% (35 of 54) responding to Gag P24. This was consistent with the findings of other studies with individuals infected with HIV-1 subtype B, irrespective of the nature of antigens used in the study [33]. The broader and stronger p24 responses observed in the present study supports the thesis of a dominant role of Gag-specific T cell epitopes in the natural course of HIV-1 subtype B infection among the Chinese citizens who were studied. The correlation between virus-specific immune responses and plasma VL in HIV-1B Gag, and particularly in Gag p24, suggests an important role of p24-specific T cell responses in the control of viraemia. The highly conserved p24 appears to have functional constraints and may not be flexible for accumulation of new mutations which, in turn, would allow control of the virus by a capable Gag p24-specific T cell response. These findings may lead researchers to look further into the relative importance of HIV proteins for vaccine design, and suggest that the Gag p24 might be the most plausible region to include in vaccine candidates for inducing T cell immune responses that could contain viraemia. Several papers have discussed the advantages of T cell immune pressure against p24 for viral control, which includes selection of escape mutations that lead to viral fitness cost [34,35], sequence stability compared with other viral particles [36–38], the abundance of Gag protein in incoming virions [39] and more rapid antigen presentation of Gag epitopes following viral infection [35].
The genetic background of any particular population might be an important factor for vaccine efficacy, particularly when limited epitope-specific vaccine designs are used. Kaslow et al. described a predictive power for particular HLA class I alleles for the outcome of vaccine trials, showing that individuals vaccinated with Bw4 epitope, HLA-B*27 or HLA-B*57, HLA alleles associated with slower disease progression, had better responses to an ALVAC–HIV recombinant canarypox vaccine [40–43]. Flores et al. pointed that homozygosity for HLA-Bw4-bearing B alleles is associated with a significant advantage in slowing disease progression and that the HLA-Bw4 motif is important in AIDS pathogenesis[44]. The results of our study also pointed out, although indirectly, to a potential difference in immune responses among carriers of different HLA supertypes. Within Bw4/Bw4 was there a magnitude of T cell responses that had a significant correlation with clinical outcome both in CD4+ T cell count and VL. Furthermore, the highest quantitative range was found in Bw4/Bw4 and was significantly higher than Bw6/Bw6 and Bw4/Bw6. This information assumed that as differences in correlation patterns are related to control of viraemia, differences between diverse major histocompatibility complex (MHC) class I HLA supertypes should be taken into account in vaccine design to elicit optimal T cell responses within HLA supertypes, as well as to design vaccine efficacy trials for participants that represent the population in which such a vaccine would be used in the future.
This study had a number of limitations. First, we focused on Gag-specific T cell immune responses and did not investigate all the viral proteins. As this type of analysis requires a large number of cells, and the volume of blood at our disposal was limited, we chose to focus on Gag responses. Gag was known to be the most important viral target. Instead of testing a large number of OLPs individually, we undertook experiments in triplicate turns to improve reliability of results by using a matrix system. An ideal condition would be to have a sufficient amount of blood to confirm all the responses created by using the individual peptides. Secondly, we did not confirm these OLP responses to T cells using the 51Cr release assay. However, ELISPOT assays are now accepted widely as a technique for mapping T cell epitopes [45]. Thirdly, these research data were based on the single cytokine IFN-γ; we did not evaluate multi-functionality of T cells with other cytokines such as IL-2 or TNF-α [46]. However, our data indicate the existence of a substantial number of unique T cell epitopes in HIV-1B infection; it is therefore worth conducting a systematic analysis of T cell epitopes when vaccine trials are undertaken in different populations infected with different subtypes.
Conclusion
Overall, our data suggest that Bw4/Bw4 allele and T cell selection pressure on the p24 antigen appears to have the most significant impact on HIV replication in this particular form of HIV-B infection in the Chinese population. These findings may be helpful for us to understand the determinants of HIV evolution in Chinese patients, as well as providing important information on immune responses in correlates for protection against the virus.
Acknowledgments
We would like to thank Nilu Goonetilleke for study design, Hao wu for clinical database support, Dr Xiaojie Huang and Ms Yan Fu for the follow-up of patients. This study was supported in part by the National 12th Five-Year Major Projects of China (2012ZX10001001-008), Beijing Municipal of Science and Technology Major Project (D09050703590904), Beijing Traditional Chinese Medicine Science and Technology Major Project (JJ2009-31), Beijing Traditional Chinese Medicine Youth Project (QN2011-12), Beijing Fengtai health Project (2010-06) and Beijing Youan Project (BJYAH-2011-023).
Disclosure
The authors have declared that no competing interests exist.
References
- 1.Patke DS, Langan SJ, Carruth LM. Association of Gag-specific T lymphocyte responses during the early phase of human immunodeficiency virus type 1 infection and lower virus load set point. J Infect Dis. 2002;186:1177–1180. doi: 10.1086/343811. et al. [DOI] [PubMed] [Google Scholar]
- 2.Geldmacher C, Currier JR, Herrmann E. CD8 T cell recognition of multiple epitopes within specific Gag regions is associated with maintenance of a low steady-state viremia in human immunodeficiency virus type 1-seropositive patients. J Virol. 2007;81:440–448. doi: 10.1128/JVI.01847-06. et al. [DOI] [PMC free article] [PubMed] [Google Scholar]
- 3.Foxall RB, Cortesão CS, Albuquerque AS, Soares RS, Victorino RM, Sousa AE. Gag-specific CD4+ T-cell frequency is inversely correlated with proviral load and directly correlated with immune activation in infection with human immunodeficiency virus type 2 (HIV-2) but not HIV-1. J Virol. 2008;82:9795–9799. doi: 10.1128/JVI.01217-08. [DOI] [PMC free article] [PubMed] [Google Scholar]
- 4.Novitsky V, Gilbert P, Peter T, McLane MF, Gaolekwe S. Association between virus-specific T-cell responses and plasma viral load in human immunodeficiency virus type 1 subtype C infection. J Virol. 2003;77:882–890. doi: 10.1128/JVI.77.2.882-890.2003. et al. [DOI] [PMC free article] [PubMed] [Google Scholar]
- 5.Addo MM, Yu XG, Rathod A. Comprehensive epitope analysis of human immunodeficiency virus type 1 (HIV-1)-specific T-cell responses directed against the entire expressed HIV-1 genome demonstrate broadly directed responses, but no correlation to viral load. J Virol. 2003;77:2081–2092. doi: 10.1128/JVI.77.3.2081-2092.2003. et al. [DOI] [PMC free article] [PubMed] [Google Scholar]
- 6.Ostrowski MA, Gu JX, Kovacs C. Quantitative and qualitative assessment of human immunodeficiency virus type 1 (HIV-1)-specific CD4+ T cell immunity to gag in HIV-1-infected individuals with differential disease progression: reciprocal interferon-gamma and interleukin-10 responses. Infect Dis. 2001;184:1268–1278. doi: 10.1086/324005. et al. [DOI] [PubMed] [Google Scholar]
- 7.Betts MR, Ambrozak DR, Douek DC. Analysis of total human immunodeficiency virus (HIV)-specific CD4(+) and CD8(+) T-cell responses: relationship to viral load in untreated HIV infection. J Virol. 2001;75:11983–11991. doi: 10.1128/JVI.75.24.11983-11991.2001. et al. [DOI] [PMC free article] [PubMed] [Google Scholar]
- 8.Peretz Y, Alter G, Boisvert MP, Hatzakis G, Tsoukas CM, Bernard NF. Human immunodeficiency virus (HIV)-specific gamma interferon secretion directed against all expressed HIV genes: relationship to rate of CD4 decline. J Virol. 2005;79:4908–4917. doi: 10.1128/JVI.79.8.4908-4917.2005. [DOI] [PMC free article] [PubMed] [Google Scholar]
- 9.Peretz Y, Tsoukas CM, Bernard NF. HIV Gag-specific immune responses predict the rate of CD4 decline. AIDS. 2008;22:1222–1224. doi: 10.1097/QAD.0b013e3283021a76. [DOI] [PubMed] [Google Scholar]
- 10.Frahm N, Kiepiela P, Adams S. Control of human immunodeficiency virus replication by cytotoxic T lymphocytes targeting subdominant epitopes. Nat Immunol. 2006;7:173–178. doi: 10.1038/ni1281. et al. [DOI] [PubMed] [Google Scholar]
- 11.Kiepiela P, Ngumbela K, Thobakgale C. CD8+ T-cell responses to different HIV proteins have discordant associations with viral load. J Nat Med. 2007;13:46–53. doi: 10.1038/nm1520. et al. [DOI] [PubMed] [Google Scholar]
- 12.Mahlokozera T, Kang HH, Goonetilleke N. The magnitude and kinetics of the mucosal HIV-specific CD8+ T lymphocyte response and virus RNA load in breast milk. PLoS ONE. 2011;6:e23735. doi: 10.1371/journal.pone.0023735. et al. [DOI] [PMC free article] [PubMed] [Google Scholar]
- 13.Jiao Y, Xie J, Li T. Correlation between gag-specific CD8 T-cell responses, viral load, and CD4 count in HIV-1 infection is dependent on disease status. J Acquir Immune Defic Syndr. 2006;42:263–268. doi: 10.1097/01.qai.0000221692.00091.a2. et al. [DOI] [PubMed] [Google Scholar]
- 14.Emu B, Sinclair E, Hatano H. HLA class I-restricted T-cell responses may contribute to the control of human immunodeficiency virus infection, but such responses are not always necessary for long-term virus control. J Virol. 2008;82:5398–5407. doi: 10.1128/JVI.02176-07. et al. [DOI] [PMC free article] [PubMed] [Google Scholar]
- 15.Rerks-Ngarm S, Pitisuttithum P, Nitayaphan S. Vaccination with ALVAC and AIDSVAX to prevent HIV-1 infection in Thailand. N Engl J Med. 2009;361:2209–2220. doi: 10.1056/NEJMoa0908492. et al. [DOI] [PubMed] [Google Scholar]
- 16.Bunce M. PCR-sequence-specific primer typing of HLA class I and class II alleles. Methods Mol Biol. 2003;210:143–171. doi: 10.1385/1-59259-291-0:143. [DOI] [PubMed] [Google Scholar]
- 17.Argüello JR, Little AM, Bohan E, Goldman JM, Marsh SG, Madrigal JA. High resolution HLA class I typing by reference strand mediated conformation analysis (RSCA) J Tissue Antigens. 1998;52:57–66. doi: 10.1111/j.1399-0039.1998.tb03024.x. [DOI] [PubMed] [Google Scholar]
- 18.Ritchie AJ, Campion SL, Kopycinski J. Differences in HIV-specific T cell responses between HIV-exposed and -unexposed HIV-seronegative individuals. J Virol. 2011;85:3507–3516. doi: 10.1128/JVI.02444-10. et al. [DOI] [PMC free article] [PubMed] [Google Scholar]
- 19.Zembe L, Burgers WA, Jaspan HB. Intra- and inter-clade cross-reactivity by HIV-1 Gag specific T-cells reveals exclusive and commonly targeted regions: implications for current vaccine trials. PLoS ONE. 2011;6:e26096. doi: 10.1371/journal.pone.0026096. et al. [DOI] [PMC free article] [PubMed] [Google Scholar]
- 20.Goonetilleke N, Liu MK, Salazar-Gonzalez JF. The first T cell response to transmitted/founder virus contributes to the control of acute viremia in HIV-1 infection. J Exp Med. 2009;206:1253–1272. doi: 10.1084/jem.20090365. et al. [DOI] [PMC free article] [PubMed] [Google Scholar]
- 21.Betts MR, Nason MC, West SM. HIV nonprogressors preferentially maintain highly functional HIV-specific CD8+ T cells. Blood. 2006;107:4781–4789. doi: 10.1182/blood-2005-12-4818. et al. [DOI] [PMC free article] [PubMed] [Google Scholar]
- 22.Zuñiga R, Lucchetti A, Galvan P. Relative dominance of Gag p24-specific cytotoxic T lymphocytes is associated with human immunodeficiency virus control. J Virol. 2006;80:3122–3125. doi: 10.1128/JVI.80.6.3122-3125.2006. et al. [DOI] [PMC free article] [PubMed] [Google Scholar]
- 23.Jiao Y, Xie J, Li T. Correlation between gag-specific CD8 T-cell responses, viral load, and CD4 count in HIV-1 infection is dependent on disease status. Acquir Immune Defic Syndr. 2006;42:263–268. doi: 10.1097/01.qai.0000221692.00091.a2. et al. [DOI] [PubMed] [Google Scholar]
- 24.Sheth PM, Danesh A, Shahabi K. HIV-specific CD8+ lymphocytes in semen are not associated with reduced HIV shedding. J Immunol. 2005;175:4789–4796. doi: 10.4049/jimmunol.175.7.4789. et al. [DOI] [PubMed] [Google Scholar]
- 25.Gamberg J, Barrett L, Bowmer MI, Howley C, Grant M. Factors related to loss of HIV-specific cytotoxic T lymphocyte activity. AIDS. 2004;18:597–604. doi: 10.1097/00002030-200403050-00003. [DOI] [PubMed] [Google Scholar]
- 26.Borrow P, Lewicki H, Hahn BH, Shaw GM, Oldstone MB. Virus-specific CD8+ cytotoxic T-lymphocyte activity associated with control of viremia in primary human immunodeficiency virus type 1 infection. J Virol. 1994;68:6103–6110. doi: 10.1128/jvi.68.9.6103-6110.1994. [DOI] [PMC free article] [PubMed] [Google Scholar]
- 27.Ogg GS, Kostense S, Klein MR. Longitudinal phenotypic analysis of human immunodeficiency virus type 1-specific cytotoxic T lymphocytes: correlation with disease progression. J Virol. 1999;73:9153–9160. doi: 10.1128/jvi.73.11.9153-9160.1999. et al. [DOI] [PMC free article] [PubMed] [Google Scholar]
- 28.Edwards BH, Bansal A, Sabbaj S, Bakari J, Mulligan MJ, Goepfert PA. Magnitude of functional CD8+ T-cell responses to the Gag protein of human immunodeficiency virus type 1 correlates inversely with viral load in plasma. J Virol. 2002;76:2298–2305. doi: 10.1128/jvi.76.5.2298-2305.2002. [DOI] [PMC free article] [PubMed] [Google Scholar]
- 29.van Baalen CA, Pontesilli O, Huisman RC. Human immunodeficiency virus type 1 Rev- and Tat-specific cytotoxic T lymphocyte frequencies inversely correlate with rapid progression to AIDS. J Gen Virol. 1997;78:1913–1918. doi: 10.1099/0022-1317-78-8-1913. et al. [DOI] [PubMed] [Google Scholar]
- 30.Rueda CM, Velilla PA, Chougnet CA, Montoya CJ, HIV-induced RMT. T-cell activation/exhaustion in rectal mucosa is controlled only partially by antiretroviral treatment. PLoS ONE. 2012;7:e30307. doi: 10.1371/journal.pone.0030307. [DOI] [PMC free article] [PubMed] [Google Scholar]
- 31.García-Arriaza J, Nájera JL, Gómez CE. A candidate HIV/AIDS vaccine (MVA-B) lacking vaccinia virus gene C6L enhances memory HIV-1-specific T-cell responses. PLoS ONE. 2011;6:e24244. doi: 10.1371/journal.pone.0024244. et al. [DOI] [PMC free article] [PubMed] [Google Scholar]
- 32.Kiepiela P, Ngumbela K, Thobakgale C. CD8+ T-cell responses to different HIV proteins have discordant associations with viral load. Nat Med. 2007;13:46–53. doi: 10.1038/nm1520. et al. [DOI] [PubMed] [Google Scholar]
- 33.Keating SM, Bollinger RC, Quinn TC, Jackson JB, Carruth LM. Cross-clade T lymphocyte-mediated immunity to HIV type 1: implications for vaccine design and immunodetection assays. AIDS Res Hum Retroviruses. 2002;18:1067–1079. doi: 10.1089/08892220260235425. [DOI] [PubMed] [Google Scholar]
- 34.Martinez-Picado J, Prado JG, Fry EE. Fitness cost of escape mutations in p24 Gag in association with control of human immunodeficiency virus type 1. J Virol. 2006;80:3617–3623. doi: 10.1128/JVI.80.7.3617-3623.2006. et al. [DOI] [PMC free article] [PubMed] [Google Scholar]
- 35.Sacha JB, Chung C, Rakasz EG. Gag specific CD8+ T lymphocytes recognize infected cells before AIDS-virus integration and viral protein expression. J Immunol. 2007;178:2746–2754. doi: 10.4049/jimmunol.178.5.2746. et al. [DOI] [PMC free article] [PubMed] [Google Scholar]
- 36.Buonaguro L, Tornesello ML, Buonaguro FM. Human immunodeficiency virus type 1 subtype distribution in the worldwide epidemic: pathogenetic and therapeutic implications. J Virol. 2007;81:10209–10219. doi: 10.1128/JVI.00872-07. [DOI] [PMC free article] [PubMed] [Google Scholar]
- 37.Goulder PJ, Watkins DI. Impact of MHC class I diversity on immune control of immunodeficiency virus replication. Nat Rev Immunol. 2008;8:619–630. doi: 10.1038/nri2357. [DOI] [PMC free article] [PubMed] [Google Scholar]
- 38.Yusim K, Kesmir C, Gaschen B. Clustering patterns of cytotoxic T-lymphocyte epitopes in human immunodeficiency virus type 1 (HIV-1) proteins reveal imprints of immune evasion on HIV-1 global variation. J Virol. 2002;76:8757–8768. doi: 10.1128/JVI.76.17.8757-8768.2002. et al. [DOI] [PMC free article] [PubMed] [Google Scholar]
- 39.Briggs JA, Simon MN, Gross I. The stoichiometry of Gag protein in HIV-1. Nat Struct Mol Biol. 2004;11:672–675. doi: 10.1038/nsmb785. et al. [DOI] [PubMed] [Google Scholar]
- 40.Kaslow RA, Rivers C, Tang J. Polymorphisms in HLA class I genes associated with both favorable prognosis of human immunodeficiency virus (HIV) type 1 infection and positive cytotoxic T-lymphocyte responses to ALVAC-HIV recombinant canarypox vaccines. J Virol. 2001;75:8681–8689. doi: 10.1128/JVI.75.18.8681-8689.2001. et al. [DOI] [PMC free article] [PubMed] [Google Scholar]
- 41.Peretz Y, Marra O, Thomas R. Relative contribution of HIV-specific functional lymphocyte subsets restricted by protective and non-protective HLA alleles. Viral Immunol. 2011;24:189–198. doi: 10.1089/vim.2010.0117. et al. [DOI] [PubMed] [Google Scholar]
- 42.Boulet S, Bernard NF. Carrying certain KIR3DL1 alleles with HLA-B*57 is associated with protection from HIV infection. Med Sci (Paris) 2008;24:1030–1032. doi: 10.1051/medsci/200824121030. [DOI] [PubMed] [Google Scholar]
- 43.Jin X, Gao X, Ramanathan M., Jr Human immunodeficiency virus type 1 (HIV-1)-specific CD8+-T-cell responses for groups of HIV-1-infected individuals with different HLA-B*35 genotypes. J Virol. 2002;76:12603–12610. doi: 10.1128/JVI.76.24.12603-12610.2002. et al. [DOI] [PMC free article] [PubMed] [Google Scholar]
- 44.Flores-Villanueva PO, Yunis EJ, Delgado JC. Control of HIV-1 viremia and protection from AIDS are associated with HLA-Bw4 homozygosity. Proc Natl Acad Sci USA. 2001;98:5140–5145. doi: 10.1073/pnas.071548198. et al. [DOI] [PMC free article] [PubMed] [Google Scholar]
- 45.Streeck H, Frahm N, Walker BD. The role of IFN-gamma Elispot assay in HIV vaccine research. Nat Protoc. 2009;4:461–469. doi: 10.1038/nprot.2009.7. [DOI] [PubMed] [Google Scholar]
- 46.Olotu A, Moris P, Mwacharo J. Circumsporozoite-specific T cell responses in children vaccinated with RTS,S/AS01E and protection against P falciparum clinical malaria. PLoS ONE. 2011;6:e25786. doi: 10.1371/journal.pone.0025786. et al. [DOI] [PMC free article] [PubMed] [Google Scholar]


