

Abstract
The Royal College of Surgeons (RCS) rat is an established animal model of retinitis pigmentosa, a family of inherited retinal diseases which starts with loss of peripheral vision and progresses to eventual blindness. Blood flow (BF), an important physiological parameter, is intricately coupled to metabolic function under normal physiological conditions and is perturbed in many neurological and retinal diseases. This study reports non-invasive high-resolution MRI (44 × 44 × 600 μm) to image quantitative retinal and choroidal BF and layer-specific retinal thicknesses in RCS rat retinas at different stages of retinal degeneration compared with age-matched controls. The unique ability to separate retinal and choroidal BF was made possible by the depth-resolved MRI technique. RBF decreased with progressive retinal degeneration, but ChBF did not change in RCS rats up to post-natal day 90. We concluded that choroidal and retinal circulations have different susceptibility to progressive retinal degeneration in RCS rats. Layer-specific retinal thickness became progressively thinner and was corroborated by histological analysis in the same animals. MRI can detect progressive anatomical and BF changes during retinal degeneration with laminar resolution.
Keywords: retinal degeneration, retinitis pigmentosa, arterial spin labeling, blood flow, retina, choroid
1. Introduction
Retinitis pigmentosa (RP) is a family of inherited retinal diseases which starts with loss of peripheral vision and progresses to eventual blindness (Phelan and Bok, 2000). The whole process may take decades in human patients, offering opportunities for intervention. RP has a prevalence of about 1 in 4000 (Boughman et al., 1980) and affects about 1.5 million people worldwide. The Royal College of Surgeons (RCS) rat is an established animal model of RP with a mutation in the MERTK gene (Gal et al., 2000), which also occurs in many RP patients. This mutation leads to impaired phagocytosis of the photoreceptor segments, resulting in spontaneous photoreceptor degeneration. In rats, retinal degeneration begins around postnatal day 20 (P20) and completes by P90 (Dowling and Sidman, 1962). There is also evidence of vessel loss in RCS rat retinas during progression of the disease (Pennesi et al., 2008).
Under normal physiological conditions, basal blood flow (BF) is intricately coupled to metabolic function. BF reduction and dysregulation have been implicated in many neurological and retinal diseases. Blood flow to the retina is supplied by two separate circulations, the retinal and choroidal vasculatures. The retinal vasculature exists in the inner retina, and the choroid exists external to the retina. The retinal and choroidal vascular layers are separated by an avascular layer, the outer retina, which consists of the outer nuclear layer and inner and outer segments. The choroid has much higher vessel density and higher choroidal BF (ChBF) compared to the retinal BF (RBF). RBF and ChBF are also different in their regulation mechanisms (Bill and Sperber, 1990; Kiel, 1994). RBF is regulated by metabolic local control to meet metabolic demands while ChBF is not. RBF and ChBF may also have different susceptibility to RP and retinal degeneration (Akyol et al., 1995; Grunwald et al., 1995; Langham and Kramer, 1990; Nilsson et al., 2001). Thus, the ability to image laminar specific BF associated with retinal degeneration could improve our understanding of the pathophysiology and allow us to objectively stage retinal diseases and monitor novel therapeutic strategies.
Optical imaging techniques have been used to image BF in the retina in vivo and they include angiography in humans (Preussner et al., 1983), laser speckle imaging in animals (Cheng and Duong, 2007), laser Doppler flowmetry, and scanning laser ophthalmoscopy (Harris et al., 1998). RBF is typically reported in large retinal vessels or the optic nerve head where retinal vessels dominate. ChBF is typically reported in the foveal region in humans where retinal vessels are absent (Riva et al., 1994). Optically based BF measurement techniques are generally depth ambiguous, except optical coherence tomography. Moreover, many techniques measure BF in large or superficial vessels which may not accurately reflect local tissue perfusion. Optically based imaging techniques also require an unobstructed light pathway and the constrained illumination angle limits the field of view.
In contrast to optical imaging techniques, BF measurements by MRI offer depth-resolved and quantitative data with a large field of view in vivo, and can be used in the case of obstructed light path to the retina (such as cataract). A disadvantage of BF MRI technique is that it takes longer to acquire data compared to optical imaging techniques, and thus more susceptible to motion. Quantitative BF measurements can be measured using continuous arterial spin labeling (cASL) technique (Detre et al., 1994). The cASL sequence magnetically labels blood flow through carotid arteries. The difference between the two images, one with labeling and the other without, is related to tissue perfusion (Detre et al., 1994). An inversion recovery pulse can be used to suppress static signals to improve BF sensitivity (Shen and Duong, 2011).
In this study, we applied high-field (11.7T) MRI with cASL with inversion recovery suppression of static signal to obtain layer-specific quantitative BF and neural retinal thicknesses in RCS rat retinas at different stages of retinal degeneration and compared to age-match controls at high spatial resolution (44 × 44 × 600 μm3). Comparison was made with histology.
2. Methods
2.1. Animal preparation
Animal experiments were performed with IACUC approval and in accordance with the ARVO Statement for the Use of Animals in Ophthalmic and Vision Research. RCS rats on Long-Evans (LE) background were studied on P40, P60, and P90 (n = 6, 5, and 5, respectively). Age-matched LE rats were use as normal controls (n = 5, 5, and 6, respectively). Since the retinal degeneration happened mostly before P90, the animals scanned after P90 were combined as one group noted as P90. The animals were anesthetized with 5% isoflurane initially and maintained at ~1.2% during MRI. Animals were mechanically ventilated and paralyzed using pancuronium bromide (4 mg/kg/h, i.p. infusion). The animal body temperature was maintained using a circulating warm-water pad. The rat heads were immobilized by ear bars and a tooth bar built on the holder. Physiology parameters including end-tidal CO2, O2 saturation, heart rate and rectal temperature were continuously recorded and maintained within normal ranges.
2.2. MRI methods
MRI was performed on an 11.7 T/16 cm Bruker scanner with a 74 G/cm gradient. Small surface eye coils with active decoupling for imaging (inner diameter (ID) = 1 cm was used for P60 and P90, and ID = 0.7 cm for P40) were used for transmitting and receiving signals. A separate butterfly neck coil was placed under the neck for cASL (Silva et al., 1995). BF MRI of a single axial slice bisecting the eye through the optic nerve head was acquired using cASL and 6-segment gradient-echo inversion-recovery EPI with 10 × 10 mm2 field of view, 2.1 s labeling pulse, 4.0 s TR per segment, 2.1 s TI (which occurred during labeling duration), 234 × 234 matrix zero-padded to 256 × 256, single 0.6 mm slice, and 15.4 ms TE. The inversion pulse was used to suppress the signal from the vitreous for high MR sensitivity of the retina. M0 signals were acquired with 6-segment EPI (TR = 10 s, TE = 15.4 ms, 228 × 228 matrix zero-padded to 256 × 256, single 0.6 mm slice). Typically, 20 pairs (labeled and non-labeled) of BF images and 8–10 M0 images were acquired for averaging.
2.3. Data analysis
Images were analyzed using Statistical Parametric Mapping 5 (SPM5) software and Matlab codes (Mathworks Inc.). Images were acquired in time series and initially coregistered using SPM5 software. The curved retinal and choroidal layers were then linearized using Matlab code (Cheng et al., 2006). As shown in Fig. 1A, the green curve was automatically drawn along the retina using edge tracing algorithms. Then intensity profiles were obtained in the direction perpendicular to the green curve with 2× cubic spatial interpolation and along the length of the green curve (Fig. 1B). The profiles, shown as many blue lines, were assembled together to form the linearized image of the retina (Fig. 1C). Then, the linearized labeled and non-labeled retina images were aligned in the direction perpendicular to the retina using minimum square error method. This process was repeated until the minimum square error reached minima. M0 images were processed through the same procedure and then the mean linearized retina M0 image was aligned to the above aligned images acquired for BF. BF images in units of (ml blood)/(g tissue)/min were then obtained from the linearized retinal images (Fig. 1D) using SBF = (λ/T1) [(SNL − SL)/(2αM0(1 − e−LD/T1))], (Shen et al., 2005) where SNL and SL are signal intensities of the non-labeled and labeled images, respectively. λ, the water tissue-blood partition coefficient, was taken to be 0.9, the same as the brain (Herscovitch and Raichle, 1985). λ has not been reported for the retina or choroid. The retina and choroid T1 at 11.7 T was taken to be 2.1 s (Chen et al., 2008). The labeling efficiency α was previously measured to be 0.7 in the distal internal carotid arteries at the base of the frontal lobe (Muir et al., 2008). The average BF along the direction of the mean linearized retina (red dashed lines in Fig. 1D) forms the average BF profile of this retina (Fig. 1E). The group BF profile is the mean of BF profiles of all subjects in this group whose ChBF peaks were aligned manually.
Fig. 1.

Flow chart of retinal image analysis: (A) Green curve drawn along retina; (B) profiles perpendicular to the green curve; (C) linearized retina; (D) average along linearized retinal BF image forming average BF profile; (E) average BF profile of the retina.
The retina forms a well-defined layer in M0 images. The neural retinal thickness excluding the choroid can be easily measured in the linearized retina M0 images by counting pixels as shown in Fig. 1C. Two measurements were taken on each side of the optic nerve head, and then averaged as mean retinal thickness. Choroidal thickness was however not measured because EPI image was not optimized to measure choroidal thickness in contrast to conventional imaging technique reported previously (Cheng et al., 2006).
2.4. Histology
Rat eyes were enucleated immediately after MRI. 20 μl of 10% formalin in phosphate buffered saline solution was injected into the vitreous two times using a 10-μl Hamilton syringe and a 30-gauge needle. The eyes were then preserved in the 10% formalin solution at least overnight. Eyes were embedded in paraffin and sliced at the thickness of 10 μm. Two central slices bisecting the eyes through optic nerve head were obtained and stained using hematoxylin and eosin (H&E stain). The neural retinal thicknesses were measured under a microscope with 100 magnification factor. The reported neural retina thicknesses are the mean value of the two measurements on each side of the optic nerve head. The measurement sites were chosen as consistent as possible.
2.5. Statistical analysis
All statistics were performed using STATA® 11. The Student t-test was used to compare the means of two groups in BF measurements and histological retinal thicknesses. ANOVA was used to compare RBF or ChBF peaks and histological thicknesses among groups. Kruskale–Wallis test was used for analysis of ranks and the median test for MRI retinal thicknesses among groups and Wilcoxon rank-sum test was used to test between MRI retinal thicknesses of two groups. These two nonparametric tests were used to analyze MRI retinal thicknesses since the MRI retinal thicknesses are discrete values. Values are reported as mean ± standard deviations. The p-value used to determine the significance was 0.05.
3. Results
Histological comparison between normal and RCS retinas at P90 (Fig. 2) shows that the outer and inner segment layers (OS and IS), outer nuclear layer (ONL) and outer plexiform layer (OPL) in the RCS rat retina is essentially completely degenerated by this time. The group-averaged retinal thicknesses at three time points measured by MRI and histology are summarized in Fig. 3 and Table 1. In normal rats, MRI measurements of retinal thicknesses indicated that there was a weak trend toward slightly thicker retina (p = 0.015, Kruskale–Wallis) with age. The MRI retinal thickness increases significantly from P40 to P60 and P90 by ~25 μm (p < 0.01 and p = 0.025, respectively, Wilcoxon). However, the retina thickness does not increase significantly from P60 to P90 (p = 0.27, Wilcoxon), suggesting the retina was still growing at P40.
Fig. 2.
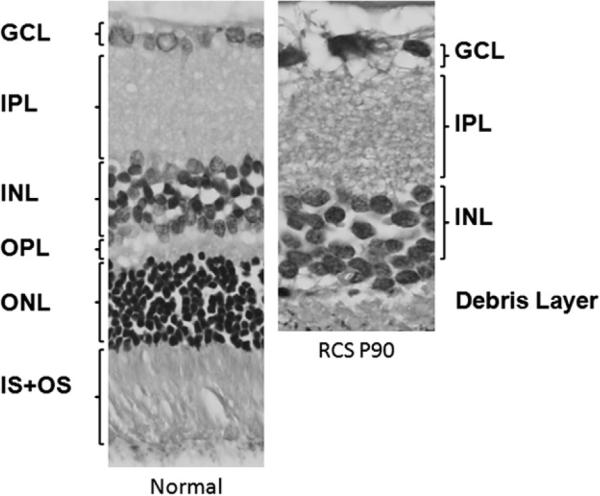
Histology of a normal retina and a Royal College of Surgeons (RCS) retina at postnatal day 90 (P90). At P90, the IS + OS, ONL and OPL are almost completely degenerated. Note: GCL: Ganglion cell layer, IPL: inner plexiform layer, INL: inner nuclear layer, OPL: outer plexiform layer, ONL: outer nuclear layer, and IS + OS: inner and outer segments.
Fig. 3.

Average retinal thickness measured in anatomical MR and histology samples (mean ± SD). At P40, the retinal thickness of the normal is not significantly different from the diseased in both MRI (p = 0.45) and histological (1 = 0.10, t-test) methods, but the diseased retinal thicknesses are significantly smaller at P60 (MRI: p < 0.01; histology: p < 0.005) and P90 (MRI: p < 0.01; histology: p < 0.001). Moreover, the normal thickness of P40 is slightly but significantly smaller than that of the P60 (MRI: p < 0.01).
Table 1.
Neural retinal thicknesses (excluding the choroid) by histology and by MRI (mean ± SD).
| Histology |
MRI |
||||||||
|---|---|---|---|---|---|---|---|---|---|
| GCL | IPL | INL | OPL | ONL | IS | OS | Total | Total | |
| LE P40 | 17 ± 2 | 64 ± 9 | 52 ± 4 | 12 ± 2 | 66 ± 5 | 19 ± 3 | 34 ± 4 | 264 ± 25 | 191 ± 5‡ |
| LE P60 | 15 ± 0 | 63 ± 3 | 57 ± 11 | 12 ± 1 | 65 ± 10 | 23 ± 5 | 35 ± 5 | 270 ± 28§ | 212 ± 5*,‡ |
| LE P90 | 15 ± 1 | 56 ± 3 | 39 ± 2 | 13 ± 1 | 55 ± 6 | 17 ± 1 | 25 ± 2 | 219 ± 10§§ | 217 ± 19** |
| RCS P40 | 15 ± 4 | 62 ± 17 | 49 ± 7 | 7 ± 2 | 38 ± 12 | 8 ± 4 | 42 ± 8 | 222 ± 47 | 196 ± 14 |
| RCS P60 | 13 ± 1 | 59 ± 9 | 50 ± 2 | 4 ± 2 | 12 ± 1 | 2 ± 3 | 22 ± 6 | 160 ± 4§ | 165 ± 13* |
| RCS P90 | 11 ± 0 | 48 ± 10 | 37 ± 4 | 6 ± 4 | 1 ± 1 | 0 ± 0 | 2 ± 4 | 106 ± 18§§ | 142 ± 16** |
Statistical significances:
, with p < 0.05.
Compared with age-match controls, the MRI retinal thickness of the RCS rats at P40, was not significantly different (p = 0.45, Wilcoxon) but were significant at P60 and P90 (p < 0.01, Wilcoxon). In RCS, from P40 to P60, the retinal thickness significantly decreased by 31 μm (p = 0.0097, Wilcoxon), and from P60 to P90, it decreased significantly by another 23 μm (p = 0.03, Wilcoxon). For RCS rats, the MRI retinal thicknesses decreased with age (p < 0.01, Kruskale–Wallis, p < 0.03 Wilcoxon for hypothesis tests between two groups).
The retinal thicknesses measured by histology had similar trends in retinal thinning. Compared with age-match controls, the histological retinal thickness of the RCS rats at P40, was not significantly different (p = 0.1, t-test) but was significant at P60 and P90 (p < 0.005 and p < 0.001, t-test). The histological retinal thickness of the RCS groups also showed the decreasing trend with age (p = 0.017, 0.002, and 0.0001, t-test, significance level with Bonferroni correction: 0.017). Table 1 shows individual layer thicknesses by histology. The measurements of IS, OS, ONL and OPL by histology at P90 were not statistically different from zero, confirming the complete retinal degeneration at this time point. The total retinal thickness of the P90 RCS group was about half of that of the normal group.
Fig. 4 shows a representative BF image of a normal LE rat eye (44 × 44 × 600 μm), and group-averaged BF profiles of RCS and age-matched controls at P40, P60 and P90. The RBF and ChBF layers and the avascular region in between were well resolved on the image of the normal retina. In the normal group, RBF peaks were resolvable at all three time points. In the RCS group, RBF was resolvable only at P40 but not at P60 and P90.
Fig. 4.

A blood flow MR image of a normal eye at postnatal day 90 (P90) and average blood flow profiles of the normal control groups and Royal College of Surgeons (RCS) groups at P40, P60 and P90, respectively. Retinal blood flow (RBF) peaks were detectable in all normal group and the RCS groups at P40.
The group-averaged RBF and ChBF peak values in the normal and RCS groups at three time points are summarized in Fig. 5. The RBF peaks of the normal and RCS groups were not significantly different from each other at P40 (p = 0.42, t-test). ChBF values were unaltered during the progression of the disease in RCS rats compared to age-matched normal rats (p > 0.5 at P40, P60 and P90, t-test). RBF was not significantly different in the normal groups (p = 0.83, ANOVA) and ChBF remained unchanged from P40 to P90 in all groups (p = 0.63, ANOVA).
Fig. 5.
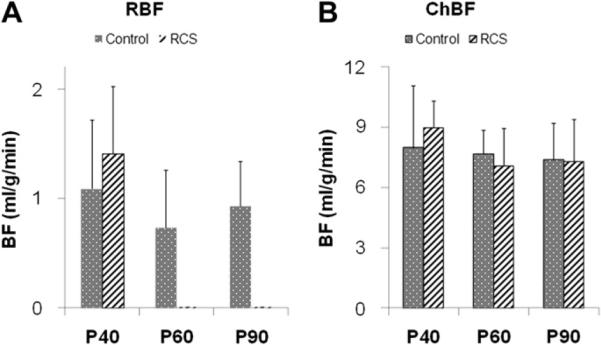
Retinal blood flow (RBF) peak values (A) and choroidal blood flow (ChBF) peak values (B) at P40, P60 and P90 of normal and RCS rats (mean ± SD). RBFs became unresolvable at P60 and P90 in the RCS rats. At P40, RBFs were not significantly different between the normal and RCS group (t-test: p = 0.42). RBFs of all three normal groups were not significantly different (ANOVA: p = 0.83). ChBFs were not significantly different at all three time points (t-test: p = 0.53, 0.56 and 0.90, respectively), and ChBFs of all groups were not significantly different (ANOVA: p = 0.63).
4. Discussion
This study demonstrated depth-resolved, layer-specific quantitative BF and anatomical changes associated with retinal degeneration in rats with ultrahigh field (11.7T) MRI. There was no significant difference in ChBF between RCS and normal rats with the progression of retinal degeneration up to P90. However, RBF became unresolvable in the RCS groups by P60 while there was no significant difference in RBF between RCS and normal rats at P40 when RBF was still resolvable. This was likely due to anatomical thinning and/or RBF was reduced below noise level. RBF and ChBF appeared to have different susceptibility to the retinal degeneration. MRI detected thinning of the retina, consistent with the histological thinning of the ONL and the photoreceptor segments at P60 and P90. These results indicate that MRI can effectively detect progressive anatomical and BF changes during retinal degeneration with laminar resolution.
4.1. Retinal thickness
The neural retinal thickness of normal rat at P60 in this study was 270 ± 28 μm (pre-made 10% formalin). In a previous study using 2% paraformaldehyde (Cheng et al., 2006), the neural retina was 205 ± 11 μm. Our neural retinal thickness is in reasonable agreement with the total thickness of the rat neural retina reported using histology (Baris Toprak et al., 2002; Joly et al., 2006), ultrasound (Jolly et al., 2005) and optical coherence tomography (Sho et al., 2005; Thomas et al., 2006).
Progressive retinal thinning in P40–P90 RCS rats was detected using both MRI and histological techniques, consistent with previous findings (Cheng et al., 2006). However, MRI thickness was slightly thinner than the corresponding histological measurement (Table 1). Possible causes included: 1) histological processing procedures, such as fixatives (Chen et al., 2008) and variation of the cutting plane orientations for histology. 2) EPI distortion and partial-volume-effect (PVE) causing bias in the MRI measurements.
4.2. Blood flow
Our normal ChBF (including all three normal groups) was 7.70 ± 2.04 ml/g/min and RBF was 0.97 ± 0.47 ml/g/min, consistent with ChBF in normal mice which has been reported to be 7.7 ± 2.1 ml/g/min and RBF 1.3 ± 0.44 ml/g/min by MRI (Muir and Duong, 2011b). ChBF is markedly higher than RBF as expected. RBF is similar to cerebral BF of ~1 ml/g/min (Shen et al., 2005; Sicard and Duong, 2005). In normal animals, ChBF ranged from 1.42 to 18.98 ml/g/min and RBF ranged from 0.4 to 0.92 ml/g/min using various techniques (Cioffi et al., 2003; Pouliot et al., 2009; Roth, 1992; Tilton et al., 1988, 1999). By contrast, a previous MRI study failed to detect layer specific BF in rats (Li et al., 2009).
ChBF was not affected by retinal degeneration in RCS rats up to P90. This finding is unexpected since ChBF supplies the photoreceptors that have been lost during the degeneration. However, similar findings have been reported in a cat (Nilsson et al., 2001) and the rd10 mouse (Muir et al., in press) retinal degeneration model although different species show different time courses of degeneration. An exception is that decreased ChBF was reported in human retinitis pigmentosa (Langham and Kramer, 1990). Possible explanations for the discrepancy are: 1) ChBF does not change in response to lower metabolic demand caused by photoreceptor loss since the choroidal vasculature is not regulated by metabolic local control (Kiel, 2010), and 2) ChBF reduction may occur at much later stage since vascular damage is secondary to the neuron loss. The supporting evidence for the latter explanation is that choriocapillaris atrophy, detected by scanning electron microscopy, did not occur before week 10 in a mouse retinal degeneration model, even though photoreceptor loss starts only few days after birth (Neuhardt et al., 1999).
RBF in the RCS rat retina became not resolvable by P60. Since retinal vasculature is regulated by local metabolic controls (Kiel, 2010), RBF might decrease in response to the low metabolic demand due to less neural activities following the loss of photoreceptors. Retinal vessel loss in RCS rat retinas has been reported using destructive techniques (Pennesi et al., 2008). Reduced RBF has been reported in human retinitis pigmentosa (Akyol et al., 1995; Grunwald et al., 1996), and cat (Nilsson et al., 2001) and mouse (Muir and Duong, 2011a) hereditary retinal degeneration. Retinal vasculature atrophy also occurs in RCS rats (Wang et al., 2003) and mouse models (Blanks and Johnson, 1986; Matthes and Bok, 1984; Penn et al., 2000). Our result is consistent with these findings. Another possible explanation is that the distance between retinal and choroidal BF peaks decreased with progressive degeneration. ChBF and RBF differed by a factor of ~7, thus the retinal peak is susceptible to PVE by the strong choroid peak in the thinned RCS retina.
Reduced RBF is consistent with oxygen electrode measurements in rat and cat retinal degeneration models (Padnick-Silver et al., 2006; Yu et al., 2000; Yu and Cringle, 2005). The loss of photoreceptors could reduce output to the inner retina and thereby reduce activity in the inner retina. The loss of photoreceptor metabolism allows choroidal oxygen to reach the inner retina, thereby attenuating retinal circulation via oxygen vasoconstriction.
Nair et al. employed blood volume (BV) MRI with an exogenous contrast agent to study RCS rat retinas (Nair et al., 2011b). They found that RCS rats showed thinning of the avascular layer, increases in relative baseline retinal and choroidal BVs, and increased hypercapnia-induced BV changes compared to controls (p < 0.05). Our finding of RBF decrease is inconsistent with BV increases in RCS rat retinas if BF and BV were coupled to each other under normal physiological conditions. Possible explanations include: BV and BF are not coupled in diseases and/or the exogenous contrast agent leaked out of the vasculature in RCS rat retinas, overestimating BV. There are evidences that vascular permeability has been shown to increase with age in RCS retina using fluorescein angiography (Satoh and Yamaguchi, 2000). Advantages of ASL MRI over this BV MRI technique is that ASL MRI is quantitative and does not require an exogenous contrast.
Muir et al. (in press) demonstrated layer specific BF in rd10 mice at 42 × 42 μm using a high-performance gradient insert. The rd10 mouse has a mutation in the gene for rod phosphodiesterase, resulting in rod death and secondary cone death (Chang et al., 2007). The RBF could only clearly be distinguished at the youngest age in the rd10 mice, before the retina had mostly degenerated. In rd10 mice, RBF decreased progressively over time while ChBF was unchanged. Muir et al. also noted that in older age rd10 mice, RBF was below noise level to be detectable or spatial resolution was inadequate due to the thinned retina. They also discussed possible issues of the high choroid BF signal contaminating the RBF signal in the thinned retina due to relatively low spatial resolution of MRI. Our results are in general agreement with Muir et al. These two studies demonstrated layer specific BF changes in animal models with two different genetic mutations that cause retinal degeneration through different mechanisms, providing support for BF changes as a potential imaging biomarker for heterogeneous retinal degenerations. Future studies will investigate potential subtle differences in layer specific BF changes and treatment responses between the two models, especially at earlier time points before retinal thinning occurs.
In BF MRI application, rat models offer some advantages over mouse models. They include larger eyes, longer time course of degeneration, and ease of mechanical ventilation with paralysis to achieve stable physiology for fMRI studies. In addition, the rat experiments can be done on more readily available gradient units whereas the mouse study was performed on a smaller (not suitable for rats) and more powerful MRI gradient unit that is less widely available. BF MRI offers several advantages, including measurement of tissue perfusion in classical unit of ml/g/min without the needs to visualize individual vessels and an exogenous contrast agent. BF MRI offers a large field of view and its quantitative nature allows across subject comparison in vivo.
4.3. Other imaging studies on rodent models
Retinal degeneration in rodents has been studied using various imaging techniques including OCT, diffusion MRI and manganese-enhance MRI (MEMRI). OCT found outer retina thinning and retina remodeling during retinal degeneration in rodents (Sarunic et al., 2010) and human (Aleman et al., 2008). Chen et al. (2010) reported disorganized cell alignment in rd1 mice through diffusion tensor MRI. Wang et al. showed that diffusion-weighted MRI and GD-DTPA-enhanced MRI can detect vasogenic edema and blood–retinal barrier leakage in retinal degeneration in the rd1 mouse (Wang et al., 2011). Berkowitz et al. observed intraretinal ionic dysregulation and retinal thinning during the progression of retinal degeneration in RCS rats (Berkowitz et al., 2006, 2008) by measuring uptake of manganese ion (a calcium analog and a MRI contrast agent). Nair et al. identified six neural layers in the retina using intraocular MEMRI, which may be used to determine layer-specific anatomic changes for retinal degeneration (Nair et al., 2011a) in a RCS rat model. These studies are consistent with our findings of retinal thinning and retinal vascular dysfunction in RCS rats.
5. Conclusion
This study demonstrated depth-resolved, layer-specific quantitative BF and anatomical changes associated with retinal degeneration in rats. Choroidal and retinal circulations have different susceptibility to progressive retinal degeneration in RCS rats. RBF decreased with progressive retinal degeneration and thinning, but ChBF did not change in RCS rats up to P90. MRI also has potential to provide layer-specific multimodality anatomical, physiological and functional information in the same setting. This approach could open up new avenues for retinal disease research.
Abbreviations
- RCS
Royal College of Surgeons
- BF
blood flow
- RBF
retinal blood flow
- ChBF
choroidal blood flow
- cASL
continuous arterial spin labeling
- IR
inversion recovery
- EPI
echo planar imaging
- LD
label duration
- SD
standard deviation
- RP
retinitis pigmentosa
- PVE
partial volume effect
Footnotes
Grant support: This work was supported in part by the NIH/NEI (R01 EY014211 and EY018855), and a MERIT Award from the Department of Veterans Affairs, and a Clinical Translational Science Award Supplement (parent grant UL1RR025767).
References
- Akyol N, Kukner S, Celiker U, Koyu H, Luleci C. Decreased retinal blood flow in retinitis pigmentosa. Can. J. Ophthalmol. 1995;30:28–32. [PubMed] [Google Scholar]
- Aleman TS, Cideciyan AV, Sumaroka A, Windsor EAM, Herrera W, White DA, Kaushal S, Naidu A, Roman AJ, Schwartz SB, Stone EM, Jacobson SG. Retinal laminar architecture in human retinitis pigmentosa caused by rhodopsin gene mutations. Invest. Ophthalmol. Vis. Sci. 2008;49:1580–1590. doi: 10.1167/iovs.07-1110. [DOI] [PMC free article] [PubMed] [Google Scholar]
- Baris Toprak A, Ozbilgin K, Toprak V, Tuglu I, Guler C. A histological analysis of the protective effect of ischemic preconditioning in the rat retina. Curr. Eye Res. 2002;24:234–239. doi: 10.1076/ceyr.24.3.234.8308. [DOI] [PubMed] [Google Scholar]
- Berkowitz BA, Roberts R, Goebel DJ, Luan H. Noninvasive and simultaneous imaging of layer-specific retinal functional adaptation by manganese-enhanced MRI. Invest. Ophthalmol. Vis. Sci. 2006;47:2668–2674. doi: 10.1167/iovs.05-1588. [DOI] [PubMed] [Google Scholar]
- Berkowitz BA, Gradianu M, Schafer S, Jin Y, Porchia A, Iezzi R, Roberts R. Ionic dysregulatory phenotyping of pathologic retinal thinning with manganese-enhanced MRI. Invest. Ophthalmol. Vis. Sci. 2008;49:3178–3184. doi: 10.1167/iovs.08-1720. [DOI] [PMC free article] [PubMed] [Google Scholar]
- Bill A, Sperber GO. Control of retinal and choroidal blood flow. Eye. 1990;4:319–325. doi: 10.1038/eye.1990.43. [DOI] [PubMed] [Google Scholar]
- Blanks JC, Johnson LV. Vascular atrophy in the retinal degenerative rd mouse. J. Comp. Neurol. 1986;254:543–553. doi: 10.1002/cne.902540407. [DOI] [PubMed] [Google Scholar]
- Boughman JA, Conneally PM, Nance WE. Population genetic studies of retinitis pigmentosa. Am. J. Hum. Genet. 1980;32:223–235. [PMC free article] [PubMed] [Google Scholar]
- Chang B, Hawes NL, Pardue MT, German AM, Hurd RE, Davisson MT, Nusinowitz S, Rengarajan K, Boyd AP, Sidney SS, Phillips MJ, Stewart RE, Chaudhury R, Nickerson JM, Heckenlively JR, Boatright JH. Two mouse retinal degenerations caused by missense mutations in the beta-subunit of rod cGMP phosphodiesterase gene. Vision. Res. 2007;47:624–633. doi: 10.1016/j.visres.2006.11.020. [DOI] [PMC free article] [PubMed] [Google Scholar]
- Chen J, Wang Q, Zhang J, Yang X, Wang J, Berkowitz BA, Wickline SA, Song SK. In vivo quantification of T1, T2, and apparent diffusion coefficient in the mouse retina at 11.74T. Magn. Reson. Imaging. 2008;59:731–738. doi: 10.1002/mrm.21570. [DOI] [PubMed] [Google Scholar]
- Chen J, Wang Q, Chen S, Wickline SA, Song SK. In vivo diffusion tensor MRI of the mouse retina: a noninvasive visualization of tissue organization. NMR. Biomed. 2010 doi: 10.1002/nbm.1609. [DOI] [PMC free article] [PubMed] [Google Scholar]
- Cheng H, Nair G, Walker TA, Kim MK, Pardue MT, Thule PM, Olson DE, Duong TQ. Structural and functional MRI reveals multiple retinal layers. Proc. Natl. Acad. Sci. U. S. A. 2006;103:17525–17530. doi: 10.1073/pnas.0605790103. [DOI] [PMC free article] [PubMed] [Google Scholar]
- Cheng H, Duong TQ. Simplified laser-speckle-imaging analysis method and its application to retinal blood flow imaging. Opt. Lett. 2007;32:2188–2190. doi: 10.1364/ol.32.002188. [DOI] [PMC free article] [PubMed] [Google Scholar]
- Cioffi G, Granstam E, Alm A. Ocular Circulation. Adler's Physiology of the Eye. 2003:747–784. [Google Scholar]
- Detre JA, Zhang W, Roberts DA, Silva AC, Williams DS, Grandis DJ, Koretsky AP, Leigh JS. Tissue specific perfusion imaging using arterial spin labeling. NMR. Biomed. 1994;7:75–82. doi: 10.1002/nbm.1940070112. [DOI] [PubMed] [Google Scholar]
- Dowling JE, Sidman RL. Inherited retinal dystrophy in the rat. J. Cell. Biochem. 1962;14:73–109. doi: 10.1083/jcb.14.1.73. [DOI] [PMC free article] [PubMed] [Google Scholar]
- Gal A, Li Y, Thompson DA, Weir J, Orth U, Jacobson SG, Apfelstedt-Sylla E, Vollrath D. Mutations in MERTK, the human orthologue o the RCS rat retinal dystrophy gene, cause retinitis pigmentosa. Nat. Genet. 2000;26:270–271. doi: 10.1038/81555. [DOI] [PubMed] [Google Scholar]
- Grunwald JE, Maguire AM, Brucker AJ, Dupont JC, Riva CE. Retinal blood-flow and its regulation in patients with retinitis-pigmentosa. Invest. Ophthalmol. Vis. Sci. 1995;36:S1040. [Google Scholar]
- Grunwald JE, Maguire AM, Dupont J. Retinal hemodynamics in retinitis pigmentosa. Am. J. Ophthalmol. 1996;122:502–508. doi: 10.1016/s0002-9394(14)72109-9. [DOI] [PubMed] [Google Scholar]
- Harris A, Kagemann L, Cioffi GA. Assessment of human ocular hemodynamics. Surv. Ophthalmol. 1998;42:509–533. doi: 10.1016/s0039-6257(98)00011-3. [DOI] [PubMed] [Google Scholar]
- Herscovitch P, Raichle ME. What is the correct value for the brain-blood partition coefficient for water? J. Cereb. Blood Flow Metab. 1985;5:65–69. doi: 10.1038/jcbfm.1985.9. [DOI] [PubMed] [Google Scholar]
- Jolly C, Jeanny JC, Behar-Cohen F, Laugier P, Saied A. High-resolution ultrasonograophy of subretinal structure and assessment of retina degeneration in rat. Exp. Eye Res. 2005;81:592–601. doi: 10.1016/j.exer.2005.03.018. [DOI] [PubMed] [Google Scholar]
- Joly S, Pernet V, Dorfman AL, Chemtob S, Lachapelle P. Light-induced retinopathy: comparing adult and juvenile rats. Invest. Ophthalmol. Vis. Sci. 2006;47:3202–3212. doi: 10.1167/iovs.05-1515. [DOI] [PubMed] [Google Scholar]
- Kiel JW. Choroidal myogenic autoregulation and intraocular pressure. Exp. Eye Res. 1994;58:529–543. doi: 10.1006/exer.1994.1047. [DOI] [PubMed] [Google Scholar]
- Kiel JW. The Ocular Circulation. Morgan & Claypool Life Sciences; San Rafael (CA): 2010. [PubMed] [Google Scholar]
- Langham ME, Kramer T. Decreased choroidal blood flow associated with retinitis pigmentosa. Eye (Lond) 1990;4(Pt 2):374–381. doi: 10.1038/eye.1990.50. [DOI] [PubMed] [Google Scholar]
- Li Y, Cheng H, Shen Q, Kim M, Thule PM, Olson DE, Pardue MT, Duong TQ. Blood-flow magnetic resonance imaging of retinal degeneration. Invest. Ophthalmol. Vis. Sci. 2009;50:1824–1830. doi: 10.1167/iovs.08-2188. [DOI] [PMC free article] [PubMed] [Google Scholar]
- Matthes MT, Bok D. Blood vascular abnormalities in the degenerative mouse retina (C57BL/6J-rd le) Invest. Ophthalmol. Vis. Sci. 1984;25:364–369. [PubMed] [Google Scholar]
- Muir ER, Shen Q, Duong TQ. Cerebral blood flow MRI in mice using the cardiac-spin-labeling technique. Magn. Reson. Med. 2008;60:744–748. doi: 10.1002/mrm.21721. [DOI] [PMC free article] [PubMed] [Google Scholar]
- Muir ER, Duong TQ. Layer-specific retinal and choroidal blood-flow MRI of retinitis pigmentosa in mice. Proc. Int. Soc. Magn. Reson. Med. 2011a [Google Scholar]
- Muir ER, Duong TQ. MRI of retinal and choroidal blood flow with laminar resolution. NMR. Biomed. 2011b;24:216–223. doi: 10.1002/nbm.1576. [DOI] [PMC free article] [PubMed] [Google Scholar]
- Muir ER, De La Garza B, Duong TQ. Blood flow and anatomical MRI in a mouse model of retinitis pigmentosa. Magn. Reson. Med. doi: 10.1002/mrm.24232. in press. [DOI] [PMC free article] [PubMed] [Google Scholar]
- Nair G, Pardue MT, Kim M, Duong TQ. Manganese-enhanced MRI reveals multiple cellular and vascular layers in normal and degenerated retinas. J. Magn. Reson. Imaging. 2011a;34:1422–1429. doi: 10.1002/jmri.22719. [DOI] [PMC free article] [PubMed] [Google Scholar]
- Nair G, Tanaka Y, Kim M, Olson DE, Thule PM, Pardue MT, Duong TQ. MRI reveals differential regulation of retinal and choroidal blood volumes in rat retina. Neuroimage. 2011b;54:1063–1069. doi: 10.1016/j.neuroimage.2010.09.020. [DOI] [PMC free article] [PubMed] [Google Scholar]
- Neuhardt T, May CA, Wilsch C, Eichhorn M, Lutjen-Drecoll E. Morphological changes of retinal pigment epithelium and choroid in rd-mice. Exp. Eye Res. 1999;68:75–83. doi: 10.1006/exer.1998.0589. [DOI] [PubMed] [Google Scholar]
- Nilsson SFE, Maepea O, Alm A, Narfstrom K. Ocular blood flow and retinal metabolism in Abyssinian cats with hereditary retinal degeneration. Invest. Ophthalmol. Vis. Sci. 2001;42:1038–1044. [PubMed] [Google Scholar]
- Padnick-Silver L, Kang Derwent JJ, Giuliano E, Narfstrom K, Linsenmeier RA. Retinal oxygenation and oxygen metabolism in Abyssinian cats with a hereditary retinal degeneration. Invest. Ophthalmol. Vis. Sci. 2006;47:3683–3689. doi: 10.1167/iovs.05-1284. [DOI] [PubMed] [Google Scholar]
- Penn JS, Li S, Naash MI. Ambient hypoxia reverses retinal vascular attenuation in a transgenic mouse model of autosomal dominant retinitis pigmentosa. Invest. Ophthalmol. Vis. Sci. 2000;41:4007–4013. [PubMed] [Google Scholar]
- Pennesi ME, Nishikawa S, Matthes MT, Yasumura D, LaVail MM. The relationship of photoreceptor degeneration to retinal vascular development and loss in mutant rhodopsin transgenic and RCS rats. Exp. Eye Res. 2008;87:561–570. doi: 10.1016/j.exer.2008.09.004. [DOI] [PMC free article] [PubMed] [Google Scholar]
- Phelan JK, Bok D. A brief review of retinitis pigmentosa and the identified retinitis pigmentosa genes. Mol. Vis. 2000;6:116–124. [PubMed] [Google Scholar]
- Pouliot M, Deschenes MC, Hetu S, Chemtob S, Lesk MR, Couture R, Vaucher E. Quantitative and regional measurement of retinal blood flow in rats using N-isopropyl-p-[C-14]-iodoamphetamine ([C-14]-IMP) Exp. Eye Res. 2009;89:960–966. doi: 10.1016/j.exer.2009.08.005. [DOI] [PubMed] [Google Scholar]
- Preussner PR, Richard G, Darrelmann O, Weber J, Kreissig I. Quantitative measurement of retinal blood flow in human beings by application of digital image-processsing methods to television fluorescein angiograms. Graefes Arch. Clin. Exp. Ophthalmol. 1983;221:110–112. doi: 10.1007/BF02133848. [DOI] [PubMed] [Google Scholar]
- Riva CE, Cranstoun SD, Grunwald JE, Petrig BL. Choroidal blood flow in the foveal region of the human ocular fundus. Invest. Ophthalmol. Vis. Sci. 1994;35:4273–4281. [PubMed] [Google Scholar]
- Roth S. The effects of halothane on retinal and choroidal blood flow in cats. Anesthesiology. 1992;76:455–460. doi: 10.1097/00000542-199203000-00020. [DOI] [PubMed] [Google Scholar]
- Sarunic MV, Yazdanpanah A, Gibson E, Xu J, Bai YJ, Lee S, Saragovi HU, Beg MF. Longitudinal study of retinal degeneration in a rat using spectral domain optical coherence tomography. Opt. Express. 2010;18:23435–23441. doi: 10.1364/OE.18.023435. [DOI] [PubMed] [Google Scholar]
- Satoh T, Yamaguchi K. Ocular fundus abnormalities detected by fluorescein and indocyanine green angiography in the Royal College of Surgeons dystrophic rat. Exp. Anim. 2000;49:275–280. doi: 10.1538/expanim.49.275. [DOI] [PubMed] [Google Scholar]
- Shen Q, Ren H, Cheng H, Fisher M, Duong TQ. Functional, perfusion and diffusion MRI of acute focal ischemic brain injury. J. Cereb. Blood Flow Metab. 2005;25:1265–1279. doi: 10.1038/sj.jcbfm.9600132. [DOI] [PMC free article] [PubMed] [Google Scholar]
- Shen Q, Duong TQ. Background suppression in arterial spin labeling MRI with a separate neck labeling coil. NMR. Biomed. 2011 doi: 10.1002/nbm.1666. [DOI] [PMC free article] [PubMed] [Google Scholar]
- Sho K, Takahashi K, Fukuchi T, Matsumura M. Quantitative evaluation of ischemia-reperfusion injury by optical coherence tomography in the rat retina. Jpn. J. Ophthalmol. 2005;49:109–113. doi: 10.1007/s10384-004-0150-3. [DOI] [PubMed] [Google Scholar]
- Sicard KM, Duong TQ. Effects of hypoxia, hyperoxia and hypercapnia on baseline and stimulus-evoked BOLD, CBF and CMRO2 in spontaneously breathing animals. Neuroimage. 2005;25:850–858. doi: 10.1016/j.neuroimage.2004.12.010. [DOI] [PMC free article] [PubMed] [Google Scholar]
- Silva AC, Zhang W, Williams DS, Koretsky AP. Multi-slice MRI of rat brain perfusion during amphetamine stimulation using arterial spin labeling. Magn. Reson. Med. 1995;33:209–214. doi: 10.1002/mrm.1910330210. [DOI] [PubMed] [Google Scholar]
- Thomas BB, Arai S, Ikai Y, Qiu G, Chen Z, Aramant RB, Sadda SR, Seiler MJ. Retinal transplants evaluated by optical coherence tomography in photoreceptor degenerate rats. J. Neurosci. Methods. 2006;151:186–193. doi: 10.1016/j.jneumeth.2005.07.004. [DOI] [PubMed] [Google Scholar]
- Tilton RG, Chang K, Weigel C, Eades D, Sherman WR, Kilo C, Williamson JR. Increased ocular blood flow and 125I-albumin permeation in galactosefed rats: inhibition by sorbinil. Invest. Ophthalmol. Vis. Sci. 1988;29:861–868. [PubMed] [Google Scholar]
- Tilton RG, Chang KC, LeJeune WS, Stephan CC, Brock TA, Williamson JR. Role for nitric oxide in the hyperpermeability and hemodynamic changes induced by intravenous VEGF. Invest. Ophthalmol. Vis. Sci. 1999;40:689–696. [PubMed] [Google Scholar]
- Wang Q, Song SK, Zhang H, Berkowitz BA, Chen S, Wickline SA, Chen J. Photoreceptor degeneration changes magnetic resonance imaging features in a mouse model of retinitis pigmentosa. Magn. Reson. Med. 2011;65:1793–1798. doi: 10.1002/mrm.22751. [DOI] [PMC free article] [PubMed] [Google Scholar]
- Wang S, Villegas-Perez M, Holmes T, Lawrence JM, Vidal-Sanz M, Hurtado-Montalban N, Lund RD. Evolving neurovascular relationships in the RCS rat with age. Curr. Eye Res. 2003;27:183–196. doi: 10.1076/ceyr.27.3.183.16053. [DOI] [PubMed] [Google Scholar]
- Yu DY, Cringle SJ, Su EN, Yu PK. Intraretinal oxygen levels before and after photoreceptor loss in the RCS rat. Invest. Ophthalmol. Vis. Sci. 2000;41:3999–4006. [PubMed] [Google Scholar]
- Yu DY, Cringle SJ. Retinal degeneration and local oxygen metabolism. Exp. Eye Res. 2005;80:745–751. doi: 10.1016/j.exer.2005.01.018. [DOI] [PubMed] [Google Scholar]