

Abstract.
We developed a stable, reproducible three-dimensional optical phantom for the evaluation of a wide-field endoscopic molecular imaging system. This phantom mimicked a human esophagus structure with flexibility to demonstrate body movements. At the same time, realistic visual appearance and diffuse spectral reflectance properties of the tissue were simulated by a color matching methodology. A photostable dye-in-polymer technology was applied to represent biomarker probed “hot-spot” locations. Furthermore, fluorescent target quantification of the phantom was demonstrated using a 1.2 mm ultrathin scanning fiber endoscope with concurrent fluorescence-reflectance imaging.
Keywords: phantoms, fluorescence, fluorescence quantification, Barrett’s esophagus, tissue color, molecular imaging, distance compensation, scanning fiber endoscope
1. Introduction
Molecular imaging (also known as immunophotodiagnostic imaging) has drawn increasing interest in the field of diagnostic medicine because of its potential to target disease biomarkers for biopsy and diagnostic purposes.1–4 For example, in gastrointestinal endoscopy, the combination of fluorescence-labeled molecular probes with wide-field multimodal endoscopic devices can provide visualization of detailed biological information at the cellular or subcellular level, holding promise to enhance diagnosis and characterization of early cancer lesions in the GI tract.5–7 In the development of these molecular imaging approaches, it is critical to have realistic, stable and reproducible optical phantoms, to both calibrate endoscope systems and evaluate their performance. Moreover, crucial problems in molecular imaging such as biomarker quantification and mapping of probed disease lesions can be explored in vitro using these realistic phantom models.8,9
One application of molecular endoscopic imaging is the detection of high-grade dysplasia (HGD) and early adenocarcinoma in Barrett’s esophagus.10,11 The mucosa of Barrett’s esophagus has a much greater risk of progression to cancer (30 to 125 times greater than normal esophagus).12 Therefore, surveillance of patients with Barrett’s esophagus is critical for early detection and localization of dysplasia. However, conventional white light endoscopy screening has significant limitations because HGD and early adenocarcinoma lesions usually lie flat on the tissue surface and are endoscopically “invisible” as they do not differ in appearance to the surrounding mucosa.3 Therefore, there is a need for a targeted molecular imaging strategy for early detection and prevention of cancer in patients with Barrett’s esophagus. Furthermore, topical application of targeted fluorescent probes is favored over intravenously administered markers since regulatory limitations are less restrictive for short term exposure to surface contrast agents. Peptide conjugated dyes [e.g., fluorescein isothiocyanate (FITC)] tend to concentrate in the upper mucosal layers and are activated by shorter wavelength () light sources.10,11 A phantom model developed for simulating Barrett’s esophagus, including the molecular probed surface dysplasia, would be of value for the purposes of instrument calibration and diagnostic algorithm development.
Phantoms are often constructed to simulate tissue optical and/or morphological properties for the development of imaging techniques.13 Among these phantom designs, some were employed with multiple materials to construct stable, multilayer tissue phantoms with essential optical properties,14–16 some were fabricated with three-dimensional structures for the purpose of quantitative optical spectroscopy17 and for the application in photodynamic therapy.18 Additionally, work has also been done incorporating fluorescent nanoparticles into optical phantoms to act as quantitative molecular imaging standards.19,20 However, little has been addressed in the field of optical phantoms for the purpose of simulating fluorescent labeling of targeted surface biomarkers in clinical endoscopy,5,6 specifically in the field of quantitative fluorescent molecular video-endoscopy. Therefore there is a need to develop optical phantoms for both research purposes and preclinical instrumentation evaluations, which incorporate the simulation of quantifiable surface molecular biomarkers into a multilayer three-dimensional tissue phantom.
Recent studies have demonstrated three-dimensional tissue phantoms with a quantitative subsurface fluorescence contrast agent,20 subsurface tissue autofluorescence,21 as well as phantoms with quantitative quantum dot-based molecular imaging.19 In these studies, deep tissue optical penetration was discussed since the biomarker was buried at the subsurface level. Here, we introduce a synthetic phantom developed to simulate topically labeled fluorescent biomarkers. Since the biomarker labeling is applied topically to the esophageal tissue,22 the surface reflectance properties are modeled to accurately mimic the disease condition, whereas synthetic tissue transparency and deep tissue optical penetration were less relevant. This phantom was designed for assisting in the validation of a new multispectral fluorescence endoscope for diagnosing high grade dysplasia and neoplasia [in Barrett’s esophagus (BE)].
A paintable elastomeric material (latex) was selected and used to fabricate a three-dimensional model that is flexible enough to mimic the essential body movements such as opening and closing of the lower esophageal sphincter while retaining its basic cylindrical shape. Then, a color matching methodology was developed to simulate the visual appearance and diffuse spectral reflectance properties of the tissue. Paint formulations were created to match the visible color properties for a broad spectral range (400 to 700 nm), and a photostable dye was selected which mimics the properties of an FDA approved fluorescent dye (FITC). The dye was diluted to low concentrations and cast into optically thin, rigid forms, to represent low concentration of biomarker probed disease “hot-spot” locations. The resultant phantom (Fig. 1) is stable, repeatable, economical to fabricate, and has been successfully used to develop image based biomarker labeled quantification techniques.
Fig. 1.
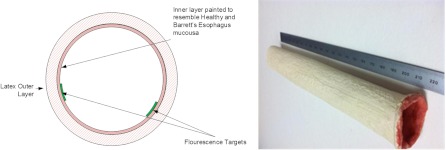
(a) A cross-sectional graph illustrating the phantom design. (b) An overview of the resultant phantom.
2. Materials and Methods
2.1. Phantom Materials
A low-odor, brush-on latex elastomer (RL-451-80, Silpak Inc., Pomona, California) has been chosen as the structural base of the phantom. This latex is a water-ammonia mixture and has been widely used in making theatrical masks.23 Once shaped into a durable, hollow, cylindrical form the flexible tube mimics adult human esophagus morphology while allowing for physiological simulations, such as the opening and closing of the lower esophageal sphincter as well as other body motions.
Healthy and Barrett’s esophagus mucosa layers were simulated through combining acrylic liquid-based paint colors (Golden Artist Colors Inc., New Berlin, New York) and a gel-based matte medium (Golden Artist Colors Inc., New Berlin, New York). The spectral characteristics of each paint color incorporated were established by obtaining the diffuse reflectance values at different dilutions (1:1, 1:3, 1:7, and 1:10) with Titanium White (Golden Artist Colors Inc., New Berlin, New York). After characterization, paints that displayed the correct spectral features were then combined in appropriate proportions to match the target spectrum. To account for the high viscosity of the paint, reverse pipetting was used and no volumes less than 200 μL were used for the creation of the finalized paint recipes. The mixture was then applied in layers onto the inner surface of the latex cylinder by first inverting the cast latex cylinder before painting. After the paint layers were applied, fluorescent dye-in-polymer targets were placed inside the cylinder to mimic biomarker labeled fluorescent hot-spots.
The dye-in-polymer material contained a substituted 1,8-naphthalimide fluorescent dye (Fluorol, Exciton Inc., Dayton, Ohio) that was diluted in a clear two-part polyurethane resin (AquaClear Resin, ArtMolds, Summit, New Jersey). The Fluorol dye is well characterized,24 soluble and stable in polymer resins and its excitation and emission spectral features are close to FITC, an FDA-approved dye. FITC itself was not selected for this study because it lacks long-term photostability, while Fluorol has been used in dye laser research where photostability is required.25
2.2. Phantom Fabrication
The template mold for the latex was a tubular plastic polyvinyl chloride (PVC) mandrel with 2.5 cm outer diameter that matches the diameter of the adult human esophagus. A simple wooden dowel fixture held the PVC tube, about 25 cm long, in a vertical position during application of the latex material. The latex phantom was fabricated by applying multiple layers of latex to the PVC mandrel in order to construct a phantom with dimensions that resemble that of a typical human esophagus, approximately 25 cm in length and 2.5 cm in diameter. A layer of aluminum foil was placed between the PVC mandrel and the first layer of latex; this prevented the latex from adhering to the PVC mandrel and allowed easy separation of the phantom and the mandrel. The first layer was applied in a thin coat to prevent formation of air pockets as recommended by the supplier of the latex material. Hot air () was applied using a hair dryer for approximately 2 min to accelerate the drying process of the first layer. This process of applying thin coats of latex and then drying was repeated until the desired thickness was reached with about 10 accumulated layers, giving a phantom which has wall thickness. The thickness is appropriate for allowing the model to maintain both structural integrity and flexibility.
After storage for 24 h at room temperature, the phantom was then easily removed from the PVC mandrel due to the release property of the aluminum foil layer. The aforementioned paint-gel medium was then brushed onto the inner surface of the latex cylinder in layers, with drying of each layer accelerated using the hair dryer. In this process, the paint formulation simulating healthy esophagus tissue was applied first on the entire inner surface, then the paint layer representing Barrett’s esophagus was applied. Fluorescent targets were attached with transparent adhesive tape to the painted Barrett’s esophagus regions to resemble biomarker labeled HGD and early stages of cancer.
To fabricate the fluorescence targets, a dye-in-polymer material was formed by first dissolving the Fluorol dye powder into part A of the polyurethane resin. Slow stirring and low temperature heating ( to 50°C) were used to dissolve the dye in the resin. Initially a high dye-in-resin concentration () solution was prepared and served as the master batch for further dilution into the final target concentrations in the micromole/L (µmol/L) range. Finally the diluted part A-dye solution was mixed with part B at a 1:1 ratio by volume, as instructed by the polymer manufacturer. Before mixing, the part A solution was cooled to room temperature. The dilution effect of part B was accounted for in computing the final dye concentration in the solid polymer. Air bubbles from the mixing process were rapidly removed by using a centrifuge (Thermo Scientific Sorvall® Legend® RT) operated at 2400 RPM for 2 min at 2°C. The bubble-free liquid dye-in-resin mixture was then poured into 2.5 cm diameter molds. After 24 h curing at room temperature, the rigid dye-in-polymer material was removed from the mold; the solid cylindrical castings were then sliced into thin disks using a Saw Microtome (Leica SP1600, Leica Microsystems, Nussloch, Germany). The thin (0.5 to 1.0 mm) disks were then die-cut into distinctive star shapes, which were then mounted onto the inner surface of the phantom to simulate targeted biomarker hot-spots. The concentration of these simulated fluorescent hot-spots was in the range of 1 to to match the in vivo human topical dye-peptide concentration.26
2.3. Methods
The painted inner layer diffuse reflectance was measured with an Integrating Sphere (ISP-REF, Ocean Optics Inc., Dunedin, Florida) and a spectrometer (, Ocean Optics Inc.).27 A 99% diffuse reflectance Labsphere Spectralon target (SRT-99-020, North Sutton, New Hampshire) was used as the reference standard. Data were analyzed and plotted offline.
The fluorescent dye-in-polymer’s capability as a quantitative standard was tested for validation. The experimental setup is shown schematically in Fig. 2. These targets with concentration ratio of 1:2:3:4 were excited with a 444 nm laser (Blue Sky Research, Milpitas, California) at a fixed distance and angle. The emission spectra were measured using the aforementioned Ocean Optics spectrometer; with a 450 nm longpass filter (NT62-982, Edmund Optics Inc. Barrington, New Jersey) at the spectrometer entrance aperture to attenuate the excitation laser light.27 The emission intensity for each fluorescent target was calculated as the area under the emission curve and then, the dye concentration versus fluorescence intensity relationship was plotted.
Fig. 2.

Schematic diagram of the experimental setup to quantify targets’ fluorescence.
2.4. Imaging Platform
The scanning fiber endoscope (SFE) is an ultrathin and flexible endoscope device developed in our laboratory.28 It provides high-quality live videos and images with wide field-of-view (up to 100-deg). The SFE has been tested in vivo in digestive tracts (esophagus, stomach, and bile duct), as well as other parts of the body such as dental tissue and airways (pig).
In the present study, a 1.2 mm diameter SFE endoscope was used. Briefly, red (635 nm), green (532 nm), and blue (444 nm) lasers can be launched collectively or selectively at the proximal end of the SFE and transmitted to the distal end using a single mode illumination fiber. Diffuse reflected light from the target is collected by a concentric ring of optical fibers surrounding the central scanning fiber and lenses. For the 1.2 mm diameter SFE, 68 high-NA (50 μm diameter) multimode optical fibers were used. Details concerning the SFE imaging system are described elsewhere.28
The ability of the SFE to perform fluorescence quantification was assessed by using the aforementioned calibrated dye-in-polymer targets. Fluorescence images of the targets excited by a 444 nm laser were taken with the SFE at a fixed angle and distance. The fluorescence intensity was calculated by selecting a target region in the resultant images and calculating an average intensity for all pixels enclosed in this target region. The dye-in-polymer concentration versus fluorescence intensity relationship was then plotted and compared to the spectrometer results to verify linearity.
White light reflectance SFE imaging of the phantom was performed and recorded. As illustrated in Fig. 3(a), the standard SFE RGB reflectance imaging system uses blue (444 nm), green (532 nm) and red (635 nm) laser illuminations, and the RGB signals are then simultaneously detected and amplified by three individual photomultiplier tubes (PMTs).
Fig. 3.

(a) Standard SFE RGB imaging; (b) SFE dual mode imaging, with the 532 nm blue photomultiplier tube (PMT) channel inactive.
Concurrent dual-modal imaging [Fig. 3(b)] was achieved by configuring the SFE such that the standard green channel was converted into the fluorescence mode by deactivating the standard green laser so that only fluorescence signals in the green spectrum were recorded. The standard red channel was used for simultaneous reflectance imaging.
3. Results
3.1. Color Matching and Diffuse Reflectance
Initially paint recipes were formulated wherein constituent paint ratios were adjusted so that the resulting diffuse reflectance values (Fig. 6) approached that of the published nondysplastic BE.29,30 As the paint reflectance values approached those of the published spectrum, a disparity emerged between the formulated paint recipes and the widely reported salmon-red color appearance of Barrett’s esophagus.3,31
Fig. 6.

Diffuse spectra reflectance of simulated healthy esophagus and BE tissue from the phantom.
Therefore, color calculations were conducted, based on the 1931 CIE spectral response functions (, , ),32 to quantify the visual appearance of the paint recipes. The color calculation methodology is shown in Fig. 4. We found that the published spectral reflectance of nondysplastic BE tissue corresponded to an off-white color instead of the widely recognized salmon-red BE color. Furthermore, a color calculation was also performed using the spectral reflectivity of salmon fish fillet.33 In addition to the spectral reflectance data, the calculations included the relative spectral intensity of a xenon arc light source (Cermax® Xenon, Excelitas Technologies Corp., Fremont, California) that is widely used in modern endoscopes.34 The results are presented as Fig. 5 and Table 1.
Fig. 4.

A summary diagram of the CIE color calculation methodology. Calculated color coordinates represent the visual appearance of a paint recipe viewed under illumination by the xenon Cermax lamp. Clinically BE is observed with an endoscope that incorporates a color CCD camera. The spectral response of modern endoscopic CCD cameras closely matches the ideal , , and functions. Therefore, the calculated color coordinates correspond reasonably well to the clinically observed color of BE.
Fig. 5.

CIE color calculations of: (a) Ref. 29 BE color, (b) simulated healthy esophagus mucosa color, (c) simulated BE color, and (d) Atlantic salmon fillet color.33
Table 1.
Calculated color coordinates.
In addition, color calculations based on the reflectance data collected from healthy oral mucosa35 were consistent with our visual observation of oral tissue. Therefore, the salmon fillet spectra and oral spectra were selected as the representative baseline spectra for BE and healthy esophageal mucosa, respectively. Paint recipes were then optimized to match these guidelines. In addition, we solicited guidance from a panel of experienced Gastroenterologist clinicians to verify paint colors. The final paint recipes are shown in Table 2, all paints used are from Golden Artist Colors Inc.
Table 2.
Paint recipes of simulated tissue diffuse reflectance and colors.
| Tissue type | Paint ratios (by weight) |
|---|---|
| Healthy esophagus | (Pr:Qm:Hy:Pb:Gg:PgL:TW)(20:10:4:2:1:1:20) |
| Barrett’s esophagus | (Qc:Pr:Gg:PgL:PrL)(16:6:4:3:6) |
Pr = Pyrrole red
Qm = Quinacridone magenta
Hy = Hansa yellow
Pb = Phthalo blue
Gg = Green gold
PgL = Permanent green Light
TW = Titanium White
Qc = Quinacridone crimson
PrL = Pyrqrole red Light
3.2. Fluorol Dye-in-Polymer Target Calibration
The dye-in-polymer targets produced an emission that peaked at 500 nm when excited by a 444 nm SFE laser (Fig 7). The observed emission spectrum matched the published profile of the fluorescent dye in an acrylic plastic.24 Targets were saw cut into 750 µm thick disks and then die-cut into distinctive star shapes (Fig 8) with concentrations at 25, 50, 75, and . Figure 9(a) shows the fluorescence intensity as a function of dye-in-polymer concentration and Fig. 9(b) presents the SFE fluorescence image analysis of the same dye-in-polymer targets. Both sets of data showed a similar linear behavior.
Fig. 7.

Fluorol dye-in-polymer emission spectra under 444 nm laser excitation, measured by a calibrated spectrometer.
Fig. 8.

Photo representations of dye-in-polymer. (a) thin disks, (b) die-cut distinctive star shaped targets.
Fig. 9.
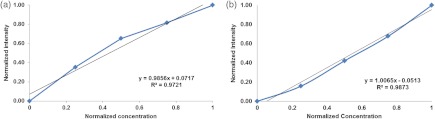
(a) Fluorescent target emission intensity recorded with a spectrometer as a function of dye concentration. (b) Fluorescent target SFE image intensity as a function of dye concentration.
3.3. Phantom Imaging Using the SFE
The SFE probe was centered in the esophagus phantom via an in-house designed apparatus, which mimics an endoscope’s working channel for transporting the SFE probe into the esophagus. White light and dual mode imaging of the lower esophagus phantom were performed with finger pressure to simulate the opening and closing of the artificial lower esophageal sphincter (Figs. 10 and 11).
Fig. 10.

Standard RGB SFE imaging of the phantom. (a) SFE images of the same phantom with with sphincter open (left) and sphincter closed (right). (b) Endoscope images of a human Barrett’s esophagus36 © 2004 by Mayo Foundation for Medical Education and Research.
Fig. 11.

SFE fluorescence and red reflectance dual-modal imaging of the phantom. Dual-modal SFE imaging of the phantom with four fluorescent targets. Left: sphincter open. Right: sphincter closed.
An in vitro SFE image-based fluorescence quantification study was conducted using the realistic esophagus phantom. Quantitative data were obtained by setting fixed gain and offset on the PMTs as well as the digital image formation process through the SFE’s computer user interface. Therefore the pixel intensity of the images corresponded to the fluorescence target concentrations and distance from the SFE scope distal end.
The quantification of fluorescence signal was achieved by using an empirically optimized nonlinear ratio-metric algorithm, to compensate for the distance differences between the fluorescent targets and the endoscope due to the targets’ relative orientation and separations (Fig. 12). This distance compensation (DC) algorithm was applied to the simultaneously acquired and thus coregistered fluorescence (F) and reflectance (R) images. A pixel-by-pixel intensity computation using a nonlinear ratio of the fluorescence and red channel reflectance [] yielded excellent results.
Fig. 12.

Phantom application: the SFE distance compensation (DC) algorithm development. (a) Sphincter open mode; (b) sphincter closed mode; (1-a) before DC SFE dual-mode (reflectance-fluorescence) image; (1-b) before DC colormap of the fluorescence image from (1-a); (2) After DC colormap of the fluorescence image from (1-a).
Before DC, the image intensity ratio of two targets with the same dye concentration yielded different values with average errors for sphincter open mode and for closed mode. However, the average error after correction was and , respectively, resulting in a 91% error reduction for sphincter open mode and 89% for closed mode (Table 3). Statistical analysis (paired student-t test, one-tail, ) compared the before and after correction image intensity errors, and result showed the algorithm significantly () increased accuracy of target quantification on both modes (Table 3).
Table 3.
Comparison of targets quantification before and after distance compensation (DC).
| (a) Sphincter Open Mode | |||||
|---|---|---|---|---|---|
| Location (L) | Expected IR | before DC | IR after DC IR | before DC error | after DC error |
| L1/L2 | 1.000 | 1.685 | 0.858 | 68.5% | 14.2% |
| L1/L3 | 1.000 | 2.305 | 0.943 | 130.5% | 5.7% |
| L1/L4 | 1.000 | 3.042 | 0.915 | 204.2% | 8.5% |
| L1/L3 | 1.000 | 1.368 | 1.099 | 36.8% | 9.9% |
| L1/L4 | 1.000 | 1.806 | 1.066 | 80.6% | 6.6% |
| L1/L4 | 1.000 | 1.319 | 0.970 | 31.9% | 3.0% |
| paired student- test (one-tail) | |||||
| (b) Sphincter Closed Mode | |||||
|---|---|---|---|---|---|
| Location (L) | Expected IR | before DC IR | after DC IR | before DC | error after DC error |
| L1/L2 | 1.000 | 1.227 | 0.998 | 22.7% | 0.2% |
| L1/L3 | 1.000 | 1.510 | 1.087 | 51.0% | 8.7% |
| L1/L4 | 1.000 | 1.764 | 1.035 | 76.4% | 3.5% |
| L2/L3 | 1.000 | 1.231 | 1.089 | 23.1% | 8.9% |
| L2/L4 | 1.000 | 1.438 | 0.998 | 43.8% | 0.2% |
| L3/L4 | 1.000 | 1.169 | 0.952 | 16.9% | 4.8% |
| paired student -test (one-tail) | |||||
IR = intensity ratio;
DC = distance compensation
A custom software user interface was also developed to allow real-time video processing and display of the color-coded map of the distance corrected fluorescence hot-spots with relative quantifications.
4. Discussion
A BE phantom was constructed which matched the primary targeted geometric characteristics of the esophagus, measuring 2.5 cm in width and 22 cm in length. This phantom was firm enough to maintain its structure without extra support while also allowing for mechanical manipulation to simulate body motions such as lower esophageal sphincter open and closure.
White light SFE images of the phantom were recorded with a 1.2 mm diameter SFE scope aligned at the center axis of the phantom looking in the direction of the simulated BE tissue. Under white light, the upper portion of the color-matched phantom presented whitish-pink normal esophagus mucosa and in the lower portion a salmon-reddish BE color. The overall appearance of the phantom exhibited similar physical appearance compared to endoscopic images of a human Barrett’s esophagus [Fig. 10(b)].
The BE diffuse reflectance spectra from the phantom inner surface showed much higher orange-red reflectance compared to the blue-green reflectance. This was similar to the trend observed in the diffuse reflectance spectra feature of Atlantic salmon fillet.33 As shown in the CIE 1931 color chromaticity diagram (Fig. 5), the referenced Atlantic salmon fillet fell into a distinct red region whereas the previously published BE color29 is located at an off-white region. The simulated BE color coordinates were close to the salmon-red color region. At the same time, the simulated normal esophagus color was white-pinkish. We think that the off-white color resulting from the BE reflectance spectra published in Ref. 29 was caused by pressure on the tissue by the probe contact. Recently, the effect of probe contact pressure on in vivo optical spectroscopy of soft liver tissue,37 oral mucosa,38 and mouse thigh muscle39 has been studied and distortions of tissue spectra reflectance have been discussed.
In clinical video endoscopy, the perceived tissue colors, as well as disease-healthy tissue color contrast could serve as important diagnostic indicators.40,41 Therefore, phantoms designed with realistic tissue colors provide platforms to develop practical in vivo color image processing algorithms.41 Recently real-time implementation of color enhancement algorithms for endoscopy have been reported that highlight subtle differences between cancerous and healthy tissues, and endoscopic imaging techniques using tissue color enhancement showed value assisting the detection, diagnosis and treatment of gastrointestinal diseases.42,43 When visualizing fluorescent targets, the realistic tissue color is important for the selection of pseudo color representations of the reflectance image to enhance contrast. Therefore, phantoms designed with realistic tissue colors could contribute to augmenting molecular imaging modalities for early cancer detection and diagnosis.
In dual mode SFE imaging, concurrent red reflectance image and fluorescent targets were readily visible (Figs. 11 and 12). The real-time SFE concurrent fluorescence and reflectance view provides a geometric alignment that is lacking in systems with nonconcurrent fluorescence/reflectance image capture. Moreover, enhanced spectral imaging (ESI, also known as narrow band imaging)40 is an enabled feature in the SFE.28,44 When wavelength specific spectral imaging is needed, for example in BE ablation surveillance45 or observation of tissue vascular network, the ESI can be easily performed. One future modification of the phantom would be the addition of a simulated vascular network for the study of narrow band imaging in BE, or other common esophageal diseases such as esophageal varices.
The DC algorithm was applied to both lower sphincter open and closed modes using a 1.2 mm SFE endoscope. The results showed distance normalization of the perceived intensities (Fig. 12). This compensation significantly improved the accuracy of target fluorescence intensity quantification. According to the quantitative analysis in Table 3, after applying the DC algorithm, the targets’ intensity error for sphincter open and closed modes has been reduced by 91.3% and 88.8%, respectively. The red reflected light was selected because the red wavelengths are less absorbed by hemoglobin and therefore less influenced by changes in vascularity among diseased tissues. In addition, red reflected light is more uniformly scattered by the tissue morphology. Overall, red light provides a more uniform reflectance image of the target geometry than blue/green colors.46 The robustness of this algorithm was also tested for scenarios when the endoscope is not aligned with the esophagus center axis, and results yielded consistent normalized image intensity (data not included).
The present esophagus phantom does not include autofluorescence (AF). Collagen is believed to be primarily responsible for esophageal AF47,3,48 when the wavelength of the excitation light is in the 350 to 370 nm range. However, when the excitation wavelength is longer than 440 nm, results from extensive searching of published collagen excitation-emission matrix (EEM) data21,49–52 indicate that the collagen AF decreases by a factor of to compared to the maximum at 350 to 370 nm excitation. Since the present phantom is intended for molecular imaging studies at wavelengths longer than 440 nm, it was assumed that AF would not be a significant confounding factor. AF could be simulated if necessary by adding collagen material to the paint formulation.
In the current study, the net esophagus diffuse reflection, including surface and shallow subsurface light scattering was simulated. Since the primary interest of this phantom is for simulation of topically applied surface fluorescent labels, deep tissue light optical penetration and scattering47,3,53 were not included. A biomarker that is located on the cell surface is epithelial growth factor receptor (EGFR). However, this EGFR biomarker is overexpressed in only 35% of HGD specimens in Barrett’s esophagus.54 HGD has a high probability of advancing to esophageal adenocarcinoma, which in turn has a low survival rate (ten to fifteen percent).55 Therefore, molecular imaging devices may utilize more than one dye label to improve sensitivity and specificity.56 The phantom model developed in this study can be adapted to include additional fluorescent dye species representing labeling of more than one biomarker. The coincident emission signature from multiple dyes is expected to provide a more accurate disease state diagnosis than a single wavelength marker.57 This coincident emission signature from multispectral molecular probes could be obtained concurrently using the multichannel photodetection feature of the SFE. If the administration of multiple probes is restricted to time sequential applications, image alignment can be realized with an image stitching algorithm.58–60
Embedding computed tomography (CT)/magnetic resonance imaging (MRI) fiducial markers, to allow for multimodality imaging strategies for disease diagnostic and treatment, is another future embodiment of the phantom. For example, the coregistration of optical images with CT/MRI volumetric imaging could enable new optical-to-CT/MRI combined data for pre/post tumor resection surgery comparisons. Magnetic Microspheres (Bangs Laboratories Inc.) are stable and dispersible in the urethane resins or acrylic paints in our phantom, and can be made to contain both magnetic and fluorescent material. Properly functionalized spheres could be dispersed in urethane or acrylic paint resins and included in the phantom fabrication process to allow this bimodal imaging.
In conclusion, we have demonstrated a new color-matched and fluorescence labeled esophagus phantom for clinical wide-field endoscopy applications. The three-dimensional (3-D) structure of the resultant phantom was semi-rigid with enough flexibility to mimic body movements. Also, through a color-matching methodology, the perceived phantom tissue color and diffuse spectral reflectance were reconciled to simulate the clinically observed characteristics of typical human healthy and Barrett’s esophagus. We also demonstrated a dye-in-polymer method to quantitatively simulate surface fluorescence labels. This proposed phantom provides exciting opportunities for assisting in the validation of novel endoscopic imaging systems, such as the wide-field multi-spectral fluorescence SFE, as well as image-based fluorescence quantification, and other image processing algorithm developments.
Acknowledgments
The study was funded by the National Institutes of Health (NCI Grant U54CA163059, PI: T.D. Wang, D. Beer, and E.J. Seibel). We would like to thank the reviewers for their constructive comments and suggestions. We would like to thank Dr. John Inadomi, Dr. Michael Saunders and Ms. Habiba Habib at the University of Washington Digestive Disease Center for helpful suggestions regarding realistic phantom features. The authors appreciate Excelitas Technologies Corp. for providing the Cermax® xenon lamp spectral intensity data. We would also like to acknowledge discussions with Dr. Thomas D. Wang and his research group at the University of Michigan. Finally, we would like to thank Richard Johnson, David Melville and Liang Zhang for their help with experiments and the creative efforts of Shawn Quinault Crane in fabricating the latex phantom.
References
- 1.Elahi S. F., Wang T. D., “Future and advances in endoscopy,” J. Biophoton. 4(7–8), 471–481 (2011). 10.1002/jbio.v4.7/8 [DOI] [PMC free article] [PubMed] [Google Scholar]
- 2.Goetz M., Wang T. D., “Molecular imaging in gastrointestinal endoscopy,” Gastroenterology 138(3), 828–833 (2010). 10.1053/j.gastro.2010.01.009 [DOI] [PMC free article] [PubMed] [Google Scholar]
- 3.Wilson B. C., “Detection and treatment of dysplasia in Barrett’s esophagus: a pivotal challenge in translating biophotonics from bench to bedside,” J. Biomed. Opt. 12(5), 051401 (2007). 10.1117/1.2795688 [DOI] [PubMed] [Google Scholar]
- 4.Lee M. H., et al. , “Advanced endoscopic imaging for Barrett’s esophagus: current options and future directions,” Curr. Gastroenterol. Rep. 14(3), 216–225 (2012). 10.1007/s11894-012-0259-3 [DOI] [PubMed] [Google Scholar]
- 5.Miller S. J., et al. , “Targeted detection of murine colonic dysplasia in vivo with flexible multispectral scanning fiber endoscopy,” J. Biomed. Opt. 17(2), 021–103 (2012). 10.1117/1.JBO.17.2.021103 [DOI] [PMC free article] [PubMed] [Google Scholar]
- 6.Hsiung P.-L., et al. , “Detection of colonic dysplasia in vivo using a targeted heptapeptide and confocal microendoscopy,” Nat. Med. 14(4), 454–458 (2008). 10.1038/nm1692 [DOI] [PMC free article] [PubMed] [Google Scholar]
- 7.Bird-Lieberman E. L., et al. , “Molecular imaging using fluorescent lectins permits rapid endoscopic identification of dysplasia in Barrett’s esophagus,” Nat. Med. 18(2), 315–322 (2012). 10.1038/nm.2616 [DOI] [PubMed] [Google Scholar]
- 8.Upadhyay R., et al. , “Quantitative real-time catheter-based fluorescence molecular imaging in mice,” Radiology 245(2), 523–531 (2007). 10.1148/radiol.2452061613 [DOI] [PubMed] [Google Scholar]
- 9.Choyke P. L., “Science to practice: is it possible to quantify fluorescence during optical endoscopy?,” Radiology 245(2), 307–308 (2007). 10.1148/radiol.2452071020 [DOI] [PubMed] [Google Scholar]
- 10.Li M., Wang T. D., “Targeted endoscopic imaging,” Gastrointest. Endosc. Clin. N. Am. 19(2), 283–298 (2009). 10.1016/j.giec.2009.02.001 [DOI] [PMC free article] [PubMed] [Google Scholar]
- 11.Li M., et al. , “Affinity peptide for targeted detection of dysplasia in Barrett’s esophagus,” Gastroenterology 139(5), 1472–1480 (2010). 10.1053/j.gastro.2010.07.007 [DOI] [PMC free article] [PubMed] [Google Scholar]
- 12.Solaymani-Dodaran M., et al. , “Risk of oesophageal cancer in Barrett’s oesophagus and gastro-oesophageal reflux,” Gut 53(8), 1070–1074 (2004). 10.1136/gut.2003.028076 [DOI] [PMC free article] [PubMed] [Google Scholar]
- 13.Pogue B. W., Patterson M. S., “Review of tissue simulating phantoms for optical spectroscopy, imaging and dosimetry,” J. Biomed. Opt. 11(4), 041102 (2006). 10.1117/1.2335429 [DOI] [PubMed] [Google Scholar]
- 14.Lualdi M., et al. , “A phantom with tissue-like optical properties in the visible and near infrared for use in photomedicine,” Laser. Surg. Med. 28(3), 237–243 (2001). 10.1002/(ISSN)1096-9101 [DOI] [PubMed] [Google Scholar]
- 15.Netz U. J., Toelsner J., Bindig U., “Calibration standards and phantoms for fluorescence optical measurements,” Med. Laser Appl. 26(3), 101–108 (2011). 10.1016/j.mla.2011.05.002 [DOI] [Google Scholar]
- 16.de Bruin D. M., et al. , “Optical phantoms of varying geometry based on thin building blocks with controlled optical properties,” J. Biomed. Opt. 15(2), 025001 (2010). 10.1117/1.3369003 [DOI] [PubMed] [Google Scholar]
- 17.Nguyen T. T., et al. , “Three-dimensional phantoms for curvature correction in spatial frequency domain imaging,” Biomed. Opt. Express 3(6), 1200–1214 (2012). 10.1364/BOE.3.001200 [DOI] [PMC free article] [PubMed] [Google Scholar]
- 18.Bays R., et al. , “Three-dimensional optical phantom and its application in photodynamic therapy,” Laser. Surg. Med. 21(3), 227–234 (1997). 10.1002/(ISSN)1096-9101 [DOI] [PubMed] [Google Scholar]
- 19.Kang H., et al. , “Multimodal optical studies of single and clustered colloidal quantum dots for the longterm optical property evaluation of quantum dot-based molecular imaging phantoms,” Biomed. Opt. Express 3(6), 1312–1325 (2012). 10.1364/BOE.3.001312 [DOI] [PMC free article] [PubMed] [Google Scholar]
- 20.Roy M., et al. , “Homogenized tissue phantoms for quantitative evaluation of subsurface fluorescence contrast,” J. Biomed. Opt. 16(1), 016013 (2011). 10.1117/1.3528646 [DOI] [PubMed] [Google Scholar]
- 21.Sokolov K., et al. , “Realistic three-dimensional epithelial tissue phantoms for biomedical optics,” J. Biomed. Opt. 7(1), 148–156 (2002). 10.1117/1.1427052 [DOI] [PubMed] [Google Scholar]
- 22.Joshi B. P., Wang T. D., “Exogenous molecular probes for targeted imaging in cancer: focus on multi-modal imaging,” Cancers 2(2), 1251–1287 (2010). 10.3390/cancers2021251 [DOI] [PMC free article] [PubMed] [Google Scholar]
- 23.www.silpak.com (accessed on January 2013).
- 24.Lesiecki M. L., Drake J. M., “Use of the thermal lens technique to measure the luminescent quantum yields of dyes in PMMA for luminescent solar concentrators,” Appl. Opt., 21(3), 557–560 (1982). 10.1364/AO.21.000557 [DOI] [PubMed] [Google Scholar]
- 25.Lambropoulos M., “Fluorpl 7GA: an efficient yellow-green dye for flashlamp-pumped lasers,” Opt. Commun. 15(1), 35–37, (1975). 10.1016/0030-4018(75)90177-7 [DOI] [Google Scholar]
- 26.Wang T. D., University of Michigan, Ann Arbor, Mich., Private Conversation (2012).
- 27.Zhang L., Nelson L. Y., Seibel E. J., “Red-shifted fluorescence of sound dental hard tissue,” J. Biomed. Opt. 16(7), 071411 (2011). 10.1117/1.3606572 [DOI] [PubMed] [Google Scholar]
- 28.Lee C. M., et al. , “Scanning fiber endoscopy with highly flexible, 1 mm catheterscopes for wide-field, full-color imaging,” J. Biophoton. 3(5–6) 385–407 (2010). 10.1002/jbio.v3:5/6 [DOI] [PMC free article] [PubMed] [Google Scholar]
- 29.Georgakoudi I., et al. , “Fluorescence, reflectance, and light-scattering spectroscopy for evaluating dysplasia in patients with Barrett’s esophagus,” Gastroenterology 120(7), 1620–1629 (2001). 10.1053/gast.2001.24842 [DOI] [PubMed] [Google Scholar]
- 30.Georgakoudi I., “The color of cancer,” J. Lumin. 119–120, 75–83 (2006). 10.1016/j.jlumin.2005.12.015 [DOI] [Google Scholar]
- 31.Rajendra S., Sharma P., “Barrett’s esophagus and cancer risk: a more realistic estimate,” Semin. Thorac. Cardiovasc. Surg. 23(4), 261–262 (2011). 10.1053/j.semtcvs.2012.01.003 [DOI] [PubMed] [Google Scholar]
- 32.Berns R. S., Billmeyer and Saltzman’s Principles of Color Technology, 3rd ed., pp. 50–51, Wiley, Hoboken, NJ: (2000). [Google Scholar]
- 33.Ottestad S., et al. , “Effects of storage atmosphere and heme state on the color and visible reflectance spectra of salmon (Salmo salar) fillets,” J. Agric. Food Chem. 59(14), 7825–7831 (2011). 10.1021/jf201150x [DOI] [PubMed] [Google Scholar]
- 34.Excelitas Cermax Xenon Lamps http://www.excelitas.com/Downloads/Cermax_Eng_Guide.pdf (January 2013).
- 35.de Veld D. C., et al. , “Autofluorescence and diffuse reflectance spectroscopy for oral oncology,” Lasers Surg. Med. 36(5), 356–364 (2005). 10.1002/(ISSN)1096-9101 [DOI] [PubMed] [Google Scholar]
- 36.American College of Gastroenterology, “Barrets esophagus,” http://patients.gi.org/topics/barretts-esophagus/ (accessed January 2013).
- 37.Ti Y., Lin W.-C., “Effects of probe contact pressure on in vivo optical spectroscopy,” Opt. Express 16(6), 4250–4262 (2008). 10.1364/OE.16.004250 [DOI] [PubMed] [Google Scholar]
- 38.Ruderman S., et al. , “Analysis of pressure, angle and temporal effects on tissue optical properties from polarizationgated spectroscopic probe measurements,” Biomed. Opt. Express 1(2), 489–499 (2010). 10.1364/BOE.1.000489 [DOI] [PMC free article] [PubMed] [Google Scholar]
- 39.Reif R., et al. , “Analysis of changes in reflectance measurements on biological tissues subjeced to different probe pressures,” J. Biomed. Opt. 13(1), 010502 (2008). 10.1117/1.2870115 [DOI] [PubMed] [Google Scholar]
- 40.Gono K., et al. , “Appearance of enhanced tissue features in narrow-band endoscopic imaging,” J. Biomed. Opt. 9(3), 568–577 (2004). 10.1117/1.1695563 [DOI] [PubMed] [Google Scholar]
- 41.Li B., Meng M. Q.-H., “Computer-based detection of bleeding and ulcer in wireless capsule endoscopy images by chromaticity moments,” Comput. Biol. Med. 39(2), 141–147 (2009). 10.1016/j.compbiomed.2008.11.007 [DOI] [PubMed] [Google Scholar]
- 42.Kodashima S., Fujishiro M., “Novel image-enhanced endoscopy with i-scan technology,” World J. Gastroenterol. 16(9), 1043–1049 (2010). 10.3748/wjg.v16.i9.1043 [DOI] [PMC free article] [PubMed] [Google Scholar]
- 43.Lee C. K., Lee S.-H., Hwangbo Y., “Narrow-band imaging versus i-scan for the real-time histological prediction of diminutive colonic polyps: a prospective comparative study by using the simple unified endoscopic classification,” Gastrointest. Endosc. 74(3), 603–609 (2011). 10.1016/j.gie.2011.04.049 [DOI] [PubMed] [Google Scholar]
- 44.Seibel E. J., Brentnall T. A., Dominitz J. A., “New endoscopic and cytologic tools for cancer surveillance in the digestive tract,” Gastrointest. Endosc. Clin. N. Am. 19(2), 299–307 (2009). 10.1016/j.giec.2009.02.002 [DOI] [PMC free article] [PubMed] [Google Scholar]
- 45.Herrero L. A., Weusten B. L., Bergman J. J., “Autofluorescence and narrow band imaging in Barrett’s esophagus,” Gastroenterol. Clin. N. Am. 39(4), 747–758 (2010). 10.1016/j.gtc.2010.08.021 [DOI] [PubMed] [Google Scholar]
- 46.Edell E., et al. , “Detection and localization of intraepithelial neoplasia and invasive carcinoma using fluorescence-reflectance bronchoscopy: an international, multicenter clinical trial,” J. Thorac. Oncol. 4(1), 49–54 (2009). 10.1097/JTO.0b013e3181914506 [DOI] [PMC free article] [PubMed] [Google Scholar]
- 47.Kara M., et al. , “Autofluorescence-based detection of early neoplasia in patients with Barrett’s esophagus,” Digest. Dis. 22, 134–141 (2004). 10.1159/000080312 [DOI] [PubMed] [Google Scholar]
- 48.Lin B., et al. , “Characterizing the origin of autofluorescence in human esophageal epithelium under ultraviolet excitation,” Opt. Express 18(20), 21074–21082 (2010). 10.1364/OE.18.021074 [DOI] [PubMed] [Google Scholar]
- 49.Kirkpatrick N. D., et al. , “In vitro model for endogenous optical signatures of collagen,” J. Biomed. Opt. 11(5), 054021 (2006). 10.1117/1.2360516 [DOI] [PubMed] [Google Scholar]
- 50.DaCosta R. S., Andersson H., Wilson B. C., “Molecular fluorescence excitation–emission matrices relevant to tissue spectroscopy,” Photochem. Photobiol. 78(4), 384–392 (2003). [DOI] [PubMed] [Google Scholar]
- 51.Coghlan L., et al. , “Optimal fluorescence excitation wavelengths for detection of squamous intra-epithelial neoplasia: results from an animal model,” Opt. Express 7(12), 436–446 (2000). 10.1364/OE.7.000436 [DOI] [PubMed] [Google Scholar]
- 52.Zheng W., et al. , “Optimal excitation-emission wavelengths for autofluorescence diagnosis of bladder tumors,” Int. J. Cancer 104(4), 477–481 (2003). 10.1002/(ISSN)1097-0215 [DOI] [PubMed] [Google Scholar]
- 53.DaCosta R. S., Wilson B. C., Marcon N. E., “Spectroscopy and fluorescence in esophageal diseases,” Best Pract. Res. Cl. Gas. 20(1), 41–57 (2006). 10.1016/j.bpg.2005.08.003 [DOI] [PubMed] [Google Scholar]
- 54.Cronin J., et al. , “Epidermal growth factor receptor (EGFR) is overexpressed in high-grade dysplasia and adenocarcinoma of the esophagus and may represent a biomarker of histological progression in Barrett’s esophagus (BE),” Am. J. Gastroenterol..106, 46–56 (2011). 10.1038/ajg.2010.433 [DOI] [PubMed] [Google Scholar]
- 55.Wang K. L., et al. , “Expression of epidermal growth factor receptor in esophageal and esophagogastric junction adenocarcinomas association with poor outcome,” Cancer 109(4), 658–667 (2007). 10.1002/cncr.v109:4 [DOI] [PubMed] [Google Scholar]
- 56.Yentz S., Wang T. D., “Molecular imaging for guiding oncologic prognosis and therapy in esophageal adenocarcinoma,” Hosp. Pract. (Minneap.) 39(2), 97–106 (2011). 10.3810/hp.2011.04.399 [DOI] [PMC free article] [PubMed] [Google Scholar]
- 57.Reid B. J., et al. , “Predictors of progression to cancer in Barrett’s esophagus: baseline histology and flow cytometry identify low- and high-risk patient subsets,” Am. J. Gastroenterol. 95, 1669–1676 (2000). [DOI] [PMC free article] [PubMed] [Google Scholar]
- 58.Seibel E. J., et al. , “Tethered capsule endoscopy, a low-cost and high-performance alternative technology for the screening of esophageal cancer,” IEEE Trans. Biomed. Eng. 55(3), 1032–1042 (2008). 10.1109/TBME.2008.915680 [DOI] [PubMed] [Google Scholar]
- 59.Szeliski R., “Image alignment and stitching: a tutorial,” Found. Trends Comp. Graph. Vis. 2(1) 1–104, (2006). [Google Scholar]
- 60.Soper T. D., Porter M. P., Seibel E. J., “Surface mosaics of the bladder reconstructed from endoscopic video for automated surveillance,” IEEE Trans. Biomed. Eng. 59(6) 1670–1680, (2012). 10.1109/TBME.2012.2191783 [DOI] [PubMed] [Google Scholar]