

Summary
Cajal-Retzius (CR) cells play a fundamental role in the development of the mammalian cerebral cortex. They control the formation of cortical layers by regulating the migration of pyramidal cells through the release of Reelin. The function of CR cells critically depends on their regular distribution throughout the surface of the cortex, but little is known about the events controlling this phenomenon. Using time-lapse video microscopy in vivo and in vitro, we found that movement of CR cells is regulated by repulsive interactions, which leads to their random dispersion throughout the cortical surface. Mathematical modeling reveals that contact repulsion is both necessary and sufficient for this process, which demonstrates that complex neuronal assemblies may emerge during development through stochastic events. At the molecular level, we found that contact repulsion is mediated by Eph/ephrin interactions. Our observations reveal a novel mechanism that controls the even distribution of neurons in the developing brain.
The cerebral cortex is organized along two main axes: tangential and radial. The tangential axis segregates neurons into discrete functional areas that process particular aspects of sensation, movement, and cognition. The radial axis divides the cortex into distinct layers of neurons with unique patterns of connectivity (Rakic, 1988). Layering of the cortex requires the function of Cajal-Retzius (CR) cells, a transient population of early-born glutamatergic neurons that occupy the entire surface of the cerebral cortex from early stages of corticogenesis (Soriano and Del Rio, 2005). Countless studies over the past few decades have provided a comprehensive view on the role of CR cells in the organization of the cortex (Forster et al., 2006; Tissir and Goffinet, 2003). In contrast, our knowledge of the mechanisms that govern the positioning of CR cells remains incomplete.
CR cells cover the entire cortical surface before the emergence of the cortical plate, where newborn pyramidal cells form cortical layers. Perhaps influenced by this observation, CR cells have been classically thought to derive from progenitor cells throughout the pallial ventricular zone, the origin of pyramidal cells (Hevner et al., 2003; Marín-Padilla, 1998; Meyer et al., 1999). However, recent studies have shown that CR cells are born in discrete regions of the pallium, from which they migrate tangentially to colonize the entire cortex (Bielle et al., 2005; Meyer et al., 2002; Takiguchi-Hayashi et al., 2004). Three distinct pallial regions have been suggested to generate CR cells: the cortical hem in the caudomedial wall of the telencephalic vesicles, the pallial septum (PS), and the ventral pallium (VP) (Bielle et al., 2005; Meyer et al., 2002; Takiguchi-Hayashi et al., 2004). CR cells from each of these origins differ in the onset of appearance, migration routes and expression of molecular markers, as well as in the region of the cortical surface that they preferentially colonize. This has led to the suggestion that, in addition to their role in cortical lamination, CR cells may also contribute to patterning the cortex along its tangential axis (Griveau et al., 2010).
These findings raise fundamental questions regarding the mechanisms that control the final distribution of CR cells. How do CR cells manage to distribute regularly over the surface of the cortex? Do different types of CR cells use similar mechanisms? It has been shown that CR cells do not spread out in all directions when transplanted into the cortex, which suggests that elements intrinsic to the marginal zone restrict their movement (Ceci et al., 2010). In addition, previous studies indicate that signals from the meninges enhance the motility of CR cells and contribute to confine their migration along the cortical surface (Borrell and Marín, 2006; Paredes et al., 2006). However, these signals do not seem to convey directionality to the migration of CR cells, as they tend to respond equally to cues present in different regions of the meninges overlaying the cortex (Borrell and Marín, 2006). Thus, CR cells do not seem to adopt their final destination in the cortex by relying on classical mechanisms of guidance, such as those described for example for the development of topographic maps (Feldheim and O’Leary, 2010; Suetterlin et al., 2012).
Here we have investigated the cellular and molecular mechanisms underlying the dispersion and final distribution of CR cells. Using in vivo and in vitro time-lapse imaging, we found that CR cells depend on repetitive, random cell-cell repulsive interactions to distribute throughout the surface of the cortex. Mathematical modeling this migration demonstrates that stochastic contact repulsion between CR cells is necessary and sufficient for the efficient coverage of the cortex by CR cells, and may also participate in the formation of dynamically stable boundaries between different cortical territories primarily colonize by distinct classes of CR cells. At the molecular level, we observed that Eph/ephrin molecules from both A and B families mediate repulsive interactions between CR cells. Our observations reveal a novel mechanism that controls the even distribution of neurons in the developing brain, which relies on stochastic cell-cell interactions rather than on classical guidance mechanisms.
Results
Migrating CR cells undergo contact repulsion
Consistent with the view that CR cells are born in discrete progenitor domains within the pallium (Figure 1A) (Bielle et al., 2005; Meyer et al., 2002; Takiguchi-Hayashi et al., 2004), we observed that CR cells (identified by the expression of Reelin mRNA) do not appear simultaneously throughout the embryonic pallium (Figure 1B). By embryonic day (E) 12, however, CR cells have colonized the entire cortical surface (Figure 1B). To gain insight into the dynamic behavior of migrating CR cells, we imaged the surface of the cortex in living embryos in which CR cells can be specifically visualized by their expression of green fluorescent protein (GFP) using Calretinin-Cre (Taniguchi et al., 2011) and a general reporter allele, RCE (Sousa et al., 2009). It is worth noting that Calretinin is also expressed by interneurons, but the large majority of GFP expressing cells in the cortex of these embryos are not GABAergic interneurons at early stages of cortical development (97%, n = 738 cells from 5 different brains).
Figure 1. Migrating CR cells undergo contact repulsion.

(A) Schematic diagram of the distribution of CR cells from different origins in the embryonic cortex at E12.5, adapted from Bielle et al. (2005).
(B) Whole-mount telencephalic hemispheres showing the expression of Reelin mRNA.
(C) High resolution time-lapse sequence of two migrating CR cells in a flat whole-mount preparation of the E12.5 cortex. The arrow points to a contact between both cells.
(D) Low magnification time-lapse sequence of CR cells migrating away from an E12.5 cortical hem explant.
(E) Tracks of migrating CR cells and OB interneurons in culture.
(F) Directionality indexes for CR cells = 0.3696 ± 0.0184 (n = 93 cells from 6 different experiments) and olfactory bulb interneurons = 0.6681 ± 0.0366 (n = 57 cells from 3 different experiments), Mann-Whitney test: ***p ≤ 0.001.
(G and I) High-resolution time-lapse images of the collision between CR cells (pseudocolored) from the same (G) or different origins (I). CR cells derived from the pallial septum (PS) are marked with a gray dot.
(H and J) Velocity vectors for CR cells contacts in vitro, with cells from the same (H) or different (J) origin. The black arrow indicates the initial velocity vector. The angle of collision and the velocity vectors were calculated after initial trajectory alignment. Each gray arrow represents one cell.
d, dorsal; NCx, neocortex; PS, pallial septum; r, rostral; Th, thalamus; VP, ventral pallium.
Scale bars equal 200 μm (B), 25 μm (C), 400 μm (D) and 50 μm (G and I).
Real-time video microscopy revealed that CR cells have a highly dynamic and branched leading process in vivo (Figure S1, Movie S1), a feature common to many tangentially migrating neurons (Martini et al., 2009). CR cells seemed to follow very divergent trajectories even within a relatively small area of the cortex (Figure S1), which suggest a pattern of migration more complex than previously anticipated. We also noticed that migrating CR cells change direction very frequently (Figure S1, Movie S1), sometimes upon encountering another CR cell. Because the spatial resolution of these in vivo experiments is limited, we analyzed this process in more detail by imaging flat whole-mount preparations of the embryonic cortex in culture. In these experiments, we transplanted the cortical hem of GFP-expressing embryos into wild type cortices, and monitored the movement of CR cells through the cortical surface. We observed that CR cells retract their leading process and change their direction of migration when contacting other CR cells (cells changing direction upon contact: 74.32 ± 3.54%; mean ± SEM; n = 60 cells from 4 different experiments; Figure 1C, Movie S2).
The previous experiments suggested that interactions among CR cells might influence their migratory behavior. To directly test this idea, we cultured explants from the cortical hem – the origin of most CR cells – and monitored the migratory patterns of CR cells emerging from them. We observed that CR cells disperse very efficiently in vitro (Figure 1D). Interestingly, time-lapse analysis of these experiments revealed that CR cells migrate following non-linear, unpredictable trajectories (Figures 1E and 1F, Movie S3). Detailed imaging of individual cells shed light on the mechanism underlying this behavior: every time that the growth cone of a CR cell came into contact with another CR cell, its leading process collapsed, the direction of its migration changed, and its speed increased (cells changing direction upon contact: 100 ± 0%; mean ± SEM; n = 80 cells from 4 different experiments; Figures 1G and 1H; Movies S4). This behavior was not caused by culture conditions, because parallel experiments revealed that olfactory bulb interneurons migrate following quasi-linear trajectories under the same circumstances (compare Movies S4 and S5), and therefore have a much higher directionality index (i.e. the net displacement to path length ratio; Figure 1F) (Lois et al., 1996). In addition, we observed that contact repulsion was common to CR cells from different sources and at different developmental stages (Hem E11.5 - Cells changing direction upon contact: 100 ± 0%; mean ± SEM; n = 30 cells from 3 different experiments. Septum E11.5 - Cells changing direction upon contact: 100 ± 0%; mean ± SEM; n = 30 cells from 3 different experiments. Movies S6 and S7). Altogether, these observations indicated that contact repulsion influences the migration of CR cells and therefore may contribute to regulate their final distribution in the cortex.
Modeling CR cell migration and distribution
We noticed that CR cells also undergo sudden changes in direction even in the absence of cell-cell contacts (Figure 2A, Movie S8). These direction changes, however, were far less pronounced than after contact repulsion (Figures 2B–2D). Moreover, random wandering was relatively rare, because the density of CR cells in culture favored their interaction. To estimate the contribution of random walking to the final distribution of CR cells, we generated a mathematical model of CR cell movements based on our experimental observations. Using this stochastic, individual-based model, we first tested whether contact repulsion or random movement alone are equally efficient to promote the dispersion of CR cells. On an individual level, we assumed that each cell is a random walker, which may or may not be repelled by other cells upon contact. We found that cells undergoing contact repulsion are much more efficient than random walkers in occupying the same area per unit time (Figures 3A, 3B, 3F and 3G, Movie S9). In addition, the minimum distance between any point in the field and the closest cell was doubled for random walkers than for cells undergoing contact repulsion (Figure 3C). These distances are much more variable in the absence of contact repulsion (Figure 3D), which indicates that this mechanism enhances the regular distribution of cells. Consistently, the minimum distance between cells is much smaller for random walkers alone than for cells undergoing contact repulsion (Figure 3E). We also estimated the Voronoi domain regularity index, a useful measure of cellular territories that is relatively insensitive to cell density differences (Galli-Resta et al., 1997). We found that the regularity index is significantly lower in random walkers (Figure 3H), which it is consistent with the idea that contact repulsion optimizes cortical coverage. Finally, we repeated these experiments using a much longer time scale (5000 versus 1000 frames). We observed that contact repulsion stabilizes the regular distribution of migrating cells much more rapidly than random movement alone (Figure 3I). Altogether, these in silico experiments reinforced the view that contact repulsion during migration is essential for the even dispersion and final distribution of CR cells in the cerebral cortex.
Figure 2. Random walking of CR cells during migration.
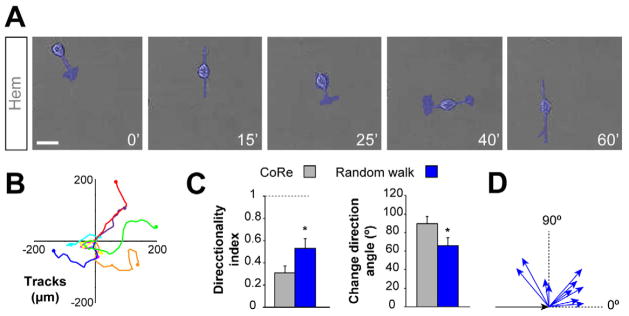
(A) Time-lapse sequence of the random walk behavior of an isolated CR cell in culture.
(B) Tracks of isolated CR cells undergoing random walking during migration in culture.
(C) Comparison of the directionality index and average turning angle between CR cells undergoing CoRe (gray) and random walking CR cells (blue). Directionality index for CR cells undergoing CoRe (gray) = 0.3080 ± 0.0627 and for random walking CR cells = 0.5296 ± 0.0929 (n = 9). Average turning angle for CR cells undergoing CoRe (gray) = 89.5220 ± 7.9513° and for CR cells undergoing random walking = 65.9046 ± 8.4255° (n = 19 cells from 4 different experiments). t-test, *p ≤ 0.05.
(D) Velocity vectors for random walking of CR cells. The black arrow indicates the initial velocity vector. Turning angles and velocity vectors were calculated after initial trajectory alignment. Each arrow represents the value of one cell.
Scale bar equals 25 μm.
Figure 3. Modeling CR cell migration.

(A and F) Cell distribution profiles obtained through mathematical simulation of cells migrating with (A) or without (F) contact repulsion (CoRe). Cells in both simulations undergo random walking and are present in equal numbers.
(B and G) Graphical representation of minimum distances or coverage indexes for the two distributions shown in (A) and (F), respectively.
(C to E and H) Normalized quantification of the coverage or average minimum distance between any pixel in the field and the closest cell, mD = 1.8953 ± 0.045 pixels (C), the average difference between the minimum distance between any pixel in the field and the closest cells, std = 2.3616 ± 0.0928 (D), the average minimum distance between any two cells in the field, mDc = 0.5505 ± 0.0088 pixels (E), and the regularity index, RI = 0.8164 ± 0.0169 (H). Values are expressed as relative to measurements in experiments with contact repulsion. n = 25, t-test: ***p ≤ 0.001.
(I) Temporal evolution of the coverage or minimum distances among cells migrating with (gray traces) or without (red traces) contact repulsion. Light colors represent individual simulations; dark traces are the average of 25 different experiments. The dotted line at 1000 frames indicates the time represented in (A to H), when the distribution of migrating cells undergoing contact repulsion stabilizes.
(J and N) Cell distributions obtained through mathematical simulation of two populations of cells (red and blue) migrating with (J) and without (N) contact repulsion. Cells in both simulations undergo random walking and are present in equal numbers.
(K and O) Graphical representation of population overlapping for distributions shown in (J) and (N), respectively. Dark colors indicate areas populated by one of the cell populations; light colors indicate a high degree of overlap between the two cell populations or low cell density.
(L and P) Graphical representation of cell overlap between the two cell populations. Light colors represent individual simulations; dark traces are the average of 25 different experiments.
(M) Quantification of the segregation index, SI = 0.3897 ± 0.0088 for the two populations of cells in both experimental conditions. Values are expressed as relative to measurements in experiments with contact repulsion. n = 25, t-test: ***p ≤ 0.001.
(Q) Temporal evolution of the segregation index between two cell populations migrating with (gray traces) or without (red traces). Light colors represent individual simulations; dark traces are the average of 25 different experiments.
Contact repulsion between CR cells from different sources
Our experiments showed that CR cells derived from the cortical hem undergo contact repulsion, and mathematical modeling of this behavior revealed that this mechanism is very efficient to distribute these cells throughout the cortex. Since CR cells have several different origins (Bielle et al., 2005), we next asked whether this mechanism would apply to heterotypic interactions between different classes of CR cells. To test this hypothesis, we carried out cultures combining explants from the cortical hem with others obtained from the VP or PS of mice in which CR cells were labeled with GFP. We observed that CR cells from all three different sources experience contact repulsion when touching CR cells from the same origin (not shown). More importantly, we also found that CR cells from different origins undergo contact repulsion (Figures 1I and 1J, Movie S10). These results indicated that contact repulsion operates as a general mechanism that governs the tangential migration of CR cells throughout the cortex.
The previous observations raised an important question regarding the final distribution of different classes of CR cells. If contact repulsion facilitate the regular distribution of CR cells from different origins, then it is conceivable that this mechanism contributes to the formation of stable boundaries between territories containing largely different CR cells (Figure 1A), as observed in vivo (Bielle et al., 2005; Griveau et al., 2010). To test this idea, we performed additional in silico experiments combining two different sources of CR cells. We found that contact repulsion is a very effective mechanism to stabilize territories largely populated by different classes of CR cells (Figures 3J–3L, 3N–3P, Movies S11). For example, the segregation index of two populations of CR cells undergoing contact repulsion is almost three times larger than the value found for cells exhibiting random migration (Figure 3M). Furthermore, we noticed that boundaries between different territories become stabilized very quickly through contact repulsion, while this does not occur when cells only undergo random migration (Figure 3Q). These observations suggested that contact repulsion not only contribute to optimize the distribution of CR cells, but also to maintain dynamically stable boundaries between territories occupied by different classes of CR cells.
CR cells express multiple Eph and ephrin molecules
Eph receptor tyrosine kinases and ephrin proteins are transmembrane or membrane-bound molecules that mediate repulsion of migrating cells and axons following cell-cell contact (Wilkinson, 2001). The similarity of this mechanism to our previous observations prompted us to investigate the role of Eph/ephrin signaling in the migration of CR cells. Eph receptors and ephrins together comprise more than twenty proteins organized in A and B subclasses. EphA receptors bind primarily to A-type ephrins, and EphB bind to B-type ephrins, but there are exceptions to this rule (Pasquale, 2005). Eph-ephrin binding typically leads to signaling in the Eph-bearing cell, but binding has also been shown to elicit signals in the ephrin-bearing cell, or even in both cells through a process known as bidirectional signaling (Cowan and Henkemeyer, 2002; Egea and Klein, 2007). We found that during the period of CR migration (E10.5 to E12.5), several Eph receptors and ephrins of the A and B subclasses are expressed in the marginal zone of the cortex, through which CR cells move (Figure S2). Analysis of individual cells derived from hem explants confirmed that CR cells express many of the genes encoding Eph and ephrins from both subclasses (Figure 4A and data not shown). To verify that migrating CR cells display Eph and ephrins in their surface, we incubated live hem explants with soluble Fc-tagged Eph or ephrin ectodomains at 37°C for 5 min and immediately detected Fc fragments by immunohistochemistry at 4°C to prevent receptor internalization. Using this approach, we unequivocally detected expression of endogenous Eph receptors and ephrins from both A and B subclasses in the membrane of migrating CR cells (Figure 4B). Altogether, these results revealed that migrating CR cells express a complex combination of Eph and ephrin molecules (Figure 4C).
Figure 4. Migrating CR cells express multiple Eph receptors and ephrins.

(A) Expression of EphA3, EphA6, EphB1, EphB2, EphB3, EfnA5, EfnB2 and EfnB3 mRNA in individual hem-derived CR cells in culture, identified by the expression of Calretinin. Arrows point to examples of double labeled cells.
(B) Distribution of EphA, EphB, ephrinA and ephrinB molecules in the membrane of CR cells in culture revealed by selective binding of EfnA1-, EfnB1-, EphA3- and EphB2-Fc compounds, respectively. Fc fragments alone were used as a negative control of the experiment. CR cells were obtained from the hem of E12.5 ubiquitously expressing GFP embryos. Arrows and arrowheads respectively point to the location of Fc complexes in the leading process and soma of CR cells. CR cells did not stain with control Fc fragments, but consistently stained with each of the Efn- or Eph-Fc fragments (100% stained cells in each case; n = 50 cells per condition).
(C) Summary of the expression profile of Eph receptors and ephrins in hem-derived CR cells at E12.5. (+) expressed; (−) not expressed; (?) probably expressed, unconfirmed at the cellular level; (na) not assessed.
Scale bars equal 25 μm (A) and 50 μm (B).
Eph/ephrin signaling regulates the interaction between CR cells
To test whether Eph/ephrin signaling mediates contact repulsion by CR cells, we developed a novel assay in which we confronted two hem explants in culture (Figure 5A). Under these conditions, migration in the distal side of the explants should be much more efficient than in the proximal side, because contact repulsion severely restricts migration in the latter direction. We reasoned that experimentally blocking contact repulsion should balance migration in both directions, leading to a relatively isotropic spread of cells around the explants. Consistent with this idea, we observed that addition of control Fc fragments to hem explant co-cultures leads to a clear bias of migration toward the distal sides (Figures 5B and 5C). In contrast, we found that inhibition of Eph/ephrin signaling with soluble Fc Eph and/or ephrin ectodomain fragments equalizes migration in both directions (Figures 5B and 5C). This effect was particularly prominent when both A and B subclasses of ephrins were simultaneously blocked (Figures 5B and 5C), but it was also observed when only one class of proteins was inhibited (Figure 5D). These results revealed that members of the two families of Eph and ephrins are likely mediators of contact repulsion by CR cells.
Figure 5. Eph/ephrin signaling mediates contact repulsion between CR cells.

(A) Schematic of the experimental paradigm. P and D are the proximal and distal sides of the explant, respectively.
(B) Dispersion of GFP-expressing hem-derived cells (green) confronted with a second, non-GFP labeled hem explant. CR cells from both explants express Calretinin (red). The aligned arrowheads indicate the intermediate distance between the two explants. The proximal dispersion of migrating cells is sharply reduced in controls, but not when Eph/ephrin signaling is blocked.
(C) Quantification of P/D ratio and mean distance migrated by CR cells in the proximal and distal part of the explant. Fc control P/D ratio = 0.6848 ± 0.0659; EphA3/B2-Fc P/D ratio = 1.1292 ± 0.0816, t-test: ***p < 0.001. Mean distance migrated in Fc controls in the proximal part, 563.6833 ± 33.0361 μm; mean distance migrated in EphA3/B2-Fc experiments in the proximal part, 724.3364 ± 35.2412 μm; t-test: **p < 0.01. Mean distance migrated in Fc controls in the distal part, 867.9417 ± 54.8907 μm; mean distance migrated in EphA3/B2-Fc experiments in the distal part, 693.3545 ± 45.9462 μm; t-test: *p < 0.05. We quantified the 30 furthest cells in the proximal and distal regions for 12 control explants and 11 EphA3/B2-Fc treated explants (t-test, *p ≤ 0.05, **p ≤0.01, ***p ≤ 0.001).
(D) Quantification of P/D ratios for explants treated with control Fc fragments = 0.6497 ± 0.0953 and EfnA1-Fc = 1.0245 ± 0.0753 (n = 13 explants); control Fc fragments = 0.7826 ± 0.0667 and EfnB1-Fc = 0.9774 ± 0.0568 (n = 19 explants); Fc fragments = 0.7122 ± 0.055 and EphA3-Fc = 0.9236 ± 0.0569 (n = 17 explants); Fc fragments = 0.7662 ± 0.0512 and EphB2-Fc = 0.9920± 0.0790 (n = 17 explants); t-test: *p ≤ 0.05, **p ≤ 0.01.
Scale bar equals 400 μm (B)
To verify that inhibition of Eph/ephrin signaling prevents contact repulsion by CR cells, we carried out time-lapse analyses of the migration of CR cells in the presence of Fc control or ectodomain fragments. Compared to controls, CR cells displayed much fewer contact repulsions in the presence of Fc-tagged Eph ectodomains (Figures 6A and 6C, Movie S12). Consequently, the paths followed by these cells were more linear than in controls (Figures 6B, 6D, 6G, and 6H). We also observed that inhibition of Eph/ephrin signaling increased the time that cells remain in contact (Figures 6G), while it decreased the magnitude of the direction change after contact (Figures 6G and 6H).
Figure 6. Dynamic analysis of Eph/ephrin signaling in contact repulsion between CR cells.

(A, C and E) High-resolution time-lapse images of the collision between CR cells (pseudocolored) in different experimental conditions.
(B, D and F) Tracks of migrating CR cells in culture.
(G and I) Directionality indexes (DI), contact times and average after-collision angle for CR cells in different experimental conditions. For Fc treated cells, DI = 0.3723 ± 0.0335; for EphA3+EphB2 Fc treated cells, DI = 0.4907 ± 0.0326, t-test: *p < 0.05. Contact times for Fc treated cells = 2.1428 ± 0.1413 frames; for EphA3+EphB2 Fc treated cells = 3.8333 ± 0.3844 frames, t-test: ***p < 0.001. Average angle after-collision (α); for Fc treated CR cells, α = 72.9765 ± 4.3755°; for EphA3+EphB2 Fc treated cells, α = 54.3540 ± 4.3157°, t-test: **p < 0.01. Control Fc, n = 80 cells; EphA3+EphB2 Fc, n = 80 cells; wild type, n = 93 cells; EphB1/B2/B3 mutant, n = 91 cells; from 4 different experiments in each condition; t-test, *p ≤ 0.05, **p ≤0.01, ***p ≤ 0.001.
(H and J) Velocity vectors for CR cells in different experimental conditions. Each arrow represents the average value of 30 cells from an independent experiment.
Scale bars equal 25 μm.
We next used mouse genetics to confirm the involvement of Eph/ephrin signaling in contact repulsion by CR cells. Considering the wide range of Eph and ephrin molecules expressed by CR cells, we reasoned that targeting several Eph receptors from the same subclass was more likely to disrupt contact repulsion than deletion of a single molecule. So, we cultured hem explants from control and EphB1;EphB2;EphB3 (EphB1/B2/B3) knockout mouse embryos, and analyzed the behavior of CR cells using real-time video microscopy. In agreement with our previous observations, we found that CR cells derived from EphB1/B2/B3 mutants consistently failed to repel each other and remained in contact for longer periods of time than control cells (Figures 6E, Movie S13). Consequently, EphB1/B2/B3 mutant cells followed relatively straight trajectories (Figure 6F), as reflected by a significant increase in their directionality index and a decrease in the angle at which they emerge after contact (Figures 6I and 6J). In contrast, the average speed of EphB1/B2/B3 mutant cells did not significantly differ from control CR cells (mutant cells: 1.25 ± 0.20 μm/min; control cells: 1.56 ± 0.02 μm/min; t-test, p = 0.18; n = 100 cells from 4 different experiments), which suggest that loss of Eph/ephrin signaling does not affect the general motility of these neurons.
To examine the effect of disrupting Eph/ephrin signaling in a more physiological context, we cultured flat whole-mount cortices from wild type and EphB1/B2/B3 mutants and analyzed the migration of CR cells labeled with DiI (Figure S3). CR cells lacking EphB1/B2/B3 receptors disperse less efficiently than wild type CR cells (Figure S3), reinforcing the view that this signaling system is important for the distribution of CR cells. Altogether, these results demonstrated that Eph/ephrin signaling mediates contact repulsion among CR cells.
Blocking contact repulsion disrupts normal CR cell distribution in vivo
Our previous experiments strongly suggested that CR cells might rely on Eph/ephrin signaling to distribute throughout the surface of the cortex. To test this idea, we analyzed the distribution of CR cells in coronal sections obtained from an allelic series of mouse mutant embryos lacking some of the EphB receptors (Figure S4). We observed that removal of one EphB gene alone did not seem to affect the distribution of CR cells at E12.5 (Figures S4A–S4C, and data not shown). In contrast, simultaneous deletion of two and, even more so, three EphB genes led to an abnormal arrangement of CR cells (Figures S4D–S4H). For example, we found many more gaps between CR cells in EphB1/B2/B3 mutants than in controls (Figures 7A–7C), which led to a significant decrease in the area of the cortex occupied by CR cells in the mutants (Figures 7D). These defects did not correlate with abnormalities in radial glial cells (Figure S5).
Figure 7. Eph/ephrin signaling is required for CR cell cortical coverage in vivo.

(A and B) Coronal sections trough the telencephalon of control (A) and EphB1/B2/B3 mutant (B) E12.5 mouse embryos showing the distribution of CR cells by calretinin immunostaining. (A′) and (B′) are high magnification images of the boxed areas in (A) and (B), respectively. Note the irregular distribution of CR cells in mutant embryos (B and B′) compared to controls (A and A′).
(C) Representation of the marginal zone coverage by CR cells in coronal sections in both controls (gray) and mutants (red). Note the increase in gaps between CR cells in EphB1/B2/B3 mutants.
(D) Percentage area of the cortex occupied by CR cells in E12.5 control (gray) = 8.1558 ± 0.9984% or EphB1/B2/B3 mutant (red) = 5.2788 ± 0.7131% embryos, also divided in rostral (wild type = 14.2609 ± 2.3030%; EphB1/B2/B3 mutant = 9.7243 ± 1.5224%), intermediate (wild type = 4.8366 ± 0.2954%; EphB1/B2/B3 mutant = 3.2513 ± 0.5794%), and caudal (wild type = 5.3700 ± 0.7971%; EphB1/B2/B3 mutant = 2.8605 ± 0.5955%) levels of the cortex (n = 6 animals for each condition). Mann-Whitney test, *p < 0.05, ***p ≤ 0.001.
H, hippocampus; LGE, lateral ganglionic eminence; NCx, neocortex; PCx, piriform cortex. Scale bars equal 200 μm.
Analysis of the distribution of CR cells in whole-mount hemispheres also revealed important differences between control and EphB1/B2/B3 mutant embryos. Compared to controls, CR cells failed to distribute regularly through the surface of the cortex in EphB1/B2/B3 mutants (Figures 8A, 8B, 8F and 8G). Consistently, coverage deficits (revealed by minimum distance and regularity index measurements) were observed throughout the entire cortex, being very prominent in the caudal region of the hemispheres (Figures 8C, 8H and 8K). These results were consistent with the hypothesis that contact repulsion mediated by Eph/ephrin interactions mediates the dispersion of CR throughout the developing cortex. In the absence of this signaling system, CR cells fail to disperse appropriately, and defects are particularly prominent in the caudal cortex. Thus, in agreement with our in vitro data and mathematical modeling, loss of contact repulsion in vivo leads to defects in the dispersion and final distribution of CR cells.
Figure 8. Eph/ephrin signaling is required for CR cell distribution in vivo.

(A and F) Whole-mount telencephalic hemispheres of control (A) and EphB1/B2/B3 mutant (F) E12.5 mouse embryos showing the distribution of CR cells by the expression of Reelin mRNA.
(B and G) Binary masks of pictures shown in (A) and (F), respectively.
(C and H) Graphical representation of the coverage of the space by CR cells using the minimum distance values obtained from (B) and (G).
(D, E and I, J) Graphical representation of the minimum distance or coverage obtained after mathematical simulation of cells migrating with (D and I) or without (E and J) contact repulsion.
(K) Quantification of the mean minimum distance (mD) from each pixel of the field to the closest cell and regularity index (RI) in control (gray) and mutant (red) embryos. Control, mD = 5.9000 ± 0.3795 pixels, RI = 1.8379 ± 0.0601; EphB1/B2/B3 mutant, mD = 11.2500 ± 1.6621 pixels, RI = 0.6637 ± 0.2032 (n = 5 wild type and n = 4 mutant embryos, t-test: *p < 0.05, **p ≤0.01).
(L) Quantification of coverage or minimum distance and regularity index obtained in silico. Gray bars represent normal cell density with (light gray) or without (dark gray) contact repulsion (CoRe). Red bars represent mutant cell density with (dark red) or without (light red) CoRe. Normal cell density with contact repulsion, mD = 5.62 ± 0.36 pixels, RI = 1.6504 ± 0.0226 (n = 55); normal density without contact repulsion, mD = 9.02 ± 0.84 pixels, RI= 0.62836 ± 0.0324 (n =55); mutant cell density with contact repulsion, mD = 7.92 ± 0.15 pixels, RI = 1.4203 ± 0.0170 (n = 65); mutant cell density without contact repulsion, mD = 10.5 ± 0.98 pixels, RI = 0.8382 ± 0.0186 (n = 65). Two-way ANOVA: ***p ≤ 0.001.
NCx, neocortex.
Scale bar equals 200 μm.
We reasoned that a deficit in the production of CR cells in EphB1/B2/B3 mutants could also impact their final distribution. Since EphB receptors have been previously shown to influence cell proliferation in different biological contexts (Chumley et al., 2007; Holmberg et al., 2006), and the telencephalon in some EphB1/B2/B3 mutant embryos seemed smaller than in controls (Figure S4), we carried out an additional series of experiments to dissociate the relative contribution of cell number and contact repulsion to the final distribution of CR cells. First, we tested whether our mathematical model was able to predict in vivo coverage indexes. To this end, we applied the parameters that we inferred from our in vitro experiments to the number of cells found in wild type embryos. Minimum distance and regularity index measurements in silico revealed mean values for “controls” (i.e. with contact repulsion) and “mutants” (i.e. without contact repulsion) that were almost identical to those obtained in vivo for wild type and EphB1/B2/B3 mutant embryos (Figure 8L). Subsequently, we repeated these experiments with the number of cells found in EphB1/B2/B3 mutant embryos. We found that both reduced cell number and impaired contact repulsion likely contribute to the coverage deficits observed in EphB1/B2/B3 mutant embryos (Figure 8L). We then calculated the Voronoi domain regularity index, an independent measure that is relatively insensitive to cell density differences (Raven et al., 2003). This analysis confirmed that contact repulsion is essential for the regular distribution of CR cells in the cortex (Figure 8L). Thus, contact repulsion is necessary for the dispersion and efficient distribution of CR cells in vivo.
Discussion
We have identified a novel mechanism that contributes to patterning the developing nervous system. In contrast to most neurons and their axons, which rely on pathfinding mechanisms to select the correct route toward their target (Dickson, 2002; Tessier-Lavigne and Goodman, 1996), CR cells depend on repetitive, random cell-cell repulsive interactions to efficiently distribute throughout the surface of the cortex. At the molecular level, both type A and type B ephrin and Eph receptors seem to be required to sustain contact repulsion between CR cells, as disruption of Eph/ephrin signaling reduces the efficiency of CR cell dispersion. Contact repulsion between CR cells may also contribute to stabilize the relative distribution of populations of CR cells derived from distinct sources in the embryonic pallium. Thus, our experiments reveal that some neuronal assemblies may emerge during development through stochastic events, such as the random interactions of mutually repulsive migrating cells.
Contact repulsion in cell migration
Contact repulsion has been previously shown to influence cell migration in different contexts, most notably during embryogenesis and cancer (Abercrombie, 1979; Mayor and Carmona-Fontaine, 2010). In particular, the mechanism of contact repulsion described here for CR cells resembles the process of “contact inhibition of locomotion”, which is thought to support the coordinated migration of mesenchymal cells such as those in the neural crest (Carmona-Fontaine et al., 2008; Teddy and Kulesa, 2004). Although this process refers specifically to the phenomenon of a cell ceasing to continue moving in the same direction after contact with another cell (Abercrombie and Heaysman, 1953), the cellular basis of contact inhibition of locomotion is likely to be common to the more general phenomenon of contact repulsion described here. There are additional parallelisms between the migration of neural crest cells and CR cells. For example, both types of cells are attracted by the chemokine Cxcl12, although with apparently different purposes. During the migration of neural crest cells, Cxcl12 promotes directional migration by stabilizing the polarity of cells at the leading front (Theveneau et al., 2010). In the cortex, Cxcl12 produced by the meninges promotes the migration of CR cells and contributes to restrict their movement through the most superficial aspect of the marginal zone (Borrell and Marín, 2006; Paredes et al., 2006). Another notable difference is that CR cells migrate as individual cells and not as clusters of relatively packed cells undergoing collective migration, as it is the case for mesenchymal cells. In addition, contact repulsion not only contributes to the dispersion of migrating CR cells, but also facilitates their regular spreading throughout the entire surface of the cortex. In other words, contact repulsion facilitates the orderly spatial arrangement of neurons in the surface of the cortex, an emerging property of the system that is a direct consequence of the cellular mechanism underlying the migration of CR cells.
Contact repulsion during migration also mediates the formation of dynamically stable boundaries between different populations of CR cells. While cell dispersion and directional migration can be sustained by homotypic interactions, the emergence of a relatively regular pattern of distribution for CR cells is a direct consequence of the existence of heterotypic repulsive interactions between CR cells from different origins. Our in vitro and modeling experiments predict that CR cells from different sources will tend to occupy largely non-overlapping regions of the cortex. However, contact repulsion is unlikely to generate completely impermeable boundaries, and so some overlapping of CR cells from different sources is likely to occur, as observed in vivo (Bielle et al., 2005; Meyer et al., 2002; Takiguchi-Hayashi et al., 2004). Considering that the interactions among different CR cells seem very similar, the size of the territories occupied by different classes of CR cells is likely determined by the number of cells produced by each source and their timing of generation. These ideas are consistent with the observation that CR cells redistribute dynamically upon ablation of one of their sources (Griveau et al., 2010; Yoshida et al., 2006). For example, the frontal cortex is rapidly colonized by CR cells derived from the ventral pallium and hem after genetic ablation of the pallial septum, the source of many of the CR cells that normally populate the most rostral aspect of the embryonic cortex (Griveau et al., 2010). In sum, contact repulsion emerges as an important mechanism controlling the directional migration of CR cells as well as their even distribution throughout the entire surface of the cortex.
Eph signaling in cell migration and patterning
Eph receptors and ephrins have been previously shown to be involved in the generation and maintenance of patterns of cellular organization through contact repulsion (Wilkinson, 2001). In particular, Eph/ephrin-mediated contact repulsion is used in different contexts to prevent cells from entering inappropriate territories, which contributes to the formation of boundaries between adjacent structures. This mechanism operates, for example, to prevent the mixing of neighboring hindbrain segments during nervous system development (Xu et al., 1999), and it is likely to be disrupted in cancer cells undergoing metastatic growth (Pasquale). Our results demonstrate that Eph receptors and ephrin proteins also mediate pattern formation for individual cells, transforming contact repulsion during migration in a mechanism that leads to the efficient dispersion of CR cells.
CR cells seem to express a complex combination of ephrins and Eph receptors from both the A and B classes, and interfering with the signaling of both families of proteins impairs contact repulsion in CR cells. Loss of EphB receptors disrupt the regular distribution of CR cells in vivo, and it is conceivable that simultaneous disruption of EphA/ephrinA signaling would enhance this phenotype. However, it is presently unclear whether these different signaling modules encode different aspects of this process or whether both classes of ligand/receptor pairs cooperate to control contact repulsion. In the spinal cord, for example, the presence of multiple parallel Eph/ephrin interactions has been suggested to provide functional redundancy to ensure the fidelity of motor axon trajectory (Kao et al., 2012). In cancer cells, however, EphA and EphB signaling seem to play complementary roles. For instance, EphA signaling mediates homophilic contact repulsion among prostate cancer cells, while EphB signaling suppresses heterophilic contact repulsion (Astin et al., 2010). It remains to be investigated whether different classes of CR cells express different combinations of ephrins and Eph receptors, and how this may impact the relative dispersion of CR cells from their different sources.
Contact repulsion and cellular mosaics
In many regions of the brain, neurons distribute in relatively organized spatial arrangements. One extreme example is the retina, where distinct classes of neurons distribute in very regular arrays termed mosaics (Cook and Chalupa, 2000). In retinal mosaics, each neuron is less likely to be near a cell of the same class than would occur by chance, a property that seems to be sufficient to explain the extreme regularity of this structure. Short-range repulsive interactions sustain the formation of retinal mosaics (Kay et al., 2012), as suggested here for the dispersion and even distribution of CR cells. From this perspective, contact repulsion among CR cells leads to a behavior that resembles “cellular tilling” and contributes to patterning the cerebral cortex. However, CR cells do not seem to distribute in a completely homogenous manner in the embryonic cortex, at least when the entire population of CR cells is analyzed based on the expression of Reelin at E12.5. Instead, CR cells tend to form small aggregates that in certain areas resemble honeycomb-like structures (Fairén et al., 2002). This suggests that, in addition to cell-cell repulsive interactions, differential adhesion between CR cells may contribute to the distribution of these cells in the developing cortex. This hypothesis is compatible with the observation that blocking Eph/ephrin signaling in migrating CR cells increases the time that these cells remain in contact (Figure 6), and suggests that additional molecules may control the final allocation of CR cells. Alternatively, the small cell aggregates that are observed at E12.5 in some areas of the cortex may correspond to transient arrangements of cells that are still undergoing migration.
Once they occupy their final position, CR cells extend multiple processes and long horizontal axons that intermingle through layer I (del Rio et al., 1995; Marín-Padilla, 1998). It is unclear, however, if ephrins and Eph receptors remain expressed in these cells and whether they might contribute to the tilling of CR cell neurites. Interestingly, in vivo imaging studies have shown that CR cells still undergo small movements during the first postnatal week (Chowdhury et al., 2010), and even some of their axons are tipped with growth cones that continue to grow at this stage (Portera-Cailliau et al., 2005). Thus, it is possible that Eph/ephrin signaling may continue to function during early postnatal development to maintain the distribution of CR cells and their axons.
It is worth noting that the marginal zone of the developing cortex contains several populations of neurons, including CR cells, GABAergic interneurons, and the so-called non-subplate pioneer neurons (Ang et al., 2003; Espinosa et al., 2009; Marín and Rubenstein, 2001). These populations of neurons occupy adjacent but non-overlapping sublaminas within the marginal zone, with CR cells present in the most superficial aspect and migrating interneurons immediately below. Intriguingly, overexpression of BDNF in the developing cortex segregates CR cells and interneurons into large, mutually exclusive clusters of cells (Alcantara et al., 2006). This observation suggests that CR cells and interneurons may also undergo cell-cell repulsive interactions during cortical development to restrict their respective movements into distinct sublaminas of the marginal zone, a process that seems to be influenced by BDNF. Thus, contact repulsion may play a general role in the formation of the complex and dynamic pattern of cellular mosaics that exist in the developing marginal zone of the cerebral cortex.
Stochastic events in neural development
Stochastic mechanisms are used in many different biological contexts. During neural development, stochastic events are common in cell fate decisions, where they contribute to the generation of neuronal diversity (Johnston and Desplan, 2011). Our experiments suggest that stochastic events may also govern the migration and final distribution of specific populations of neurons. Thus, rather than relying on classical mechanisms of guidance, CR cells achieve directional migration through random interactions with other CR cells. To some extent, this process seems to function as a collective, distributed meter of cell density, which forces cells to advance toward less populated areas within the cortical marginal zone. Remarkably, this mechanism consistently leads to a very robust (i.e. reliable) dispersion of CR cells throughout the cerebral cortex, although it is unlikely that any two individuals would have the exactly same distribution of CR cells. Although the precise function of CR cells in cortical regionalization has yet to be defined (Griveau et al., 2010; Meyer et al., 2004), disruption of the mechanisms controlling contact repulsion in CR cells may impact the organization of the cortex in previously unanticipated ways. Small variations in the distribution of CR cells may perhaps contribute to inter-individual variability (Griveau et al., 2010), or even to the evolution of the cerebral cortex.
Experimental Procedures
Mouse strains
Calretinin-Cre mice (Taniguchi et al., 2011) and Rosa26 Reporter CAG-boosted EGFP (RCE) mice (Sousa et al., 2009) were maintained in a C57BL/6 background, while wild type and ubiquitously expressing GFP mice (Hadjantonakis et al., 1998) were maintained in a CD1 background. The allelic series of EphB mutants was generated using different mutations in the EphB1 gene (Williams et al., 2003), EphB2 (Birgbauer et al., 2000; Henkemeyer et al., 1996; Hindges et al., 2002) and EphB3 (Orioli et al., 1996) genes. These mice were maintained in a 129/CD1 mixed background. Mice were kept at the Instituto de Neurociencias in accordance with Spanish and European Union regulations.
Explants, flat whole-mount cultures and in vitro time-lapse imaging
For explant preparations, brain slices were obtained from E12.5 ubiquitously expressing GFP and wild type mice as described previously (Anderson et al., 1997). Hem, pallial septum (PS) and ventral pallium (VP) explants were dissected from organotypic slices of ubiquitously expressing GFP embryos (hem and PS) or Calretinin-Cre embryos (VP), and cultured on glass coverslips (BD BioCoat™ Poly-L-Lysine 12 mm) coated with laminin in Neurobasal medium containing 0.4% of methylcellulose (Sigma). The large majority of cells produced by hem (Borrell and Marín, 2006) or PS (93.4% Reelin+ cells, n = 516 cells from 5 different experiments) explants were found to be CR cells. In blocking experiments, explants were treated with EfnA1-Fc, EfnB1-Fc, EphA3-Fc or EphB2-Fc fragments alone (10 μg/ml, R&D Systems), with a mix of EphA3-Fc and EphB2-Fc fragments (10 μg/ml of each proteins, R&D Systems), or with human IgG Fc fragments (10 μg/ml or 20 μg/ml, Jackson ImmunoResearch) as control.
For flat whole-mount preparations, the neocortex of E11.5 and E12.5 wild type, control or EphB1/B2/B3 mutant embryos was dissected from the telencephalon and flat mounted on culture plate inserts (Millipore). For transplantation assays, hem explants from E12.5 GFP-expressing embryos were subsequently transplanted into E11.5 or E11.5 wild type flat cortices, and the compound preparations were cultured in Neurobasal for 48h. For experiments with control and EphB1/B2/B3 mutant embryos, small DiI crystals were inserted in the hem of the flattened cortices to label CR cells.
For time-lapse imaging, coverslips and plate inserts were transferred to a glass bottom microwell dish with the same medium and placed in the stage of an inverted Leica laser scanning spectral confocal microscope TCS SP2 AOBS. Cell-cell contacts were identified through three-dimensional analysis with Imaris® software.
Imaging CR cell migration in vivo
Pregnant mice carrying E12.5 or E13.5 Calretinin-Cre;RCE mouse embryos were anesthetized with isofluorane for the surgery. After laparotomy, an individual embryo was placed in a dish located just above the mother through a silicon hole. The embryo was then fixed to the plate with 4% agarose except the upper part of the head, which was covered with heated PBS. Time-lapse imaging of CR cells (identified by the expression of GFP from the Calretinin locus) migrating along the marginal zone was recorded with a Leica laser scanning spectral confocal microscope TCS SP2 RS (resonant scanning) using long working distance and water immersion 10–20x objectives.
In situ hybridization and immunohistochemistry
For in situ hybridization (ISH), brains were fixed overnight in 4% paraformaldehyde in PBS. Twenty-micrometer frozen sections were hybridized with digoxigenin-labeled probes, as described before (Flames et al., 2007).
Immunohistochemistry was performed on vibratome sections and hem explants, as described before (Flames et al., 2007; López-Bendito et al., 2008), using chicken anti-GFP (1:1000, Aves Labs) and rabbit anti-Calretinin (1:3000, Swant) antibodies.
For the detection of Eph and ephrins in the surface of CR cells, we incubated live hem explants with Eph-Fc or ephrin-Fc ectodomains at 37°C during 5 min. After rinsing the Fc fragments, we incubated the explants for 1h at 4°C with goat anti-human Fc (1:500, Jackson ImmunoResearch), followed by 30 min at 4°C with donkey anti-goat 594 antibodies (1:200, Molecular Probes).
Quantification
The analysis of the tracks of migrating CR cells as well as the area occupied by CR cells in the surface of the cortex was carried out using ImageJ software. To calculate the area occupied by CR cells, we used coronal sections through rostral, intermediate and caudal levels through the cortex of E12.5 wild type and EphB1/B2/B3 knockout mouse embryos (n = 6). We set an arbitrary threshold for signal intensity to quantify the distribution of CR cells. For each level, we quantified the percentage of area occupied by CR cells from the total area of the neocortex, and a mean value for each brain was subsequently obtained.
The directionality index was calculated as the net displacement of a cell divided by the total path length followed by the cell. Velocity vectors and angles after collision were calculated using Matlab software. For the quantification of the P/D ratio in explants, the distance migrated by the 30 furthest cells was measured in the proximal and distal side of each explant using Neurolucida Explorer (MBF Bioscience) software.
For the analysis of the distance migrated by CR cells in flat cortices, we measured the distance migrated by the 50 furthest cells in transplanted cortices and the distance migrated by the 20 furthest DiI-labeled cells in wild type and EphB1/B2/B3 knockout mice cortices, using Neurolucida Explorer (MBF Bioscience) software.
All quantifications represent mean ± standard error of the mean (SEM).
Model
The model consists of a single layer representing the cortical surface. To simulate the tangential migration and final distribution of CR cells in the developing cortex we adopted a strategy based on random movement of individual neurons and repulsion upon contact between neighboring cells.
Tangential migration
To quantify the movement of CR cells along the cortical surface, we measured space and time in arbitrary units, pixels and frames respectively. Each cycle of the stochastic model is divided in 5000 frames of arbitrary duration. The velocity module of individual CR cells was chosen randomly from a distribution ranging from 0.5 to 1.5 pixels/frame and it remained constant throughout the entire modeling cycle (similar results were obtained with different distributions; data not shown).
The initial direction of motion for each CR cell was independently determined at random and updated every frame depending on its interactions with other cells. In the case of no interaction, the new direction was again chosen at random from all possible directions that maintain the velocity module unchanged. If during the preceding frame the reference CR cell A entered in contact with at least another CR cell, then the new direction (ND) of motion was computed according to an interaction function defined by the weighted sum of the individual vectors that linked CR cell A to all other CR cells within a radius of 7 pixels (similar results were obtained with smaller or larger neighborhoods; data not shown). The weights were calculated with an exponential distribution that depends on distance from A
here S is the group of all CR cells within a radius of 7 pixels from A; di is the distance between A and cell Ci; P and pi are the positions of A and Ci, respectively; and sigma was set such that the weight of a CR cell located exactly 7 pixels away from A was 0.01.
Minimum distance
We used minimum average distance from every pixel in the cortical model to its closest CR cell as a measure of cortical coverage and regularity. Non-random, regular mosaics minimize the variance and the minimum average distance to guarantee uniform and optimal coverage.
Regularity index
We used the regularity index to analyze coverage homogeneity. The regularity index is the result of dividing the average Voronoi domain area by the standard deviation (std). The Voronoi domain of one cell is the area that contains the points in the plane that are closer to that cell than to any other cell.
Segregation index
For every position X in the cortical model, we calculated the influence of each population of CR cells, S1 and S2, as
here di is the distance between position X and cell Ci; and sigma was set to 10 (similar results were obtained with smaller or larger neighborhoods; data not shown).
After obtaining a spatial map of the influence of each population of CR cells, M1 and M2, we computed the segregation index as
For graphical purposes, in Figs 2a and 2o, the maps were collapsed along the vector joining the sources of the two CR cell populations (cortical space was divided in 10 bins).
For minimum distance quantification in vivo, we performed a mask with the position of Reelin positive cells in whole mounted brains using ImageJ software. We obtained the position coordinates of each dot in the mask and we quantified the minimum distance using Matlab software (see above).
Supplementary Material
Acknowledgments
We thank A. Casillas for excellent technical assistance, T. Gil and M. Pérez for lab support, U. Drescher, E. Herrera, J. L. R. Rubenstein, A. Wanaka, and D. Wilkinson for plasmids, and G. Fishell (RCE) and J. Z. Huang (Calretinin-Cre) for mouse colonies. We are grateful to B. Hassan, M. Maravall, M. A. Nieto for critical reading of the manuscript, and members of the Borrell, Marín and Rico laboratories for stimulating discussions and ideas. Supported by grants from Spanish Ministry of Science and Innovation SAF2011-28845 and CONSOLIDER CSD2007-00023 to O. M. and from the National Institutes of Health (R01 MH66332) to M. H. V. V-C. was a “Junta de Ampliación de Estudios” (JAE) postdoctoral fellow from the Consejo Superior de Investigaciones Científicas, and is now a “Juan de la Cierva” postdoctoral fellow from the Ministerio de Economía e Innovación.
Footnotes
Publisher's Disclaimer: This is a PDF file of an unedited manuscript that has been accepted for publication. As a service to our customers we are providing this early version of the manuscript. The manuscript will undergo copyediting, typesetting, and review of the resulting proof before it is published in its final citable form. Please note that during the production process errors may be discovered which could affect the content, and all legal disclaimers that apply to the journal pertain.
References
- Abercrombie M. Contact inhibition and malignancy. Nature. 1979;281:259–262. doi: 10.1038/281259a0. [DOI] [PubMed] [Google Scholar]
- Abercrombie M, Heaysman J. Observations on the social behaviour of cells in tissue culture. I Speed of movement of chick heart fibroblasts in relation to their mutual contacts. Exp Cell Res. 1953;5:111–131. doi: 10.1016/0014-4827(53)90098-6. [DOI] [PubMed] [Google Scholar]
- Alcantara S, Pozas E, Ibanez CF, Soriano E. BDNF-modulated spatial organization of Cajal-Retzius and GABAergic neurons in the marginal zone plays a role in the development of cortical organization. Cereb Cortex. 2006;16:487–499. doi: 10.1093/cercor/bhi128. [DOI] [PubMed] [Google Scholar]
- Anderson SA, Eisenstat DD, Shi L, Rubenstein JLR. Interneuron migration from basal forebrain to neocortex: dependence on Dlx genes. Science. 1997;278:474–476. doi: 10.1126/science.278.5337.474. [DOI] [PubMed] [Google Scholar]
- Ang ES, Jr, Haydar TF, Gluncic V, Rakic P. Four-dimensional migratory coordinates of GABAergic interneurons in the developing mouse cortex. J Neurosci. 2003;23:5805–5815. doi: 10.1523/JNEUROSCI.23-13-05805.2003. [DOI] [PMC free article] [PubMed] [Google Scholar]
- Astin JW, Batson J, Kadir S, Charlet J, Persad RA, Gillatt D, Oxley JD, Nobes CD. Competition amongst Eph receptors regulates contact inhibition of locomotion and invasiveness in prostate cancer cells. Nat Cell Biol. 2010;12:1194–1204. doi: 10.1038/ncb2122. [DOI] [PubMed] [Google Scholar]
- Bielle F, Griveau A, Narboux-Neme N, Vigneau S, Sigrist M, Arber S, Wassef M, Pierani A. Multiple origins of Cajal-Retzius cells at the borders of the developing pallium. Nat Neurosci. 2005;8:1002–1012. doi: 10.1038/nn1511. [DOI] [PubMed] [Google Scholar]
- Birgbauer E, Cowan CA, Sretavan DW, Henkemeyer M. Kinase independent function of EphB receptors in retinal axon pathfinding to the optic disc from dorsal but not ventral retina. Development. 2000;127:1231–1241. doi: 10.1242/dev.127.6.1231. [DOI] [PubMed] [Google Scholar]
- Borrell V, Marín O. Meninges control tangential migration of hem-derived Cajal-Retzius cells via CXCL12/CXCR4 signaling. Nat Neurosci. 2006;9:1284–1293. doi: 10.1038/nn1764. [DOI] [PubMed] [Google Scholar]
- Carmona-Fontaine C, Matthews HK, Kuriyama S, Moreno M, Dunn GA, Parsons M, Stern CD, Mayor R. Contact inhibition of locomotion in vivo controls neural crest directional migration. Nature. 2008;456:957–961. doi: 10.1038/nature07441. [DOI] [PMC free article] [PubMed] [Google Scholar]
- Ceci ML, López-Mascaraque L, de Carlos JA. The influence of the environment on Cajal-Retzius cell migration. Cereb Cortex. 2010;20:2348–2360. doi: 10.1093/cercor/bhp305. [DOI] [PubMed] [Google Scholar]
- Chowdhury TG, Jimenez JC, Bomar JM, Cruz-Martin A, Cantle JP, Portera-Cailliau C. Fate of cajal-retzius neurons in the postnatal mouse neocortex. Front Neuroanat. 2010;4:10. doi: 10.3389/neuro.05.010.2010. [DOI] [PMC free article] [PubMed] [Google Scholar]
- Chumley MJ, Catchpole T, Silvany RE, Kernie SG, Henkemeyer M. EphB receptors regulate stem/progenitor cell proliferation, migration, and polarity during hippocampal neurogenesis. J Neurosci. 2007;27:13481–13490. doi: 10.1523/JNEUROSCI.4158-07.2007. [DOI] [PMC free article] [PubMed] [Google Scholar]
- Cook JE, Chalupa LM. Retinal mosaics: new insights into an old concept. Trends Neurosci. 2000;23:26–34. doi: 10.1016/s0166-2236(99)01487-3. [DOI] [PubMed] [Google Scholar]
- Cowan CA, Henkemeyer M. Ephrins in reverse, park and drive. Trends Cell Biol. 2002;12:339–346. doi: 10.1016/s0962-8924(02)02317-6. [DOI] [PubMed] [Google Scholar]
- del Rio JA, Martinez A, Fonseca M, Auladell C, Soriano E. Glutamate-like immunoreactivity and fate of Cajal-Retzius cells in the murine cortex as identified with calretinin antibody. Cereb Cortex. 1995;5:13–21. doi: 10.1093/cercor/5.1.13. [DOI] [PubMed] [Google Scholar]
- Dickson BJ. Molecular mechanisms of axon guidance. Science. 2002;298:1959–1964. doi: 10.1126/science.1072165. [DOI] [PubMed] [Google Scholar]
- Egea J, Klein R. Bidirectional Eph-ephrin signaling during axon guidance. Trends Cell Biol. 2007;17:230–238. doi: 10.1016/j.tcb.2007.03.004. [DOI] [PubMed] [Google Scholar]
- Espinosa A, Gil-Sanz C, Yanagawa Y, Fairen A. Two separate subtypes of early non-subplate projection neurons in the developing cerebral cortex of rodents. Front Neuroanat. 2009;3:27. doi: 10.3389/neuro.05.027.2009. [DOI] [PMC free article] [PubMed] [Google Scholar]
- Fairén A, Morante-Oria J, Frassoni C. The surface of the developing cerebral cortex: still special cells one century later. Prog Brain Res. 2002;136:281–291. doi: 10.1016/s0079-6123(02)36024-2. [DOI] [PubMed] [Google Scholar]
- Feldheim DA, O’Leary DD. Visual map development: bidirectional signaling, bifunctional guidance molecules, and competition. Cold Spring Harb Perspect Biol. 2010;2:a001768. doi: 10.1101/cshperspect.a001768. [DOI] [PMC free article] [PubMed] [Google Scholar]
- Flames N, Pla R, Gelman DM, Rubenstein JL, Puelles L, Marín O. Delineation of multiple subpallial progenitor domains by the combinatorial expression of transcriptional codes. J Neurosci. 2007;27:9682–9695. doi: 10.1523/JNEUROSCI.2750-07.2007. [DOI] [PMC free article] [PubMed] [Google Scholar]
- Forster E, Zhao S, Frotscher M. Laminating the hippocampus. Nat Rev Neurosci. 2006;7:259–267. doi: 10.1038/nrn1882. [DOI] [PubMed] [Google Scholar]
- Galli-Resta L, Resta G, Tan SS, Reese BE. Mosaics of islet-1-expressing amacrine cells assembled by short-range cellular interactions. J Neurosci. 1997;17:7831–7838. doi: 10.1523/JNEUROSCI.17-20-07831.1997. [DOI] [PMC free article] [PubMed] [Google Scholar]
- Griveau A, Borello U, Causeret F, Tissir F, Boggetto N, Karaz S, Pierani A. A novel role for Dbx1-derived Cajal-Retzius cells in early regionalization of the cerebral cortical neuroepithelium. PLoS Biol. 2010;8:e1000440. doi: 10.1371/journal.pbio.1000440. [DOI] [PMC free article] [PubMed] [Google Scholar]
- Hadjantonakis AK, Gertsenstein M, Ikawa M, Okabe M, Nagy A. Generating green fluorescent mice by germline transmission of green fluorescent ES cells. Mech Dev. 1998;76:79–90. doi: 10.1016/s0925-4773(98)00093-8. [DOI] [PubMed] [Google Scholar]
- Henkemeyer M, Orioli D, Henderson JT, Saxton TM, Roder J, Pawson T, Klein R. Nuk controls pathfinding of commissural axons in the mammalian central nervous system. Cell. 1996;86:35–46. doi: 10.1016/s0092-8674(00)80075-6. [DOI] [PubMed] [Google Scholar]
- Hevner RF, Neogi T, Englund C, Daza RA, Fink A. Cajal-Retzius cells in the mouse: transcription factors, neurotransmitters, and birthdays suggest a pallial origin. Dev Brain Res. 2003;141:39–53. doi: 10.1016/s0165-3806(02)00641-7. [DOI] [PubMed] [Google Scholar]
- Hindges R, McLaughlin T, Genoud N, Henkemeyer M, O’Leary DD. EphB forward signaling controls directional branch extension and arborization required for dorsal-ventral retinotopic mapping. Neuron. 2002;35:475–487. doi: 10.1016/s0896-6273(02)00799-7. [DOI] [PubMed] [Google Scholar]
- Holmberg J, Genander M, Halford MM, Anneren C, Sondell M, Chumley MJ, Silvany RE, Henkemeyer M, Frisen J. EphB receptors coordinate migration and proliferation in the intestinal stem cell niche. Cell. 2006;125:1151–1163. doi: 10.1016/j.cell.2006.04.030. [DOI] [PubMed] [Google Scholar]
- Johnston RJ, Jr, Desplan C. Stochastic mechanisms of cell fate specification that yield random or robust outcomes. Annu Rev Cell Dev Biol. 2011;26:689–719. doi: 10.1146/annurev-cellbio-100109-104113. [DOI] [PMC free article] [PubMed] [Google Scholar]
- Kao TJ, Law C, Kania A. Eph and ephrin signaling: lessons learned from spinal motor neurons. Semin Cell Dev Biol. 2012;23:83–91. doi: 10.1016/j.semcdb.2011.10.016. [DOI] [PubMed] [Google Scholar]
- Kay JN, Chu MW, Sanes JR. MEGF10 and MEGF11 mediate homotypic interactions required for mosaic spacing of retinal neurons. Nature. 2012;483:465–469. doi: 10.1038/nature10877. [DOI] [PMC free article] [PubMed] [Google Scholar]
- Lois C, García-Verdugo JM, Alvarez-Buylla A. Chain migration of neuronal precursors. Science. 1996;271:978–981. doi: 10.1126/science.271.5251.978. [DOI] [PubMed] [Google Scholar]
- López-Bendito G, Sánchez-Alcaniz JA, Pla R, Borrell V, Pico E, Valdeolmillos M, Marín O. Chemokine signaling controls intracortical migration and final distribution of GABAergic interneurons. J Neurosci. 2008;28:1613–1624. doi: 10.1523/JNEUROSCI.4651-07.2008. [DOI] [PMC free article] [PubMed] [Google Scholar]
- Marín O, Rubenstein JLR. A long, remarkable journey: tangential migration in the telencephalon. Nat Rev Neurosci. 2001;2:780–790. doi: 10.1038/35097509. [DOI] [PubMed] [Google Scholar]
- Marín-Padilla M. Cajal-Retzius cells and the development of the neocortex. Trends Neurosci. 1998;21:64–71. doi: 10.1016/s0166-2236(97)01164-8. [DOI] [PubMed] [Google Scholar]
- Martini FJ, Valiente M, López Bendito G, Szabó G, Moya F, Valdeolmillos M, Marín O. Biased selection of leading process branches mediates chemotaxis during tangential neuronal migration. Development. 2009;136:41–50. doi: 10.1242/dev.025502. [DOI] [PubMed] [Google Scholar]
- Mayor R, Carmona-Fontaine C. Keeping in touch with contact inhibition of locomotion. Trends Cell Biol. 2010;20:319–328. doi: 10.1016/j.tcb.2010.03.005. [DOI] [PMC free article] [PubMed] [Google Scholar]
- Meyer G, Cabrera Socorro A, Perez Garcia CG, Martinez Millan L, Walker N, Caput D. Developmental roles of p73 in Cajal-Retzius cells and cortical patterning. J Neurosci. 2004;24:9878–9887. doi: 10.1523/JNEUROSCI.3060-04.2004. [DOI] [PMC free article] [PubMed] [Google Scholar]
- Meyer G, Goffinet AM, Fairén A. What is a Cajal-Retzius cell? A reassessment of a classical cell type based on recent observations in the developing neocortex. Cereb Cortex. 1999;9:765–775. doi: 10.1093/cercor/9.8.765. [DOI] [PubMed] [Google Scholar]
- Meyer G, Perez-Garcia CG, Abraham H, Caput D. Expression of p73 and Reelin in the developing human cortex. J Neurosci. 2002;22:4973–4986. doi: 10.1523/JNEUROSCI.22-12-04973.2002. [DOI] [PMC free article] [PubMed] [Google Scholar]
- Orioli D, Henkemeyer M, Lemke G, Klein R, Pawson T. Sek4 and Nuk receptors cooperate in guidance of commissural axons and in palate formation. EMBO J. 1996;15:6035–6049. [PMC free article] [PubMed] [Google Scholar]
- Paredes MF, Li G, Berger O, Baraban SC, Pleasure SJ. Stromal-derived factor-1 (CXCL12) regulates laminar position of Cajal-Retzius cells in normal and dysplastic brains. J Neurosci. 2006;26:9404–9412. doi: 10.1523/JNEUROSCI.2575-06.2006. [DOI] [PMC free article] [PubMed] [Google Scholar]
- Pasquale EB. Eph receptor signalling casts a wide net on cell behaviour. Nat Rev Mol Cell Biol. 2005;6:462–475. doi: 10.1038/nrm1662. [DOI] [PubMed] [Google Scholar]
- Pasquale EB. Eph receptors and ephrins in cancer: bidirectional signalling and beyond. Nat Rev Cancer. 2010;10:165–180. doi: 10.1038/nrc2806. [DOI] [PMC free article] [PubMed] [Google Scholar]
- Portera-Cailliau C, Weimer RM, De Paola V, Caroni P, Svoboda K. Diverse modes of axon elaboration in the developing neocortex. PLoS Biol. 2005;3:e272. doi: 10.1371/journal.pbio.0030272. [DOI] [PMC free article] [PubMed] [Google Scholar]
- Rakic P. Specification of cerebral cortical areas. Science. 1988;241:170–176. doi: 10.1126/science.3291116. [DOI] [PubMed] [Google Scholar]
- Raven MA, Eglen SJ, Ohab JJ, Reese BE. Determinants of the exclusion zone in dopaminergic amacrine cell mosaics. J Comp Neurol. 2003;461:123–136. doi: 10.1002/cne.10693. [DOI] [PubMed] [Google Scholar]
- Soriano E, Del Rio JA. The cells of Cajal-Retzius: still a mystery one century after. Neuron. 2005;46:389–394. doi: 10.1016/j.neuron.2005.04.019. [DOI] [PubMed] [Google Scholar]
- Sousa VH, Miyoshi G, Hjerling-Leffler J, Karayannis T, Fishell G. Characterization of Nkx6–2-derived neocortical interneuron lineages. Cereb Cortex. 2009;19(Suppl 1):i1–10. doi: 10.1093/cercor/bhp038. [DOI] [PMC free article] [PubMed] [Google Scholar]
- Suetterlin P, Marler KM, Drescher U. Axonal ephrinA/EphA interactions, and the emergence of order in topographic projections. Semin Cell Dev Biol. 2012;23:1–6. doi: 10.1016/j.semcdb.2011.10.015. [DOI] [PubMed] [Google Scholar]
- Takiguchi-Hayashi K, Sekiguchi M, Ashigaki S, Takamatsu M, Hasegawa H, Suzuki-Migishima R, Yokoyama M, Nakanishi S, Tanabe Y. Generation of reelin-positive marginal zone cells from the caudomedial wall of telencephalic vesicles. J Neurosci. 2004;24:2286–2295. doi: 10.1523/JNEUROSCI.4671-03.2004. [DOI] [PMC free article] [PubMed] [Google Scholar]
- Taniguchi H, He M, Wu P, Kim S, Paik R, Sugino K, Kvitsiani D, Fu Y, Lu J, Lin Y, et al. A resource of Cre driver lines for genetic targeting of GABAergic neurons in cerebral cortex. Neuron. 2011;71:995–1013. doi: 10.1016/j.neuron.2011.07.026. [DOI] [PMC free article] [PubMed] [Google Scholar]
- Teddy JM, Kulesa PM. In vivo evidence for short- and long-range cell communication in cranial neural crest cells. Development. 2004;131:6141–6151. doi: 10.1242/dev.01534. [DOI] [PubMed] [Google Scholar]
- Tessier-Lavigne M, Goodman CS. The molecular biology of axon guidance. Science. 1996;274:1123–1133. doi: 10.1126/science.274.5290.1123. [DOI] [PubMed] [Google Scholar]
- Theveneau E, Marchant L, Kuriyama S, Gull M, Moepps B, Parsons M, Mayor R. Collective chemotaxis requires contact-dependent cell polarity. Dev Cell. 2010;19:39–53. doi: 10.1016/j.devcel.2010.06.012. [DOI] [PMC free article] [PubMed] [Google Scholar]
- Tissir F, Goffinet AM. Reelin and brain development. Nat Rev Neurosci. 2003;4:496–505. doi: 10.1038/nrn1113. [DOI] [PubMed] [Google Scholar]
- Wilkinson DG. Multiple roles of EPH receptors and ephrins in neural development. Nat Rev Neurosci. 2001;2:155–164. doi: 10.1038/35058515. [DOI] [PubMed] [Google Scholar]
- Williams SE, Mann F, Erskine L, Sakurai T, Wei S, Rossi DJ, Gale NW, Holt CE, Mason CA, Henkemeyer M. Ephrin-B2 and EphB1 mediate retinal axon divergence at the optic chiasm. Neuron. 2003;39:919–935. doi: 10.1016/j.neuron.2003.08.017. [DOI] [PubMed] [Google Scholar]
- Xu Q, Mellitzer G, Robinson V, Wilkinson DG. In vivo cell sorting in complementary segmental domains mediated by Eph receptors and ephrins. Nature. 1999;399:267–271. doi: 10.1038/20452. [DOI] [PubMed] [Google Scholar]
- Yoshida M, Assimacopoulos S, Jones KR, Grove EA. Massive loss of Cajal-Retzius cells does not disrupt neocortical layer order. Development. 2006;133:537–545. doi: 10.1242/dev.02209. [DOI] [PubMed] [Google Scholar]
Associated Data
This section collects any data citations, data availability statements, or supplementary materials included in this article.