Abstract
Zinc-α2-glycoprotein (ZAG), a 43-kDa protein, is overexpressed in certain human malignant tumors and acts as a lipid-mobilizing factor to stimulate lipolysis in adipocytes leading to cachexia in mice implanted with ZAG-producing tumors. Because white adipose tissue (WAT) is an endocrine organ secreting a wide range of protein factors, including those involved in lipid metabolism, we have investigated whether ZAG is produced locally by adipocytes. ZAG mRNA was detected by RT-PCR in the mouse WAT depots examined (epididymal, perirenal, s.c., and mammary gland) and in interscapular brown fat. In WAT, ZAG gene expression was evident in mature adipocytes and in stromal-vascular cells. Using a ZAG Ab, ZAG protein was located in WAT by Western blotting and immunohistochemistry. Mice bearing the MAC16-tumor displayed substantial losses of body weight and fat mass, which was accompanied by major increases in ZAG mRNA and protein levels in WAT and brown fat. ZAG mRNA was detected in 3T3-L1 cells, before and after the induction of differentiation, with the level increasing progressively after differentiation with a peak at days 8–10. Both dexamethasone and a β3 agonist, BRL 37344, increased ZAG mRNA levels in 3T3-L1 adipocytes. ZAG gene expression and protein were also detected in human adipose tissue (visceral and s.c.). It is suggested that ZAG is a new adipose tissue protein factor, which may be involved in the modulation of lipolysis in adipocytes. Overexpression in WAT of tumor-bearing mice suggests a local role for adipocyte-derived ZAG in the substantial reduction of adiposity of cancer cachexia.
Cachexia, a catabolic state with extensive depletion of adipose tissue and skeletal muscle, is one of the most debilitating effects of certain malignant tumors. Most patients with gastrointestinal tract and lung cancers experience substantial weight loss (1, 2). Cachexia is suggested to be associated with the distant effects of tumor-derived products, including cytokines and catabolic factors that act to destroy host tissues during the cachectic process (2). Progressive cachexia always implies poor prognosis and accounts for ≈20% of cancer deaths (3). A substantial loss of body fat (up to 85%) is a hallmark of cancer cachexia, although the factors responsible remain elusive. One putative mediator is zinc-α2-glycoprotein (ZAG), a 43-kDa protein originally isolated from human plasma (4). ZAG is also found in secretory epithelia cells including those of breast, prostate, and liver, as well as in bronchial, gastrointestinal, and sweat glands (5). Overexpression of ZAG occurs in several types of malignant tumor (6–8), and consequently ZAG has been used as a cancer marker.
The biological functions of ZAG are largely unknown. However, recently a lipid-mobilizing factor purified from a murine adenocarcinoma, MAC16, which causes profound cachexia, and from the urine of patients with cancer cachexia has been shown to be identical to ZAG (9). Murine and human ZAG display 59% amino acid sequence homology (10) but share up to 100% identity in specific regions thought to be important in lipid metabolism (11). In vivo, administration of ZAG to mice induces a rapid and selective reduction in body fat and increases serumfree fatty acid levels, by activating hormone-sensitive lipase through increased intracellular cAMP levels. In vitro, incubation of ZAG with adipocytes isolated from murine adipose tissue has been shown to stimulate lipolysis in a dose-dependent manner (12). Very recently, it has been reported that the potent lipolytic effect of ZAG is attenuated by the specific β3-adrenoreceptor antagonist SR59230, indicating that ZAG activity in rodents is mediated via the β3 adrenoreceptor with up-regulation of the cAMP pathway (13).
White adipose tissue (WAT), traditionally considered to be the major site of energy storage, is now recognized as an endocrine organ. Adipocytes express and secrete a wide range of proteins termed adipokines, such as leptin, adiponectin, resistin, apolipoprotein E, tumor necrosis factor-α, and IL-6 (14, 15). These adipocyte-derived proteins act either in an autocrine/paracrine manner to locally regulate adipocyte metabolism or as endocrine signals at distant sites in relation to energy homeostasis and other physiological processes. The powerful lipid mobilizing effects of ZAG together with the secretory function of adipocytes have led us to hypothesize that ZAG may be produced locally by adipose tissue and act as a new protein factor to influence lipid breakdown within the tissue. Importantly, ZAG has recently been proposed as a candidate gene in the regulation of body weight (16).
In this study, we have examined ZAG gene expression and ZAG protein in adipose tissues and in the 3T3-L1 adipocyte cell line. In addition to normal mice, ZAG expression has been examined in adipose tissue of mice bearing the MAC16 tumor, an experimental model of cancer cachexia in which there is extensive lipid mobilization. Finally, we have examined whether ZAG is expressed in human adipose tissue.
Materials and Methods
Animals. Ten-week-old male mice (CD1) from an inbred colony at the University of Liverpool were housed at an ambient temperature of 22 ± 1°C under a 12:12 h light-dark cycle (lights on at 0700 hours) and fed a standard pelleted diet (CRM diet, Labsure, Witham, U.K.). Mice were killed by cervical dislocation and the following tissues rapidly dissected and frozen in liquid N2; WAT (epididymal, perirenal, and s.c. depots), interscapular brown adipose tissue (BAT), spleen, liver, heart, kidneys, lungs, skeletal muscle (gastrocnemius), whole brain, and the hypothalamus. Mammary tissue pads were collected from lactating female mice (CD1). The tissues were stored at -80°C until RNA extraction. All animal studies were conducted according to the U.K. Home Office Guidelines for the care and use of laboratory animals.
MAC16 Tumor Induction. Sixteen female NMRI mice (20–22 g) from an inbred colony at Aston University (Birmingham, U.K.) were kept at an ambient temperature of 22 ± 2°C under a 12:12 h light-dark cycle (lights on at 0700 hours) and fed a standard diet (SDS economy breeder; Lillico, Bletchworth, U.K.) with tap water ad libitum. The MAC16 tumor tissue was maintained in mice within the colony. Under general anesthesia, eight mice were implanted s.c. in the flank with fragments of MAC16 tumor by using a trocar. The remaining mice underwent sham operation and served as nontumor-bearing controls. After tumor inoculation (16 d), mice were killed by cervical dislocation, and gonadal WAT, interscapular brown fat, and the liver were removed, as were the implanted tumors. The tissues were snap-frozen in liquid N2 and then stored at -80°C until the extraction of RNA.
Human Adipose Tissue Collection. Visceral (omental) and s.c. adipose tissues were obtained during gastroplasty from four patients (male and female) aged 37.5 ± 5.0 (mean ± SD) years, with body mass index 55.4 ± 9.6 (mean ± SD). The subjects did not suffer from any ongoing disease (infection or cancer). Fully informed and written consent was obtained in all cases, and the study protocol was approved by the Sefton Ethics Committee.
Cell Culture. The 3T3-L1 cells (American Type Culture Collection) were cultured at 37°C as described (17). Differentiation of the cells was initiated 2 d after confluence by incubation for 3 d in growth medium that consisted of an additional 10% FBS, 1 μM dexamethasone, 0.5 mM 3-isobutyl-1-methyl-xanthine, and 2 μM insulin. This was followed by 3 d in growth medium containing 0.2 μM insulin, and growth medium was then changed daily. Differentiation into adipocytes was confirmed by accumulation of lipid droplets. The cells were maintained for up to 15 d after differentiation, and sampled every 1–2 d, or for 8 d after which time specific agents were added. Cells (at day 8) were incubated for 24 h in media containing either BRL 37344 (1 μM) or dexamethasone (20 nM) and then harvested, lysed in TRIzol reagent (Invitrogen), and stored at -80°C until analysis.
RT-PCR. Total RNA was extracted from tissues and 3T3-L1 cells by using TRIzol (Invitrogen). The RNA concentration was determined from the absorbance at 260 nm. ZAG gene expression in both mouse and human tissues was detected by RT-PCR. First strand DNA was reverse-transcribed from 1 μg of total RNA by using a Reverse-iT first strand synthesis kit (ABgene, Surrey, U.K.) according to the manufacturer's instruction; samples of the reaction were amplified in a PCR mixture containing 0.02 mM of each primer and 1.1× Reddy Mix PCR master mix (ABgene). The following primer pairs were used: mouse ZAG, 5′-GCCTTCTTCCACTACAACAG-3′ (forward), 5′-TTCAGGACACTCCTCCTCTA-3′ (reverse); mouse hypoxanthine-phosphoribosyl transferase, 5′-CAGTCCCAGCGTCGTGATTA-3′ (forward), 5′-AGCAAGTCTTTCAGTCCTGTC-3′ (reverse); human ZAG, 5′-CTTGGCTCACTCAATGACCT-3′ (forward), 5′-CTCCGCTGCTTCTGTTATTC-3′ (reverse); and human β-actin, 5′-GTGGCATCCACGAAACTACCTT-3′ (forward), 5′-GGACTCGTCATACTCCTGCTTG-3′ (reverse).
PCR was performed on a thermal cycler (Hybaid, Middlesex, U.K.) with an initial denaturation at 94°C for 2 min followed by 35 cycles of denaturation at 94°C for 20 sec, annealing at 53.5°C for 25 sec, and extension at 72°C for 59 sec. For human β-actin, amplification was achieved with 28 cycles consisting of 94°C for 20 sec, 56°C for 30 sec, and 72°C for 30 sec. The final step was extension at 72°C for 5 min. Negative control RT-minus reactions were carried out to establish that the target RNA was not contaminated with DNA. To confirm the identity of PCR products, the products were sequenced in both orientations. PCR products were separated on a 1% agarose gel and stained with ethidium bromide, and images were recorded.
Real-Time RT-PCR. After reverse transcription as described above, quantification of murine ZAG, leptin, adiponctin, and β-actin mRNA was performed with a PRISM 7700 sequence detector (Applied Biosystems), by using TaqMan probe. primer express software (Applied Biosystems) was used to design primers and probes. The following primers and probes were used: ZAG, 5′-GAGCCTGTGGGACCTTGGA-3′ (forward), 5′-CCTCCCTGGCCCTCTGAA-3′ (reverse), and 5′-FAM-AATGGAGGACTGGGAGAAGGAAAGCCAG-TAMRA-3′; leptin, 5′-CATCTGCTGGCCTTCTCCAA-3′ (forward), 5′-ATCCAGGCTCTCTGGCTTCTG-3′ (reverse), and 5′-FAMAGCTGCTCCCTGCCTCAGACCAGTG-TAMRA-3′; adiponectin, 5′-GGCTCTGTGCTCCTCCATCT-3′ (forward), 5′-AGAGTCGTTGACGTTATCTGCATAG-3′ (reverse), and 5′-FAM-CCCATACACCTGGAGCCAGACTTGGT-TAMRA-3′; β-actin, 5′-ACGGCCAGGTCATCACTATTG-3′ (forward), 5′-CAAGAAGGAAGGCTGGAAAAGA-3′ (reverse), and 5′-FAM-ACGAGCGGTTCCGATGCCCTG-TAMRA-3′. The PCR parameters were as follows: 2 min at 50°C, 10 min at 95°C followed by 40 cycles of denaturation at 95°C for 15 sec, and annealing and extension at 60°C for 1 min. Amplification was performed in a final volume of 25 μl, and each sample contained 3 μl cDNA (equivalent to 150 ng of RNA), 900 nmol of specific primers, 225 nmol of the probe, and a master mix made from quantitative PCR core kit (Eurogentec, Brussels).
Each quantitative PCR reaction was repeated in triplicate, and the mean value of Ct for each sample was used for data analysis. All samples were normalized to the β-actin values and the results expressed as fold changes of Ct value relative to controls by using the 2-ΔΔct formula (18).
Western Blotting. Proteins were isolated from mouse WAT, BAT, liver and 3T3-L1 cells (at day 15 after differentiation), and from human WAT depots. Samples containing 40 μg of protein were mixed with equal volumes of 2× SDS loading buffer, incubated at 90°C for 5 min, and separated by electrophoresis on 12% SDS-polyacrylamide gels. Proteins were then transferred to nitrocellulose membranes (Hybond C, Amersham Pharmacia), and immunological detection was performed by using a mouse mAb to human ZAG (Santa Cruz Biotechnology) at a 1:1,000 dilution. Blots were then incubated with a rabbit anti-mouse secondary Ab, at a dilution of 1:2,000, conjugated to horseradish peroxidase (DAKO A/S). Detection was by enhanced chemiluminescence (Amersham Pharmacia). The size of the proteins detected was estimated by using protein rainbow molecular-mass standards (Amersham Pharmacia). Autoradiographs were scanned by densitometry to quantitate differences and analyzed by using phoretix 1d advanced software. Gels were stained with Ponceau S to confirm equal loading.
Immunohistochemistry. A female C57BL mouse, 8 wk old, was anesthetized with ketamine (Ketavet 100, Intervet-Italy; 100 mg/kg, i.p.) in combination with xylazine (Rompum, Bayer; 10 mg/kg, i.p.) and perfused intraaortically with a 4% paraformaldehyde in 0.1 M phosphate buffer (PB, pH 7.4). Mammary gland (IV) was dissected, rinsed in PB, immersed in 30% sucrose in PB for 24 h at 4°C, frozen in liquid N2, and stored at -80°C. The tissue was cut into 7-μm-thick serial sections with a cryostat (Leica CM 1900). Immunoreactivity was assessed in serial frozen sections of the mammary gland according to the avidin-biotin-peroxidase method (19) with (i) normal rabbit serum (Vector Laboratories) 1:75 in PB for 20 min at room temperature; (ii) primary Ab: polyclonal goat anti-mouse ZAG (Santa Cruz Biotechnology) 1:50 in PB overnight at 4°C; (iii) biotinylated secondary Ab: rabbit anti-goat IgG 1:200 (Vector Laboratories) in PB for 30 min at room temperature. A negative control was obtained in each instance by omitting the primary Ab.
Statistical Analysis. Data are expressed as mean values ± SEM. Differences between groups were analyzed by ANOVA coupled with Bonferroni's t tests by using arcus statistical software (Medical Computing, Aughton, U.K.). Differences were considered as statistically significant when P < 0.05.
Results
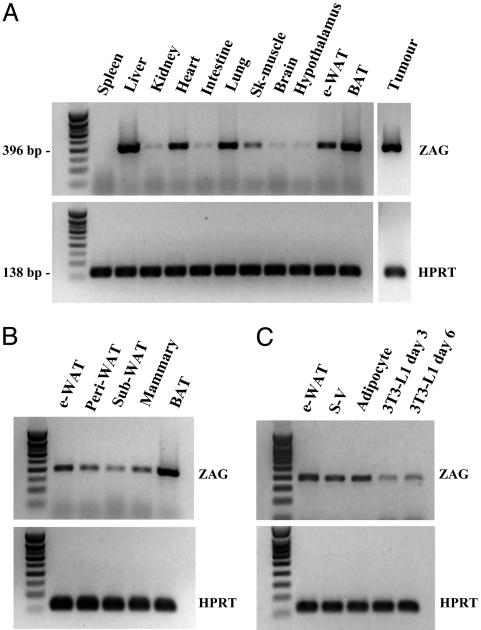
Mouse Adipose Tissue Expresses the ZAG Gene. The expression pattern of the ZAG gene was initially examined in mouse tissues by using RT-PCR. A strong signal was detected in liver, BAT, and the MAC16 tumor, and a moderate signal was obtained in heart, lung, and epididymal WAT (Fig. 1A). Negative control RT-minus reactions confirmed that the target RNA samples were not contaminated with DNA (data not shown). Several white fat depots were then examined, including the epididymal, perirenal, s.c., and mammary gland sites, and a signal for ZAG mRNA was detected in each (Fig. 1B). Subsequently, we determined whether the ZAG gene was expressed in mature adipocytes within white fat. Fig. 1C shows that the ZAG transcript was indeed present in mature adipocytes, as well as in the cells of the stromal vascular fraction. ZAG mRNA was also detected in cultured 3T3-L1 adipocytes examined at days 3 and 6 after the induction of differentiation (Fig. 1C). Sequence analysis of the 396-bp amplicon of both WAT and 3T3-L1 cells revealed 100% homology with the corresponding region of murine ZAG cDNA.
Fig. 1.
ZAG gene expression in mouse tissues and adipocytes examined by RT-PCR. (A) Tissue specificity of expression. (B) Expression in fat depots. (C) Expression in mature adipocytes and stromal-vascular cells (isolated by collagenase digestion) and 3T3-L1 adipocytes. The 3T3-L1 cells were taken at days 3 and 6 after inducing differentiation. HPRT, hypoxanthine-phosphoribosyl transferase; e-WAT, epididymal WAT; peri, perirenal; sub, s.c.; sk, skeletal; S-V, stromal vascular.
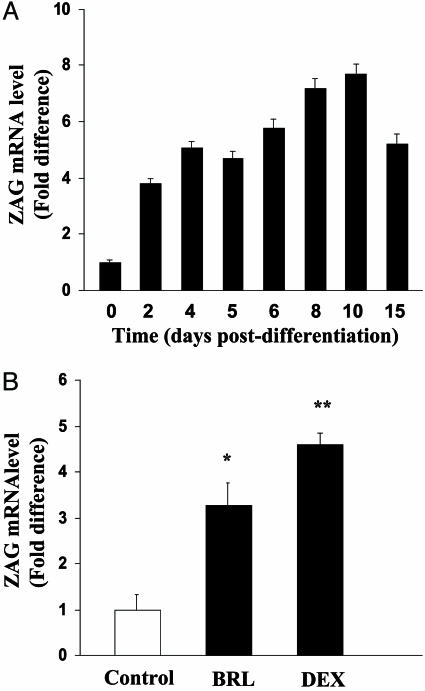
ZAG Gene Expression in 3T3-L1 Adipocytes. The expression of the ZAG gene during the maturation of 3T3-L1 cells was first examined by RT-PCR, a signal being obtained before and after differentiation (results not shown). It was then further examined by using real-time RT-PCR to quantitate ZAG mRNA. Low levels of ZAG mRNA were detectable before the induction of differentiation but ZAG expression increased progressively after differentiation, reaching a peak at 10 d after differentiation where the level of the mRNA was 7.7-fold higher than at day 0 (Fig. 2 A).
Fig. 2.
ZAG gene expression in 3T3-L1 adipocytes by real-time RT-PCR. (A) Expression during differentiation of 3T3-L1 cells into adipocytes. Data are means ± SEM, relative to day 0 (n = 3). (B) Effects of BRL 37344 or dexamethasone (DEX) on ZAG mRNA levels in 3T3-L1 adipocytes. Cells were taken at day 8 after induction of differentiation and incubated for 24 h with BRL 37344 (1μM) or dexamethasone (20 nM). ZAG mRNA levels were normalized to β-actin. Data are means ± SEM (n = 6); changes are relative to controls. *, P < 0.05; **, P < 0.01.
The lipolytic effect of ZAG in rodents appears to be mediated through the β3 adrenoreceptor (13). We next examined the effect of a selective β3-adrenoreceptor agonist, BRL 37344, on expression of the ZAG gene in 3T3-L1 adipocytes at day 8 after differentiation, when ZAG mRNA expression is close to maximal. The 3T3-L1 cells were incubated for 24 h in media containing BRL 37344 (1 μM), and ZAG mRNA levels were quantified by real-time RT-PCR. BRL 37344 treatment led to an 3.3-fold increase in ZAG mRNA levels, relative to untreated cells (Fig. 2B). The 3T3-L1 adipocytes were also incubated with dexamethasone (20 nM) for 24 h. Treatment with this synthetic glucocorticoid also caused a significant increase in ZAG mRNA levels, of nearly 5-fold (Fig. 2B).
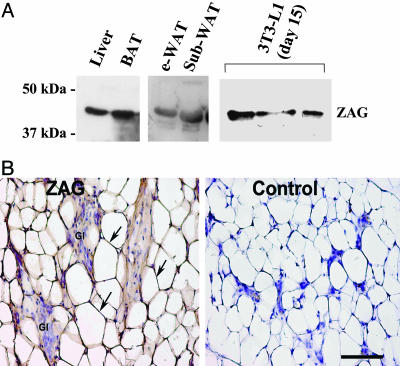
Expression of ZAG Protein by Mouse Adipose Tissue. To investigate whether the ZAG transcript is translated into protein in mouse adipocytes, immunoblotting was performed by using a ZAG Ab. ZAG immunoreactivity was detected in liver (positive control), WAT, BAT, and in 3T3-L1 cells at day 15 after differentiation (Fig. 3A). Immunohistochemical studies were also performed on adipose tissue within the mammary gland, and immunoreactivity for ZAG was detected in the cytoplasm of the adipocytes (Fig. 3B). Nerves and epithelial cells of the mammary gland were considered as internal negative controls. To test the specificity of the antisera, immunological reactions were performed in parallel with the liver of the same animal, and this test showed positive staining in hepatocytes in agreement with previous reports (5).
Fig. 3.
ZAG protein in mouse adipose tissue. (A) Western blots of ZAG in liver, brown and white fat, and 3T3-L1 adipocytes (day 15 after differentiation). e-WAT, epididymal WAT; sub, s.c.; BAT, interscapular brown adipose tissue. (B) Immunohistochemical detection of ZAG in mammary adipose tissue. The cytoplasmic rim of white adipocytes shows ZAG immunoreactivity, stained brown (arrows). Gl, glands; internal negative control. (Bar, 75 μmin A and B.)
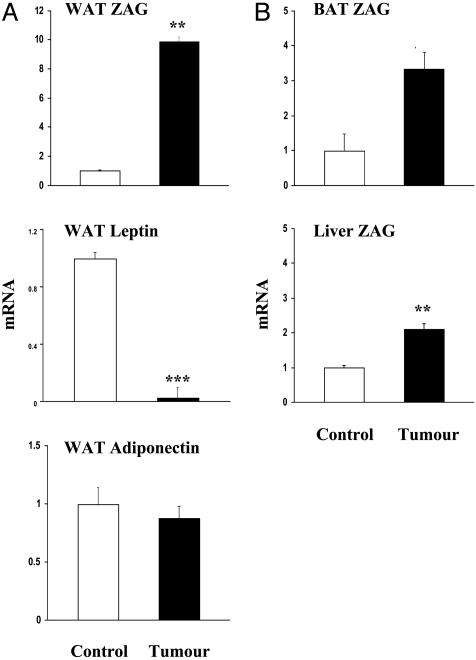
Up-Regulation of ZAG mRNA and Protein in Adipose Tissue of Tumor-Bearing Mice. To investigate whether adipocyte-derived ZAG could contribute locally to the substantially enhanced net lipolysis within adipose tissue in cancer cachexia, ZAG gene expression was analyzed in gonadal adipose tissue from mice bearing the MAC16 tumor- and non-tumor-bearing controls by real-time RT-PCR. After transplantation of the tumor, mice developed severe cachexia with a marked reduction in body weight (-19%) and fat mass (-61%) at day 16, relative to controls. Importantly, ZAG mRNA level in WAT was substantially increased (by 10-fold) in the cachectic mice compared to non-tumor-bearing controls (Fig. 4A). To determine whether this enhanced gene expression in cachexia is specific to ZAG, the leptin and adiponectin mRNA levels were quantified in the same samples of WAT. In contrast to ZAG, the leptin mRNA level was greatly suppressed (by 33-fold), whereas the adiponectin mRNA level was unchanged (Fig. 4A). Fig. 4B demonstrates that ZAG gene expression was also up-regulated in BAT (by 3.3-fold) and the liver (by 2.1-fold) in tumor-bearing animals, but the increase in liver was less than in white and brown fat.
Fig. 4.
ZAG mRNA levels in adipose tissues and liver of MAC16 tumor-bearing mice by real-time RT-PCR. mRNA levels were normalized to β-actin. (A) ZAG, leptin, and adiponectin mRNA in white fat relative to non-tumor-bearing mice. (B) ZAG mRNA levels in brown fat and liver. Data are means ± SEM (n = 8). **, P < 0.01; ***, P < 0.001.
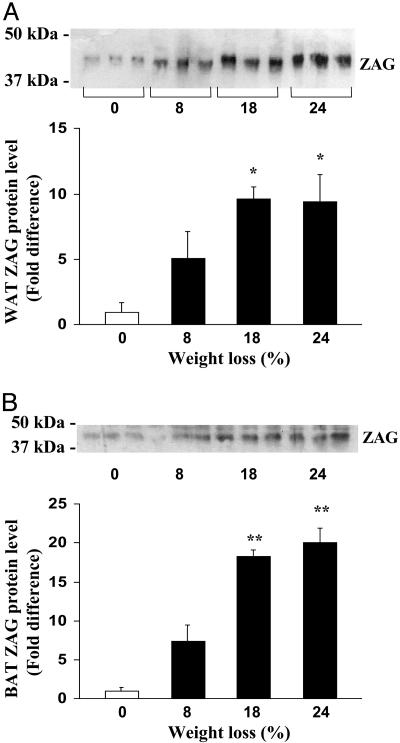
ZAG protein was measured in both WAT and BAT of control and cachectic mice by using a ZAG Ab. ZAG levels in WAT were substantially higher in tumor-bearing mice than in non-tumor-bearing controls; the increase of the protein in WAT (maximum nearly 10-fold) was related to the degree of weight loss (Fig. 5A). In BAT, ZAG protein content was also markedly increased in tumor-bearing mice, relative to non-tumor-bearing animals; again, there was an association between ZAG levels and the amount of weight loss (Fig. 5B).
Fig. 5.
ZAG protein in adipose tissues of MAC16 tumor-bearing mice by Western blotting. (A) Relative ZAG level in white fat from tumor-bearing mice with differing weight loss. (B) Relative ZAG level in brown fat from tumor-bearing mice. Data are means ± SEM (n = 3). Relative to non-tumor-bearing mice and expressed as percentage of weight loss. *, P < 0.05; **, P < 0.01.
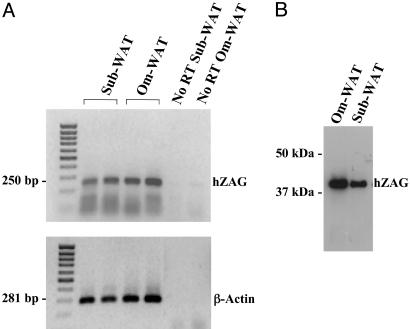
ZAG Expression in Human WAT. RT-PCR analysis of RNA isolated from human adipose tissue was performed by using a set of intron-spanning human ZAG primers. Both visceral and s.c. fat depots showed the presence of ZAG mRNA (Fig. 6A). The 250-bp PCR product was sequenced, and there was 100% homology with the corresponding region of human ZAG cDNA. ZAG immunoreactivity was also detected in human omental and s.c. WAT (Fig. 6B).
Fig. 6.
ZAG gene expression and protein in human omental and s.c. adipose tissues. (A) ZAG mRNA by RT-PCR. (B) Western blot of ZAG. Om, omental; sub, s.c.
Discussion
In the present study, we have demonstrated that ZAG, a tumor-related lipid mobilizing factor, is expressed locally by adipose tissue. ZAG gene expression was detected in white fat, in each of the major depots: epididymal, perirenal, s.c. and that associated with the mammary gland. The ZAG transcript was found in both the stromal vascular fraction and adipocytes, suggesting that ZAG is synthesized by preadipcytes or nonadipocyte cells, as well as by mature adipocytes. Further evidence that ZAG is expressed in mature adipocytes came from the studies on 3T3-L1 cells in which not only was ZAG mRNA present, but the levels increased markedly after differentiation, peaking between day 8 and 10 after differentiation. Using a ZAG Ab, ZAG protein was detected in both mouse WAT and 3T3-L1 cells. Moreover, immunoreactivity for ZAG was localized in the cytoplasm of the adipocytes, surrounding the surface of lipid droplets within the cell analogous to perilipin (20). Taken together, these findings indicate that ZAG is a protein factor of adipose tissue, which may be involved in the modulation of lipolysis in adipocytes.
ZAG gene and protein expression were examined in WAT from mice bearing the MAC16 tumor, a model of profound cachexia. Consistent with previous reports (21, 22), tumor-bearing mice displayed a marked reduction in body weight and fat mass after tumor transplantation. ZAG mRNA levels were strikingly increased in WAT of cancer cachectic mice, and furthermore, ZAG protein levels in the tissue were similarly elevated in tumor-bearing animals. The substantial upregulation of the expression and production of ZAG in adipose tissue in cancer cachexia contrasts with three major adipokines, leptin, resistin, and adiponectin, involved in the regulation of adiposity and insulin sensitivity (23–28).
Exogenous leptin reduces body fat in rodents (29, 30) and stimulates lipolysis in isolated adipocytes (31, 32). However, in the present study, leptin mRNA level was greatly decreased in WAT of cachectic mice, which is in agreement with previous reports that leptin gene expression in white fat and circulating leptin levels are markedly lower in mice bearing the MAC16 tumor (25) and in cachectic rats with Yoshida hepatoma (33). The fall in leptin production by adipose tissue seems to be the consequence of significant fat loss, which argues against a role for leptin in mediating enhanced lipolysis in cachexia. Resistin has been reported to inhibit adipocyte differentiation, thereby influencing adipogenesis (34). However, resistin gene expression is unaffected in WAT of mice with the MAC16 tumor (26), implying that resistin is not implicated in the fat mobilization elicited by the tumor. Similarly, adiponectin is unlikely to be involved in the cachetic response because the level of the mRNA in WAT was unchanged in tumor-bearing mice in the present study.
ZAG administration has been shown to markedly reduce body fat in both normal and ob/ob mice, and ZAG increases lipolysis in isolated mouse epididymal adipocytes (12). The overexpression of adipocyte-derived ZAG in cachectic mice observed in the current study appears specific, consistent with the possibility that ZAG may have a role in the local control of lipolysis, particularly with respect to the significant reduction of adiposity in cancer cachexia.
The present study also demonstrates that ZAG (mRNA and protein) is expressed in BAT, an important site of lipid utilization. BAT contributes to the regulation of energy homeostasis through UCP1, which uncouples mitochondrial respiration thereby generating heat instead of ATP (35). Our results demonstrate that tumor-bearing leads to significant increases in both mRNA and protein levels of ZAG in BAT, which would be consistent with a role for ZAG in the activation of BAT. We have observed that UCP1 mRNA level in BAT is increased in mice bearing the MAC16 tumor (22). Furthermore, ZAG has been shown to promote lipid utilization by means of up-regulation of BAT UCP1 mRNA and protein expression in normal mice (36) and stimulating oxygen uptake by isolated BAT (12). Increased BAT production of ZAG in cancer cachexia may have important implications for lipid mobilization and utilization within the tissue. In contrast to the two forms of adipose tissue, there was only a small increase in the level of ZAG mRNA in the liver of tumor-bearing mice.
The expression of ZAG mRNA by 3T3-L1 cells enables the regulation of ZAG gene expression to be studied in an adipocyte system in vitro. In exploratory studies, addition of the selective β3-agonist, BRL 37344, led to a marked increase in ZAG mRNA levels in 3T3-L1 adipocytes. This suggests that the sympathetic system may play a role in the regulation of ZAG expression, operating via β3-adrenoceptors, which are the dominant receptor type in the stimulation of lipolysis in rodent adipose tissue (37, 38). Interestingly, the potent lipolytic effect of ZAG itself has been suggested to be mediated through β3 adrenoceptors as the specific β3 antagonist SR59230A attenuates ZAG-induced lipolysis in white adipocytes of mice (13). However, whether the lipolytic effects of ZAG may also be mediated through β1 or β2 adrenoceptors, and whether β1 or β2 agonists influence ZAG expression are not known; this is clearly important in relation to the role of ZAG in human adipose tissue. Dexamethasone also markedly increased ZAG mRNA levels in 3T3-L1 adipocytes, indicating that glucocorticoids stimulate ZAG gene expression. The stimulatory effect of glucocorticoids on ZAG expression has also been reported in human breast cancer cells (39).
Consistent with the observations in the mouse, human adipose tissue was also found to express ZAG, ZAG mRNA, and protein being detected in both visceral and s.c. depots. Murine and human ZAG share up to 100% identity in specific regions hypothesized to be important in lipid metabolism (11) and ZAG has been shown previously to stimulate glycerol release from human adipocytes isolated from omental fat (12). Thus adipocyte-derived ZAG may act locally in the modulation of lipolysis in human as well as rodent adipose tissue and be involved in lipid loss in human cancer cachexia; however, this is unlikely to involve the β3 adrenoreceptor.
In conclusion, our data have demonstrated that ZAG is produced by WAT, both murine and human, and is also expressed in brown fat. Furthermore, ZAG mRNA and protein levels are markedly increased in adipose tissue of mice with cancer cachexia. These findings raise the possibility that ZAG could serve as a unique protein factor in the local modulation of lipid metabolism and contribute particularly to the substantial reduction of adiposity that occurs in cancer cachexia. We cannot, of course, exclude the possibility that the primary action of ZAG in lipolysis in adipocytes occurs intracellularly. Finally, ZAG may also influence the production of other adipokines because a very recent report has suggested that it stimulates the expression of adiponectin in transfected 3T3-L1 cells (16); this report also raised the possibility that ZAG is a candidate gene in the regulation of body weight.
Acknowledgments
We are grateful for the assistance of Mr. Leif Hunter, Dr. Claudia Oller do Nascimento, Dr. Bohan Wang, Dr. Steven Russell, Miss Andrea Davis, Mr. Wayne Fleary, and Dr. Steve Wong. This work was supported by the University of Liverpool Research and Development Fund, a Royal Society Research Grant, and the European Union.
Abbreviations: ZAG, zinc-α2-glycoprotein; WAT, white adipose tissue; BAT, interscapular brown adipose tissue; PB, phosphate buffer.
References
- 1.Dewys, W. D., Begg, C., Lavin, P. T., Band, P. R., Bennett, J. M., Bertino, J. R., Cohen, M. H., Douglass, H. O., Jr., Engstrom, P. F., Ezdinli, E. Z., et al. (1980) Am. J. Med. 69, 491-497. [DOI] [PubMed] [Google Scholar]
- 2.Tisdale, M. J. (2002) Nat. Rev. Cancer 2, 862-871. [DOI] [PubMed] [Google Scholar]
- 3.Warren, S. (1935) Am. J. Med. Sci. 184, 610-616. [Google Scholar]
- 4.Burgi, W. & Schmid, K. (1961) J. Biol. Chem. 236, 1066-1074. [PubMed] [Google Scholar]
- 5.Tada, T., Ohkubo, I., Niwa, M., Sasaki, M., Tateyama, H. & Eimoto, T. (1991) J. Histochem. Cytochem. 39, 1221-1226. [DOI] [PubMed] [Google Scholar]
- 6.Diez-Itza, I., Sanchez, L. M., Allende, M. T., Vizoso, F., Ruibal, A. & Lopez-Otin, C. (1993) Eur. J. Cancer 29, 1256-1260. [DOI] [PubMed] [Google Scholar]
- 7.Hale, L. P., Price, D. T., Sanchez, L. M., Demark-Wahnefried, W. & Madden, J. F. (2001) Clin. Cancer Res. 7, 846-853. [PubMed] [Google Scholar]
- 8.Brysk, M. M., Lei, G., Rajaraman, S., Selvanayagam, P., Rassekh, C. H., Brysk, H., Tyring, S. K. & Arany, I. (1997) In Vivo 11, 271-274. [PubMed] [Google Scholar]
- 9.Todorov, P. T., McDevitt, T. M., Meyer, D. J., Ueyama, H., Ohkubo, I. & Tisdale, M. J. (1998) Cancer Res. 58, 2353-2358. [PubMed] [Google Scholar]
- 10.Ueyama, H., Naitoh, H. & Ohkubo, I. (1994) J. Biochem. (Tokyo) 116, 677-681. [DOI] [PubMed] [Google Scholar]
- 11.Sanchez, L. M., Chirino, A. J. & Bjorkman, P. (1999) Science 283, 1914-1919. [DOI] [PubMed] [Google Scholar]
- 12.Hirai, K., Hussey, H. J., Barber, M. D., Price, S. A. & Tisdale, M. J. (1998) Cancer Res. 58, 2359-2365. [PubMed] [Google Scholar]
- 13.Russell, S. T., Hirai, K. & Tisdale, M. J. (2002) Br. J. Cancer 86, 424-428. [DOI] [PMC free article] [PubMed] [Google Scholar]
- 14.Trayhurn, P. & Beattie, J. H. (2001) Proc. Nutr. Soc. 60, 329-339. [DOI] [PubMed] [Google Scholar]
- 15.Guerre-Millo, M. (2002) J. Endocrinol. Invest. 25, 855-861. [DOI] [PubMed] [Google Scholar]
- 16.Gohda, T., Makita, Y., Shike, T., Tanimoto, M., Funabiki, K., Horikoshi, S. & Tomino, Y. (2003) Diabetes 52, 2175-2181. [DOI] [PubMed] [Google Scholar]
- 17.Haugen, F., Jorgensen, A., Drevon, C. A. & Trayhurn, P. (2001) FEBS Lett. 507, 105-108. [DOI] [PubMed] [Google Scholar]
- 18.Livak, K. J. & Schmittgen, T. D. (2001) Methods 25, 402-408. [DOI] [PubMed] [Google Scholar]
- 19.Hsu, S. M., Raine, L. & Fanger, H. (1981) J. Histochem. Cytochem. 29, 577-580. [DOI] [PubMed] [Google Scholar]
- 20.Greenberg, A. S., Egan, J. J., Wek, S. A., Garty, N. B., Blanchette-Mackie, E. J. & Londos, C. (1991) J. Biol. Chem. 266, 11341-11346. [PubMed] [Google Scholar]
- 21.Todorov, P., Cariuk, P., McDevitt, T., Coles, B., Fearon, K. & Tisdale, M. (1996) Nature 379, 739-742. [DOI] [PubMed] [Google Scholar]
- 22.Bing, C., Brown, M., King, P., Collins, P., Tisdale, M. J. & Williams, G. (2000) Cancer Res. 60, 2405-2410. [PubMed] [Google Scholar]
- 23.Zhang, Y., Proenca, R., Maffei, M., Barone, M., Leopold, L. & Friedman, J. M. (1994) Nature 372, 425-432. [DOI] [PubMed] [Google Scholar]
- 24.Steppan, C. M., Bailey, S. T., Bhat, S., Brown, E. J., Banerjee, R. R., Wright, C. M., Patel, H. R., Ahima, R. S. & Lazar, M. A. (2001) Nature 409, 307-312. [DOI] [PubMed] [Google Scholar]
- 25.Bing, C., Taylor, S., Tisdale, M. J. & Williams, G. (2001) J. Neurochem. 79, 1004-1012. [DOI] [PubMed] [Google Scholar]
- 26.Gomez-Ambrosi, J., Zabalegui, N., Bing, C., Tisdale, M. J., Trayhurn, P. & Williams, G. (2002) Horm. Metab. Res. 34, 674-677. [DOI] [PubMed] [Google Scholar]
- 27.Masaki, T., Chiba, S., Yasuda, T., Tsubone, T., Kakuma, T., Shimomura, I., Funahashi, T., Matsuzawa, Y. & Yoshimatsu, H. (2003) Diabetes 52, 2266-2273. [DOI] [PubMed] [Google Scholar]
- 28.Yamauchi, T., Kamon, J., Waki, H., Terauchi, Y., Kubota, N., Hara, K., Mori, Y., Ide, T., Murakami, K., Tsuboyama-Kasaoka, N., et al. (2001) Nat. Med. 7, 941-946. [DOI] [PubMed] [Google Scholar]
- 29.Levin, N., Nelson, C., Gurney, A., Vandlen, R. & de Sauvage, F. (1996) Proc. Natl. Acad. Sci. USA 93, 1726-1730. [DOI] [PMC free article] [PubMed] [Google Scholar]
- 30.Chen, G., Koyama, K., Yuan, X., Lee, Y., Zhou, Y. T., O'Doherty, R., Newgard, C. B. & Unger, R. H. (1996) Proc. Natl. Acad. Sci. USA 93, 14795-14799. [DOI] [PMC free article] [PubMed] [Google Scholar]
- 31.Fruhbeck, G., Aguado, M. & Martinez, J. A. (1997) Biochem. Biophys. Res. Commun. 240, 590-594. [DOI] [PubMed] [Google Scholar]
- 32.Wang, M. Y., Lee, Y. & Unger, R. H. (1999) J. Biol. Chem. 274, 17541-17544. [DOI] [PubMed] [Google Scholar]
- 33.Lopez-Soriano, J., Carbo, N., Tessitore, L., Lopez-Soriano, F. J. & Argiles, J. M. (1999) Int. J. Cancer 81, 726-729. [DOI] [PubMed] [Google Scholar]
- 34.Kim, K. H., Lee, K., Moon, Y. S. & Sul, H. S. (2001) J. Biol. Chem. 276, 11252-11256. [DOI] [PubMed] [Google Scholar]
- 35.Ricquier, D. & Bouillaud, F. (2000) Biochem. J. 345, 161-179. [PMC free article] [PubMed] [Google Scholar]
- 36.Bing, C., Russell, S. T., Beckett, E. E., Collins, P., Taylor, S., Barraclough, R., Tisdale, M. J. & Williams, G. (2002) Br. J. Cancer 86, 612-618. [DOI] [PMC free article] [PubMed] [Google Scholar]
- 37.Arch, J. R. & Wilson, S. (1996) Biochem. Soc. Trans. 24, 412-418. [DOI] [PubMed] [Google Scholar]
- 38.Arch, J. R. (2001) Rev. Endocr. Metab. Disord. 2, 385-393. [DOI] [PubMed] [Google Scholar]
- 39.Lopez-Boado, Y. S., Diez-Itza, I., Tolivia, J. & Lopez-Otin, C. (1994) Breast Cancer Res. Treat. 29, 247-258. [DOI] [PubMed] [Google Scholar]


