Abstract
Fluorescence is a mainstay of bioanalytical methods, offering sensitive and quantitative reporting, often in multiplexed or multiparameter assays. Perhaps the best example of the latter is flow cytometry, where instruments equipped with multiple lasers and detectors allow measurement of 15 or more different fluorophores simultaneously, but increases beyond this number are limited by the relatively broad emission spectra. Surface enhanced Raman scattering (SERS) from metal nanoparticles can produce signal intensities that rival fluorescence, but with narrower spectral features that allow a greater degree of multiplexing. We are developing nanoparticle SERS tags as well as Raman flow cytometers for multiparameter single cell analysis of suspension or adherent cells. SERS tags are based on plasmonically active nanoparticles (gold nanorods) whose plasmon resonance can be tuned to give optimal SERS signals at a desired excitation wavelength. Raman resonant compounds are adsorbed on the nanoparticles to confer a unique spectral fingerprint on each SERS tag, which are then encapsulated in a polymer coating for conjugation to antibodies or other targeting molecules. Raman flow cytometry employs a high resolution spectral flow cytometer capable of measuring the complete SERS spectra, as well as conventional flow cytometry measurements, from thousands of individual cells per minute. Automated spectral unmixing algorithms extract the contributions of each SERS tag from each cell to generate high content, multiparameter single cell population data. SERS-based cytometry is a powerful complement to conventional fluorescence-based cytometry. The narrow spectral features of the SERS signal enables more distinct probes to be measured in a smaller region of the optical spectrum with a single laser and detector, allowing for higher levels of multiplexing and multiparameter analysis.
Keywords: Nanoparticle, Multiplex, Multiparameter, Plasmonics, Spectroscopy, Probe
1. Introduction
Multiparameter analysis of single cells has been a key tool in our understanding of complex cell systems such as the hematopoietic and immune systems, and in our understanding of cancer and immune responses. For highly multiparameter measurements, flow cytometry is the platform of choice with high end instruments capable of measuring more than 15 different fluorescent probes simultaneously on individual cells at rates of hundreds to thousands of cells per second [1]. Significant increases in the numbers of probes that can be measured by flow cytometers are limited by the relatively broad emission spectra of fluorescent probes, available light sources and detectors, and the complexity of instrument design [2]. Recently Raman scattering, and surface enhanced Raman scattering (SERS) in particular, has attracted interest for cytometry applications owing to several unique properties, including narrow spectral features, which provide the possibility of higher levels of multiplexing in a narrow spectral window [3]. In this overview, we discuss the reagents, instrumentation, and analysis methods involved in SERS cytometry.
2. Surface enhanced Raman scattering (SERS) tags
At the center of SERS cytometry is the SERS tag, a nanoparticle label for antibodies or other recognition ligands. While Raman spectroscopy is widely used in analytical chemistry, its routine application in biology has been limited because of the very weak intensity of Raman scattering, which is millions of times less efficient than fluorescence. This has changed in recent years with the harnessing of plasmonic particles that, when excited with an appropriate wavelength of light, can increase the intensity of Raman scattering of adsorbed compounds more than a million fold, to the point where SERS signals can be as bright as fluorescence. This has led to the notion of developing SERS tags, nanoparticles with distinct spectral signatures, for use in multiplexed and multiparameter analysis [4,5].
2.1. Components of a SERS tag
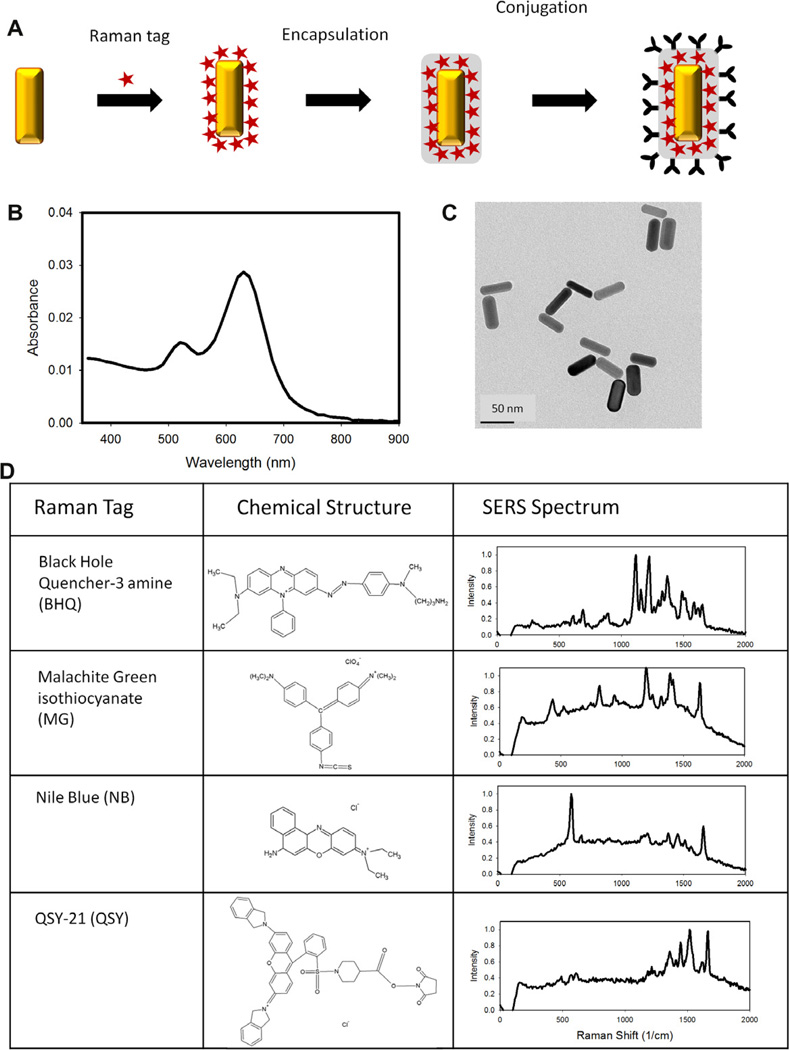
A SERS tag is a multi-component construction (Fig. 1A) that is engineered to give the desired optical properties for a particular application. The heart of the SERS tag is the plasmonic nanoparticle that develops a surface plasmon resonance when illuminated with the appropriate wavelength of light. These are generally metal nanoparticles, most often gold or silver, with unpaired electrons whose oscillations comprise the plasmon resonance. Several different types of nanoparticles can be used to prepare SERS tags including nanospheres [6–8], nanoshells [9,10], nanostars [11,12] and others [12–14], and the size and shape can determine the resonance, or excitation, wavelength. In this paper we focus on our recent work with red-resonant gold nanorods [15,16].
Fig. 1.
Schematic of nanoparticle-based SERS tags and their characteristic spectra. (A) SERS tags are typically comprised of a plasmonic nanoparticle, Raman tag, surface coating, and targeting entity. (B) The SERS tag excitation is determined largely by the plasmon resonance wavelength of the plasmonic nanoparticle, which can be tuned by altering the composition, size, and shape of the nanoparticle. (C) Gold nanorods 25 nm × 50 nm have a plasmon resonance in the red. (D) The Raman tag is adsorbed to the nanoparticle surface and gives each SERS tag its characteristic SERS spectrum.
The unique spectral signature of a SERS tag is conferred by some Raman-active compound adsorbed to the surface of the metal nanoparticle. While many compounds will adsorb to the metal surface and give distinctive SERS, the brightest SERS tags are produced using compounds that are themselves resonant at the excitation wavelength. Such surface enhanced resonance Raman scattering (SERRS) can result in signals that are 100 or more times brighter than a non-resonant compound. For the red resonant rods described below, we choose Raman tags that also have a strong absorbance in the red.
Once the Raman tag is adsorbed to the metal nanoparticle, the complex is generally encapsulated to provide stability as well as a surface for conjugation. A variety of encapsulation strategies have been described in the literature, including glass [7,17], polymer, and protein [8,18]. We have taken advantage of well-characterized PEG encapsulation methods [16,19] which stabilize the nanoparticle-Raman tag complex, passivate the surface to minimize nonspecific binding to cells, and provide a functional group for bioconjugation to antibodies or other targeting molecules.
2.2. SERS tags preparation
Red resonant gold nanorods are prepared essentially as reported by Smith et al. [20]. All reagents are from Sigma–Aldrich. Nanopure, 25 nm filtered water is used in all experiments. Glass-ware and stir bars are washed sequentially in acid and base baths and rinsed thoroughly.
Gold seed is prepared by adding 1 mL of a 0.5 mM HAuCl4 solution to 2 mL of an aqueous hexadecyltrimethyl ammonium bromide (CTAB) solution (0.1 M). To the vigorously stirred solution, 0.12 mL of 0.01 M ice cold NaBH4 is added to produce a light-brown solution. Stirring is continued for 2 more minutes, after which the seed solution is kept in a water bath at 25 °C for up to 2 h.
To grow rods, 500 mL of a 0.1 Maqueous CTAB solution is mixed with 5 mL AgNO3 at 0.004 M. Then, 250 mL of 0.001 M HAuCl4 is added. After gentle mixing, 3.5 mL of 79 mM l-ascorbic acid is added, and the solution incubated in a 27 °C water bath. After 10 min, the solution is removed from the water bath and 600 µL of the seed solution is added and stirred for 2 min. The solution is then placed back in the 27 °C water bath for 24 h. After fabrication, excess CTAB is decanted and the rods are washed twice by two cycles of centrifugation (10 min at 5000×g) and resuspension in np H2O.
To prepare SERS tags, nanorods are incubated with 32 µM HCl at 60 °C for 1.5 h to remove CTAB, and then washed twice. Raman tag at an appropriate concentration (determined beforehand via titration) is added and incubated with the nanorods for 30 min at ambient temperature. Functionalized sulfhydral PEG (500 nM, carboxylated or biotinylated, 3000 MW, Rapp Polymer) is then added and incubated with the tagged nanorods for 15 min at ambient temperature, and then overnight at 4 °C. This is followed by addition of 5 µM unfunctionalized sulfhydral PEG (2000 MW, Nanocs) for 1 h at 4 °C. The SERS tags are then washed three times and characterized by electron microscopy and UV/Vis and Raman spectroscopy.
2.3. SERS tag characterization and conjugation
SERS tags have a characteristic UV/Vis extinction spectrum (Fig. 1B) where peaks are due to absorption and/or scattering by the nanoparticles’ size and shape-dependent surface plasmon resonance. The gold nanorods described here are ~20 × 50 nm (Fig. 1C), and have a resonance wavelength of ~660 nm. The SERS spectra are measured in a Raman spectrometer with an appropriate laser, laser blocking filter and grating. The red-excited SERS tags described here were measured with 633 nm (~10 mW) or 660 nm (~20 mW) excitation. Spectra from SERS tags prepared using four different Raman compounds are presented in Fig. 1D.
Antibodies or other targeting molecules bearing free amines can be attached to carboxylated SERS tags by carbodiimide coupling. In a typical reaction, 10 µg of protein is added to 1000 µl (OD420 1.0) of nanorods and incubated for 20 min at ambient temperature. Carboxyl groups are then activated by addition of 1 mM EDAC and 3 mM sulfo N-hydroxysuccinimide in MES buffer (pH 6). After overnight incubation at RT, the SERS tags are washed three times to remove unconjugated antibody and stored at 4 °C.
2.4. Summary and prospects
Several features distinguish SERS tags from other optical tags such as fluorescence labels. First they have very narrow spectral features compared to fluorophores. Second, their excitation wave-length can be adjusted by tuning the plasmon resonance wave-length of the nanoparticle core. Third, while the fluorescence emission spectrum is generally independent of the excitation wavelength, SERS emission is always at a constant frequency shift (expressed in wave numbers) from the excitation wavelength. Finally, SERS tags are photostable relative to many fluorescent dyes, making them attractive for imaging applications. SERS tags, how-ever, do have some potential disadvantages. First, they are large compared to conventional organic fluorophores, making them less attractive for measurements requiring very high spatial resolution or for tagging biomolecules whose activity might be impaired by conjugation to a bulky nanoparticle. Second, high quality SERS tags are not currently commercially available, and must be fabricated in-house. Robust calibration and standardization procedures do not yet exist, making it difficult to compare results across labs or measurement platforms. However, all of these latter issues can be addressed, and the advantages of dense spectral multiplexing, brightness, and photostability justify such an effort.
3. SERS flow cytometry
Flow cytometry is well known for its ability to measure signals from several fluorophores simultaneously on single cells. High end instruments use multiple lasers and detectors to measure signals from as many as 17 different fluorophores simultaneously [1]. However, it is recognized that significant increases beyond this number are limited by the availability of appropriate light sources, detectors, and fluorescent dyes with broad emission spectra [2,3]. The high spectral density of SERS scattering spectra offer an alternative or complement to fluorescence, by allowing many different SERS tags to be identified using a relatively small region of the spectrum. In this case of the red-excited SERS tags described above, as many as 10 different labels can be encoded in less than 100 nm of spectral space. To implement this in a flow based platform, SERS cytometry employs a spectral flow cytometer, a flow cytometer capable of capturing the complete emission spectra of single particles as they flow through the laser beam.
3.1. Instrumentation
A number of different designs for spectral flow cytometers have been used over the years for both fluorescence [21,22] and Raman [10,23,24] spectral flow cytometry. To capture the relatively broad emission spectra of fluorescent probes, prisms or broad band gratings have been used in conjunction with multianode PMTs, which can measure as many as 32 spectral bands [22]. To capture the much more narrow features of Raman scattering spectra, high resolution narrow band gratings are used to disperse light over a high density array detector such as a CCD, allowing hundreds of discrete spectral bands corresponding to less than a nanometer each to be captured [23].
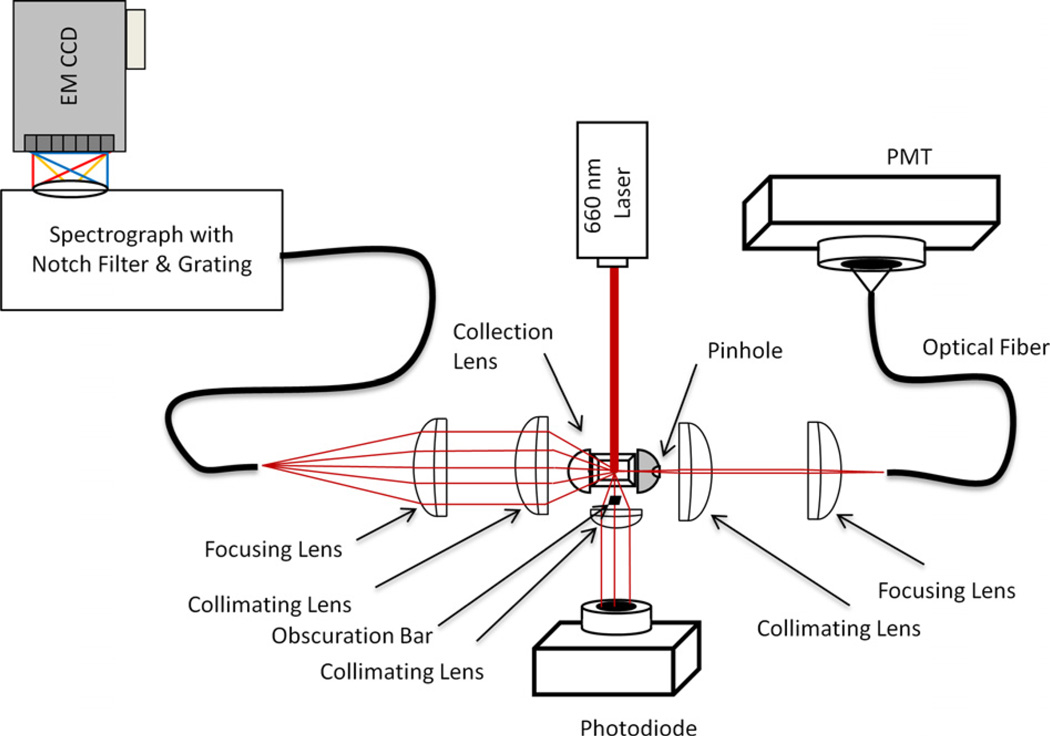
Presented in Fig. 2 is a schematic of a Raman flow cytometer, whose construction and operation have been described in detail earlier [23]. In brief, the instrument uses a standard quartz flow cell with a square flow channel coupled to collection optics that focus scattered light to appropriate optics and detectors. In this arrangement, elastically scattered light at the excitation wavelength is detected at small angles (forward angle light scatter, or FALS) by an amplified photodiode (PD100A, ThorLabs) and in the orthogonal direction (90° or side scatter, SSC) by a PMT (Hamamatsu R3896) via an optical fiber (600 µm multimode), and used to signal the presence of a particle. Inelastic Raman scattering is collected from the opposite side of the flow cell, focused into a spectrograph (Kaiser HoloSpec) containing a notch or edge filter, which blocks the exciting light, and a grating, which disperses the light across the face of a rectangular CCD chip (Andor Newton).
Fig. 2.
Schematic of a Raman flow cytometer. Excitation is provided by a solid state laser (660 nm, 400 mW) and forward angle light scatter is collected on a photodiode. Ninety degree light scatter is collected from one side of the flow cell via an optical fiber and detected with a photomultiplier tube (PMT). SERS signals are collected from the opposite side of the flow cell into and optical fiber and delivered to an imaging spectrograph coupled to a CCD detector. Particles in the probe volume are detected by forward and side scatter, which trigger the acquisition of individual particle spectra by the CCD.
When the data acquisition is triggered by signal pulse exceeding a threshold set on either the FALS or SSC channels, a signal is sent to the camera to acquire an exposure of a duration matched to the signal pulse width. The image of the particle spectra produced by the spectrograph is captured on the CCD chip within a predefined region of interest, where it is binned to one pixel high in the vertical axis and to several hundred pixels in the horizontal axis, before being read out to the data file.
3.2. Data processing and analysis
In fluorescence flow cytometry, single dye-stained cells or beads are used as compensation reference standards to allow the signal from each fluorophore in a multi-color staining panel to be accurately determined for individual cells. In SERS flow cytometry, single SERS tag-stained particles are used to obtain reference spectra for spectral unmixing to determine the amount of each SERS tag associated with an individual cell.
Spectral data poses a new challenge to the flow cytometry data analysis work flow. While the popular FCS standard data format readily handles discrete values from multiple parameter measurements, it is not well suited to the continuous data generated in the spectral flow cytometer. Our initial approach was to consider each spectral data point as a discrete parameter to create a 300+ parameter data file. While this approach was compatible with the FCS standard, it was inefficient and ignored the continuous nature of the spectral data and limited options for analysis and display.
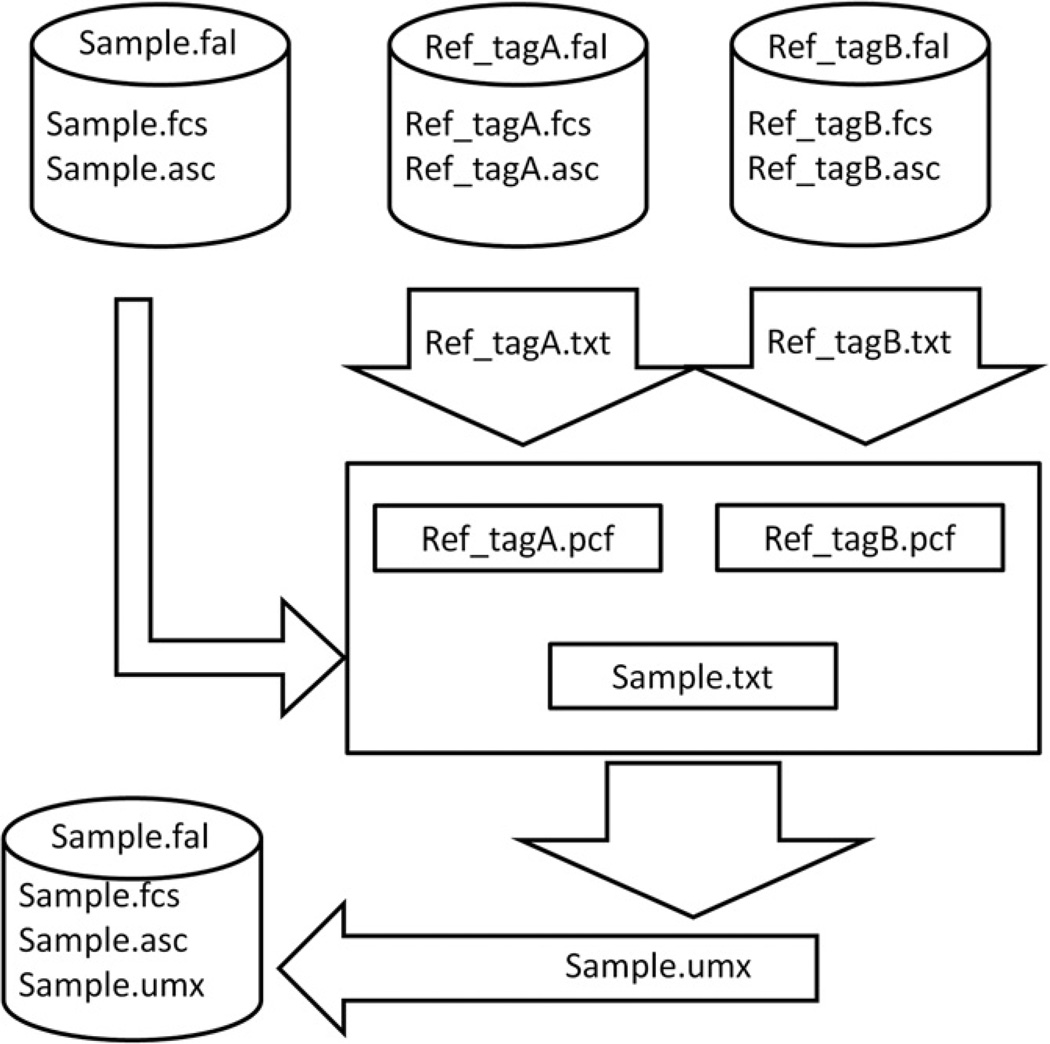
Our solution (Fig. 3) was to develop a hybrid file type based on a zip file that contained the original FCS file of discrete measurements such as light scatter and PMT-based fluorescence measurements, a text file of spectral data for each event, and a text file with the results of post-acquisition spectral analyses. This data file format allows us to integrate the conventional flow cytometry data with both the spectra and data derived from the spectra via processes such as spectral unmixing.
Fig. 3.
Schematic of the Raman flow cytometry data analysis workflow. Raman flow cytometry produces both conventional flow cytometry measurements such as forward and ninety degree light scatter (Sample.fcs), as well as complete SERS spectra from each particle (Sample.asc), which are bundled in a container file (Sample.fal). Data from beads labeled with a single tag (Ref_tagA.fal and Ref_tagB.fal) are analyzed to give reference spectra (Ref_tagA.txt and Ref_tagB.txt) that are used for spectral unmixing of the unknown sample spectra (Sample.txt). Spectral unmixing estimates the contribution of each tag to the unknown sample spectra for each particle. The amount of each tag on each particle in the sample (Sample.umx) is then saved as part of the Sample.fal file for analysis as a conventional flow cytometry parameter.
In a Raman flow cytometry measurement, data acquisition produces a FCS format file (Sample.fcs) containing the conventional flow cytometry parameter data and a file of spectral data that is exported in ascii text format (Sample.asc). If desired, the system background spectrum of the instrument, which is measurable but invariant, can be subtracted to produce a background-subtracted spectral file. The fcs and asc files are then combined into a ZIP container file (Sample.fal) that can be read by the data analysis software. A customized version of the popular commercial flow cytometry analysis software FCS Express (De Novo Software) has been developed that can read this format, display spectra and perform some spectral analysis, export the data for offline spectral analysis, and display the results of that analysis.
We perform spectral unmixing using a classical least squares fitting routine implemented in MatLab. Unknown mixture spectra are fit to a combination of the single stained reference spectra (Ref_tagn.pcf) plus a background component estimated by a polynomial function. The optimal weightings for each tag that results in the lowest residual error is calculated for each event (single particle spectrum) and is written to the unmixing results file (Sample.umx) along with a parameter, FitError, which provides a measure of the goodness of fit. These results are incorporated into the Sample.fal file, which now contains the conventional flow cytometry data, the spectral data, and the unmixed contributions of each tag as new parameters. It is also possible to save these data, without the spectral information, in an fcs format file that can be read by a number of different flow cytometery analysis programs. These data can now be analyzed in a conventional flow cytometry work flow, with gating and intensity measurements performed on both the conventional flow cytometry parameters and the SERS tag intensity parameters.
4. Application examples
The use of SERS tags in flow cytometry involves many of the same considerations as for fluorescence probes. Multiparameter measurements require the use of singly-stained samples that serve as reference spectra for spectral unmixing, the spectral analogue of compensation in conventional flow cytometery. Similar to fluorescence flow cytometry, capture beads are useful as single stained controls as well as calibration standards in SERS flow cytometry. Also similar to fluorescence flow cytometry, SERS tags can be used as reporters, for example in the antibody staining of cell surface receptors, or as encoders, as for particle or cell encoding in multiplexed assays. Here we illustrate these aspects of SERS flow cytometry.
4.1. Reference samples
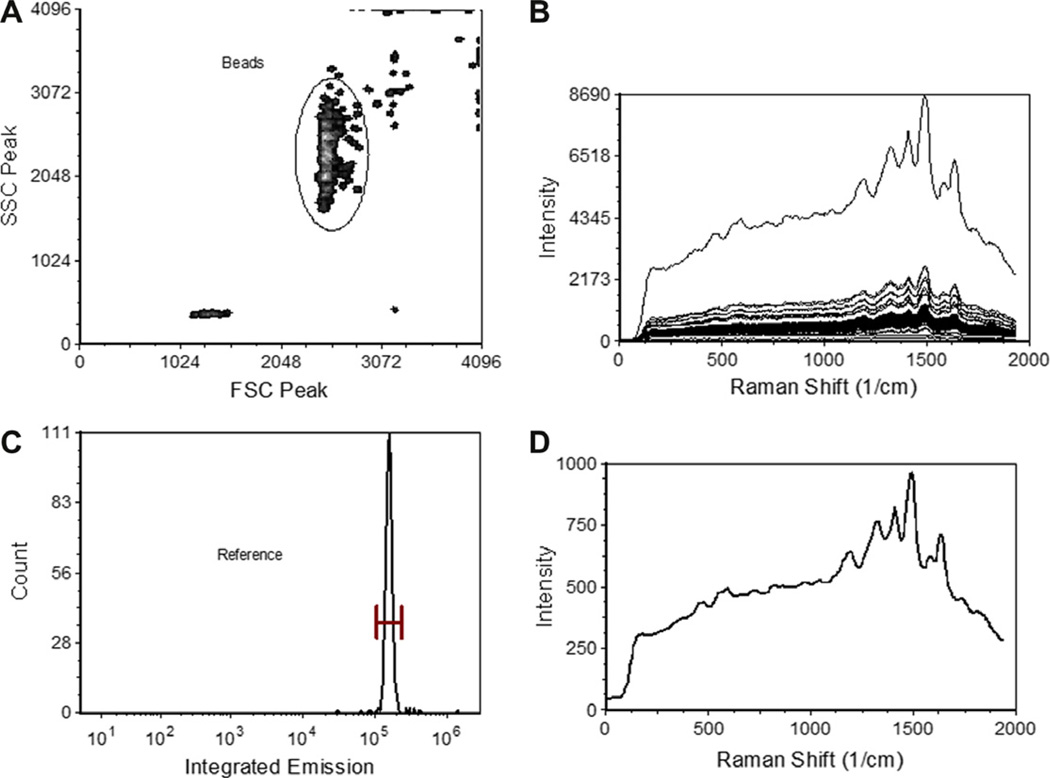
In a typical Raman flow cytometry application, beads stained with single SERS tags are used to collect reference spectra for use in unmixing experimental samples that are stained with mixtures of SERS tags. To do this, the data from the single stained beads are first analyzed to gate out debris, doublets and other spurious events (Fig. 4A), and the spectra corresponding to single beads stained with a single SERS tag (Fig. 4B and C) are exported to a text file (Tag_A.txt) from which a pure component file (*.pcf) containing the average or typical reference spectra (Fig. 4D). This process is repeated for each different SERS tag in a multiparameter experiment to generate the reference spectra for use in spectral unmixing as described above and below.
Fig. 4.
Generation of SERS flow cytometry reference spectra. To generate SERS reference spectra for use in spectral unmixing, light scatter gating (A) is used to identify single beads stained with SERS tag, allowing the spectra of individual beads to be inspected (B). The total integrated spectral emission can then be gated to remove outliers (C) and the average spectra determined (D).
4.2. Calibration
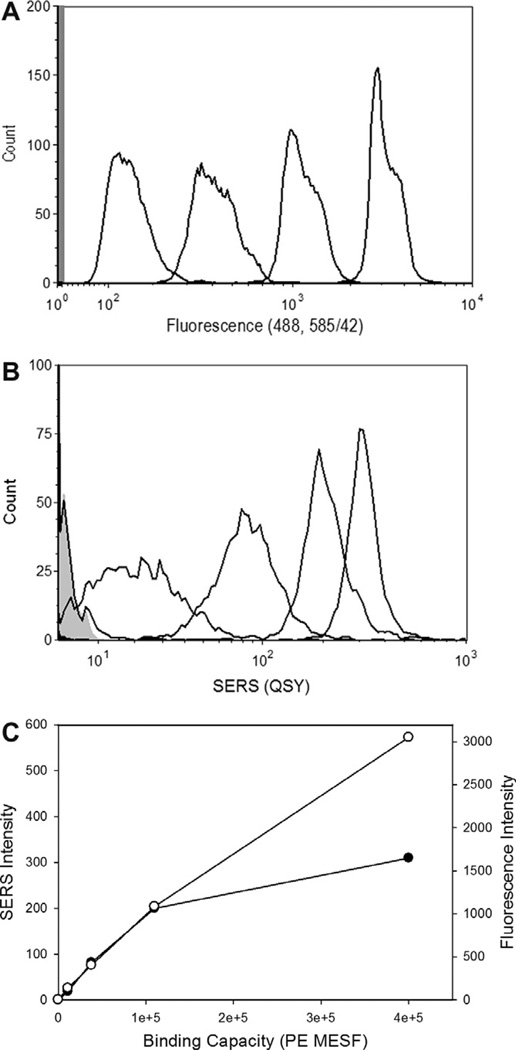
The process and performance of SERS flow cytometry is best demonstrated using polymer microspheres, which provide a uniform and controlled platform for analysis. Microspheres bearing neutravidin were prepared and incubated with biotinylated SERS tags. After light scatter-based gating (Fig. 4A), the SERS spectra of each single bead can be inspected (Fig. 4B) and the population distribution of intensities determined (Fig. 4C). To evaluate the sensitivity and dynamic range of the SERS measurements, microspheres can be prepared with different amounts of neutravidin, and characterized using biotinylated-phycoerythrin (b-PE) (Fig. 5A). When this calibrated bead set is stained with biotinylated SERS tag (Fig. 5B), we find that the dimmest bead (with 11,000 b-PE binding sites) is readily resolved from a blank bead and that SERS intensity increases linearly with binding capacity up to ~100,000 b-PE binding sites, at which point binding saturates, presumably due to steric hindrance from the relatively large nanoparticle tags competing for physical space on the bead surface (Fig. 5C). the CVs of the SERS-tagged stained beads were approximately twice those of the PE-stained beads, and are also likely an effect of the larger size of the SERS tags compared to the much smaller fluorophore. These results demonstrate the sensitivity and useful dynamic range of these SERS tags, as well as an approach to calibrating the SERS measurement.
Fig. 5.
SERS intensity calibration. Microspheres bearing different amounts of neutravidin were prepared and stained with saturating concentrations of biotin-phycoerythrin or biotin SERS tag and analyzed by conventional flow cytometry or SERS flow cytometry, respectively. (A) Fluorescence intensity histograms of beads bearing different amounts of neutravidin stained with b-PE. (B) SERS intensity histograms of SERS tag stained beads. (C) Calibration curves of fluorescence (open circles) and SERS (closed circles) median intensity as a function of bead binding capacity.
4.3. Cell surface receptor staining
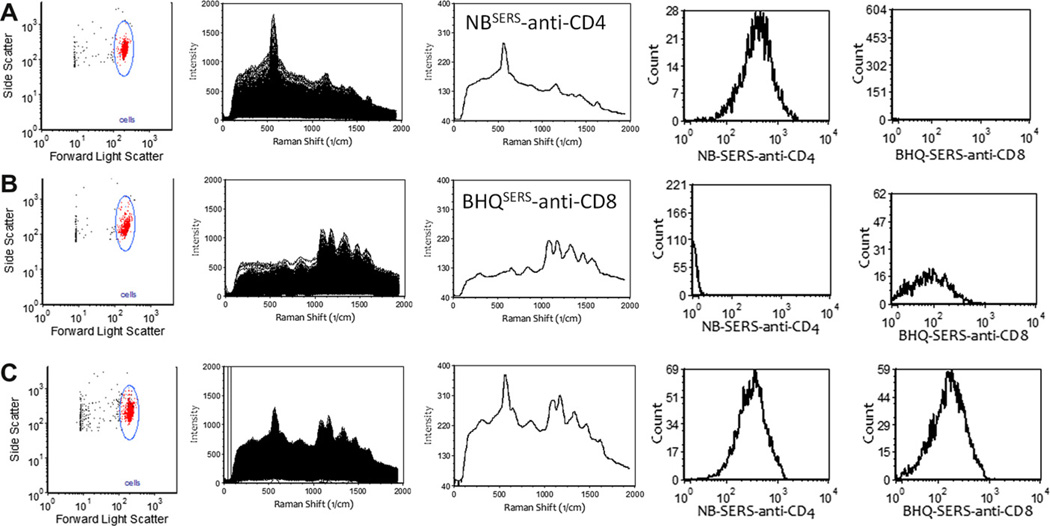
Perhaps the most common class of applications for conventional fluorescence flow cytometry is the staining of cell surface receptors, and performed in immunophenotyping of immune cells for example. SERS tags can be used as tags for antibodies in cell surface receptor staining as well. As an example, we conjugated anti-CD4 and anti-CD8 antibodies to two different carboxylated SERS tags and used these to stain a cultured cell line (SupT1) that expressed both receptors. Stained cells and the appropriate reference controls were analyzed using a Raman spectral flow cytometer and spectral unmixing performed as described above. Presented in Fig. 6A and B are light scatter gating, individual cell and average spectra, and single parameter SERS intensity histograms for singly stained beads. Presented in Fig. 6C are data from cells stained with both SERS tags, illustrating the ability of SERS flow cytometry hard-ware and software to measure the amount of SERS-tagged anti-body to cell surface receptors.
Fig. 6.
Cell surface immunostaining with antibody-coupled SERS tags. A cultured cell line (SupT1) was stained with (A) and anti-CD4 SERS tag, (B) and anti-CD8 SERS tag, or (C) both, and analyzed by Raman flow cytometry. Presented are light scatter histograms with single cell gating, individual and average spectra of gated cells, and single parameter histograms of the contributions of each SERS tags after spectral unmixing.
4.4. Particle encoding
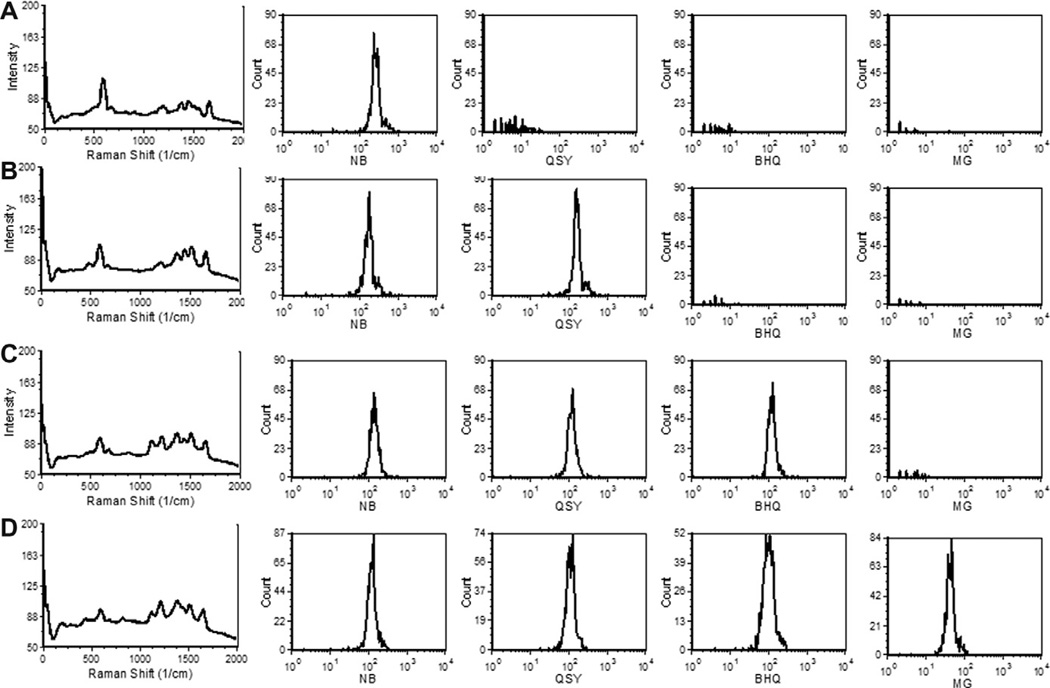
A chief advantage of the narrow spectral features of SERS tags is the possibility for multiplexed measurements, where the contributions of each spectrally-distinct tag to the measured spectra are determined by spectral unmixing. This has implications not only for multiparameter reporter applications, as illustrated above, but also for encoding applications such as multiplexed bead arrays [25] and cell barcoding [26]. In these applications, SERS tags would be used in combinations to confer a unique SERS code to distinct subsets of particles, such that they could later be identified. To evaluate the ability SERS flow cytometry identify barcodes composed of combinations of SERS tags bound to individual particles, we incubated neutravidin beads with one, two, three, or four different SERS tags and measured the SERS spectra for several hundred individual beads by Raman flow cytometry. The reference spectra from beads stained with only one of each of the four SERS tags was used to generate reference spectra for the unmixing process. Presented in Fig. 7 are the spectra from beads stained with one, two, three or four SERS tags, and the intensity histograms for the contributions of each tag. The combination of spectral flow cytometry and least squares unmixing allows the contributions of all four SERS tags to be detected with little non-specific signal, demonstrating the feasibility of multiplexed particle encoding using SERS tags and spectral flow cytometry.
Fig. 7.
Particle encoding with multiple SERS tags. Avidin beads were stained with different combinations of four different SERS tags and analyzed by Raman flow cytometry. (A) Beads stained with NB SERS. (B) Beads stained with NB SERS and QSY SERS. (C) Beads stained with NB SERS, QSY SERS, and BHQ SERS. (D) Beads stained with NB SERS, QSY SERS, BHQ SERS, and MG SERS. Presented are the average SERS spectra and histograms of the population distributions of unmixed contributions of each tag.
5. Future prospects and concluding remarks
Many important cytometry applications involve the simultaneous measurement of many molecules or cellular features on single cells. A recent focus of cytometry instrument, reagent, and software development is to support higher levels of multiplexed and multiparameter analysis. While fluorescence probes tend to have fairly broad emission spectra, which limit the number of fluorophores that can be measured simultaneously, nanoparticle SERS tags have much narrower spectral features, which will allow for higher number of probes to be resolved within a defined region of spectral space.
The detection of SERS tags by Raman flow cytometry expands the possibilities for multiparameter cell analysis. We have shown that SERS tags can serve as labels for antibodies or other targeting molecules and achieve performance comparable to fluorescence labels. More importantly, SERS tags have very narrow spectral features that allow multiple tags to be resolved in a limited region of spectral space. Here we illustrate the detection of four different SERS tags on a single particle, and the development of many more SERS tags with unique spectral signatures is readily achieved [6,16–19,27]. In addition, these advantages of SERS detection are also attractive for imaging based systems [28–30].
While SERS tags have potential advantages as labels for antibodies or other ligands, fluorescent dyes serve many more uses that SERS tags cannot, including pH or ion sensing, enzyme substrates, viability dyes, and others. For either flow or image cytometry, it is feasible to consider integrating fluorescence detection with SERS detection. For example, in a multilaser system, violet and blue excitation could be used to excite a number of popular fluorescent dyes, while red- or NIR-excitation could be used to excite a set of SERS tags. Such a multimodal cytometry approach would combine the versatility of fluorescence probes with the multiplexing capability of SERS probes. This next generation of fluorescence/Raman flow cytometers is currently under development in our lab.
Acknowledgements
This work was supported by Grant R01EB003824 from the National Institute of Biomedical Imaging and Bioengineering, National Institutes of Health. We thank David Novo (De Novo Software) for modifying FCS Express to support spectral flow cytometry data analysis, Mark Naivar (Darkling X) for the development of custom flow cytometry data systems to facilitate spectral flow cytometry, and Scott Norton (Kiara Biosystems) for assistance with spectral unmixing algorithms.
References
- 1.Perfetto SP, Chattopadhyay PK, Roederer M. Nat. Rev. Immunol. 2004;4:648–655. doi: 10.1038/nri1416. [DOI] [PubMed] [Google Scholar]
- 2.Chattopadhyay PK, Hogerkorp CM, Roederer M. Immunology. 2008;125:441–449. doi: 10.1111/j.1365-2567.2008.02989.x. [DOI] [PMC free article] [PubMed] [Google Scholar]
- 3.Nolan JP, Sebba DS. In: Methods in Cell Biology. Paul M, editor. Academic Press; 2011. pp. 515–532. [DOI] [PMC free article] [PubMed] [Google Scholar]
- 4.Doering WE, Piotti ME, Natan MJ, Freeman RG. Adv. Mater. 2007;19:3100–3108. [Google Scholar]
- 5.Alvarez-Puebla RA, Liz-Marzán LM. Small. 2010;6:604–610. doi: 10.1002/smll.200901820. [DOI] [PubMed] [Google Scholar]
- 6.Mulvaney SP, Musick MD, Keating CD, Natan MJ. Langmuir. 2003;19:4784–4790. [Google Scholar]
- 7.Nie S, Emory SR. Science. 1997;275:1102–1106. doi: 10.1126/science.275.5303.1102. [DOI] [PubMed] [Google Scholar]
- 8.Su X, Zhang J, Sun L, Koo TW, Chan S, Sundararajan N, Yamakawa M, Berlin AA. Nano Lett. 2005;5:49–54. doi: 10.1021/nl0484088. [DOI] [PubMed] [Google Scholar]
- 9.Oldenburg SJ, Westcott SL, Averitt RD, Halas NJ. J. Chem. Phys. 1999;111:4729. [Google Scholar]
- 10.Sebba DS, Watson DA, Nolan JP. ACS Nano. 2009;3:1477–1484. doi: 10.1021/nn9003346. [DOI] [PMC free article] [PubMed] [Google Scholar]
- 11.Barbosa S, Agrawal A, Rodríguez-Lorenzo L, Pastoriza-Santos I, Alvarez-Puebla RA, Kornowski A, Weller H, Liz-Marzán LM. Langmuir. 2010 doi: 10.1021/la102559e. [DOI] [PubMed] [Google Scholar]
- 12.Khoury CG, Vo-Dinh T. J. Phys. Chem. C. 2008;112:18849–18859. doi: 10.1021/jp8054747. [DOI] [PMC free article] [PubMed] [Google Scholar]
- 13.Wiley BJ, Chen Y, McLellan JM, Xiong Y, Li ZY, Ginger D, Xia Y. Nano Lett. 2007;7:1032–1036. doi: 10.1021/nl070214f. [DOI] [PubMed] [Google Scholar]
- 14.Xie J, Zhang Q, Lee JY, Wang DI. ACS Nano. 2008;2:2473–2480. doi: 10.1021/nn800442q. [DOI] [PubMed] [Google Scholar]
- 15.Orendorff CJ, Gearheart L, Jana NR, Murphy CJ. Phys. Chem. Chem. Phys. 2005;8:165–170. doi: 10.1039/b512573a. [DOI] [PubMed] [Google Scholar]
- 16.von Maltzahn G, Centrone A, Park JH, Ramanathan R, Sailor MJ, Hatton TA, Bhatia SN. Adv. Mater. 2009;21:3175–3180. doi: 10.1002/adma.200803464. [DOI] [PMC free article] [PubMed] [Google Scholar]
- 17.Doering WE, Nie S. Anal. Chem. 2003;75:6171–6176. doi: 10.1021/ac034672u. [DOI] [PubMed] [Google Scholar]
- 18.Braun GB, Lee SJ, Laurence T, Fera N, Fabris L, Bazan GC, Moskovits M, Reich NO. J. Phys. Chem. C. 2009;113:13622–13629. [Google Scholar]
- 19.Qian X, Peng XH, Ansari DO, Yin-Goen Q, Chen GZ, Shin DM, Yang L, Young AN, Wang MD, Nie S. Nat. Biotechnol. 2008;26:83–90. doi: 10.1038/nbt1377. [DOI] [PubMed] [Google Scholar]
- 20.Smith DK, Miller NR, Korgel BA. Langmuir. 2009;25:9518–9524. doi: 10.1021/la900757s. [DOI] [PubMed] [Google Scholar]
- 21.Goddard G, Martin JC, Naivar M, Goodwin PM, Graves SW, Habbersett R, Nolan JP, Jett JH. Cytometry Part A. 2006;69:842–851. doi: 10.1002/cyto.a.20320. [DOI] [PubMed] [Google Scholar]
- 22.Grégori G, Patsekin V, Rajwa B, Jones J, Ragheb K, Holdman C, Robinson JP. Cytometry Part A. 2012;81A:35–44. doi: 10.1002/cyto.a.21120. [DOI] [PubMed] [Google Scholar]
- 23.Watson DA, Brown LO, Gaskill DF, Naivar M, Graves SW, Doorn SK, Nolan JP. Cytometry Part A. 2008;73:119–128. doi: 10.1002/cyto.a.20520. [DOI] [PubMed] [Google Scholar]
- 24.Watson DA, Gaskill DF, Brown LO, Doorn SK, Nolan JP. Cytometry Part A. 2009;75:460–464. doi: 10.1002/cyto.a.20706. [DOI] [PMC free article] [PubMed] [Google Scholar]
- 25.Nolan JP, Mandy F. Cytometry Part A. 2006;69:318–325. doi: 10.1002/cyto.a.20266. [DOI] [PMC free article] [PubMed] [Google Scholar]
- 26.Krutzik PO, Nolan GP. Nat. Methods. 2006;3:361–368. doi: 10.1038/nmeth872. [DOI] [PubMed] [Google Scholar]
- 27.Sun L, Sung KB, Dentinger C, Lutz B, Nguyen L, Zhang J, Qin H, Yamakawa M, Cao M, Lu Y, Chmura A, Zhu J, Su X, Berlin AA, Chan S, Knudsen B. Nano Lett. 2007;7:351–356. doi: 10.1021/nl062453t. [DOI] [PubMed] [Google Scholar]
- 28.Chourpa I, Lei FH, Dubois P, Manfait M, Sockalingum GD. Chem. Soc. Rev. 2008;37:993–1000. doi: 10.1039/b714732p. [DOI] [PubMed] [Google Scholar]
- 29.Boisselier E, Astruc D. Chem. Soc. Rev. 2009;38:1759–1782. doi: 10.1039/b806051g. [DOI] [PubMed] [Google Scholar]
- 30.Schlücker S. Chem. Phys. Chem. 2009;10:1344–1354. doi: 10.1002/cphc.200900119. [DOI] [PubMed] [Google Scholar]


