Abstract
The application of dynamic susceptibility contrast (DSC) MRI methods to assess brain tumors is often confounded by the extravasation of contrast agent (CA). Disruption of the blood–brain barrier allows CA to leak out of the vasculature leading to additional T1, T2 and relaxation effects in the extravascular space, thereby affecting the signal intensity time course in a complex manner. The goal of this study is to validate a dual-echo DSC-MRI approach that separates and quantifies the T1 and contributions to the acquired signal and enables the estimation of the volume transfer constant, Ktrans, and the volume fraction of the extravascular extracellular space, νe. To test the validity of this approach, DSC-MRI- and dynamic contrast enhanced (DCE) MRI-derived Ktrans and νe estimates were spatially compared in both 9L and C6 rat brain tumor models. A high degree of correlation (concordance correlation coefficients >0.83, Pearson's r>0.84) and agreement was found between the DSC-MRI- and DCE-MRI-derived measurements. These results indicate that dual-echo DSC-MRI can be used to simultaneously extract reliable DCE-MRI kinetic parameters in brain tumors in addition to conventional blood volume and blood flow metrics.
Keywords: Dynamic contrast enhanced, Dynamic susceptibility contrast, Perfusion, Permeability
1. Introduction
Contrast enhanced magnetic resonance imaging (MRI) methods, both relaxivity (T1)- and susceptibility (T2 and )-based approaches, have demonstrated the potential to measure important characteristics of tumor vasculature in both preclinical and clinical applications. Studies that assess changes in tissue T1 following the injection of a contrast agent (CA) are commonly termed dynamic contrast-enhanced MRI (DCE-MRI; reviewed in, e.g., Ref. [1]), whereas those relying on T2 and changes are referred to as dynamic susceptibility contrast MRI (DSC-MRI; reviewed in, e.g., Ref. [2]). As the CA traverses through blood vessels and into the extravascular space, it alters the T1, T2 and relaxation rates of tissue water and therefore the measured MR signal intensity. The resultant signal intensity time courses can be related to changes in tissue CA concentration, and, by fitting the DCE- or DSC-MRI data to an appropriate pharmacokinetic model, physiological parameters can then be extracted. The analysis of DCE-MRI yields parameters that relate to tissue perfusion and permeability (denoted by the parameter Ktrans) and the extravascular extracellular volume fraction (denoted by νe), both of which have been shown to be sensitive to tumor growth and treatment response (see, e.g., Refs. [3–5]). When the CA remains intravascular, blood volume, blood flow, and mean transit time can be extracted from DSC-MRI data and such parameters have been used to assess brain, breast and prostate tumor hemodynamics [6–9]. DSC-MR-derived brain tumor blood volume and blood flow data have demonstrated a correlation with tumor grade [7,10–12] and treatment response [13–15].
A central assumption in DSC-MRI studies is that the CA remains compartmentalized within the blood vessels such that a susceptibility gradient can be induced between the intravascular and extravascular space. Tumor vessels often have increased permeability, so the small molecular-weight Gadolinium-based agents that are widely used in the clinic readily extravasate, resulting in additional relaxation effects in the extravascular space, modulation of the effective transverse relaxivity and, ultimately, alteration of the measured signal intensity time course. The most commonly reported relaxation effect is a decrease in the T1 of extravascular water which occurs during and following the first pass of the CA through the vasculature and results in a substantial increase of the MRI signal above the pre-contrast baseline [10,16,17]. Conversely, as a consequence of the use of pulse sequences with intentionally reduced T1 sensitivity (e.g., low flip angle, longer echo times or dual-echo pulse sequences), an increasing number of studies are describing enhanced T2 and/or effects that result in a substantial and prolonged (minutes after the first pass of the CA bolus) decrease of the MRI signal [18,19]. With commonly used DSC-MRI acquisition and analysis methods, CA leakage has been shown to lead to unreliable estimates of tumor blood volume and blood flow [10,16,17]. However, numerous techniques have been proposed to reduce or eliminate leakage effects including loading doses of CA prior to the bolus injection, low flip angles, longer echo times, dual-echo pulse sequences, baseline subtraction and model-based permeability compensation methods [17,18,20–23].
The correction of CA leakage effects using postprocessing methods or the more complex kinetic models of DSC-MRI signals in tumor tissue typically yield estimates of a parameter related to the CA extravasation rate and/or Ktrans [17,18,20–25]. For application to tumors, the simultaneous measurement of blood flow, blood volume, mean transit time and Ktrans using DSC-MRI could be a particularly useful and efficient means for grading tumors and assessing treatment response. It would also eliminate the need for multiple injections of contrast agent during a combined DCE/DSC-MRI study. However, estimating permeability or Ktrans using DSC-MRI is confounded by competing T1, T2 and relaxation effects and the dependency of these interactions on pulse sequence parameters and the underlying physical and physiological properties of the tissue.
For accurate Ktrans measurements, the relationship between the MRI signal intensity time courses and the CA concentration is required. While the relative importance of including exchange effects when converting DCE-MRI signals to CA concentrations is still debated, the formalism for such methods has been worked out and various groups are working to validate the models [26,27]. In contrast, the relationship between signal intensity and CA concentration in DSC-MRI, typically termed the susceptibility calibration factor, is unresolved and relies on the (unknown) heterogeneous spatial distribution of the CA within the vascular and extravascular extracellular space (EES) [28]. While this complex relationship may potentially prove to be a useful contrast mechanism, enabling the extraction of features of the EES (e.g. tumor cellular density and/or spacing [28,29]), it likely hinders the reliable measurement of tumor Ktrans.
The separation of T1- and -induced signal changes using dual-echo pulse sequences has been shown to be a potential method to simultaneously estimate blood flow, blood volume (from the time series) and parameters related to the extravasation kinetics (from the T1 time series) in human brain tumors [30–33]. Using similar multi-echo gradient-echo pulse sequences, Kim et al. [34] and Sourbron et al. [24] proposed methods to simultaneously derive the transverse and longitudinal relaxation rates and demonstrated their utility in phantoms and a subcutaneous mouse model of human colorectal cancer, respectively. However, to our knowledge, no study has directly compared DSC- and DCE-MRI-derived T1 time series and their corresponding kinetic parameters in vivo. Such comparisons are essential if the dual-echo approach is to be seriously considered as a clinically viable alternative to sequentially acquired DCE-MRI and DSC-MRI data. In this report, the validity of the dual-echo-based DSC-MRI approach is evaluated by comparison to DCE-MRI in two rat glioma models with different vascular and CA kinetic properties.
2. Methods
2.1. Animal Studies
Dual-echo DSC-MRI- and DCE-MRI-derived measures of Ktrans and νe were compared in two rat brain tumor models, the 9L gliosarcoma and the C6 glioblastoma. Animals were immobilized in a stereotactic head holder for all surgical and imaging procedures. Anesthesia was induced via a 5%:95% isoflurane/oxygen mixture and maintained via a 2%:95% isoflurane/oxygen mixture. Ten male Wistar rats (Harlan, Indianapolis, IN, USA) were inoculated with 1×10⁵ C6 gliosarcoma cells (American Type Culture Collection, Manassas, VA, USA) using a 10-μl gastight syringe (Hamilton, Reno, NV, USA). The site of the inoculation was 1 mm anterior and 3 mm lateral to the bregma on the right side of the head, at a depth of 4 mm relative to the dural surface. An identical procedure was used to inoculate 10 male Fischer rats (Harlan) with 1×10⁵ 9L glioma cells (American Type Culture Collection).
MRI experiments were performed on a Varian 4.7-T scanner equipped with a 63-mm quadrature birdcage coil 14–16 days after tumor inoculation. During the imaging experiment, a warm flow of air over the animal maintained the body temperature at 37°C. The respiratory rate was monitored throughout the experiment and maintained at 40–60 breaths per minute. A variable flip angle gradient-echo approach was employed to produce a T10 map, with the following parameters: TR=200 ms, TE =3.1 ms, FOV=(40 mm)2, slice thickness=2.0 mm, matrix= 642, four excitations and five flip angles (ranging from 12° to 60°). For the DCE-MRI study, a gradient-echo pulse sequence [TR=15.625 ms, TE=1.9 ms, FOV = (40 mm)2, slice thickness=2.0 mm, flip angle=9°, matrix = 642, and one excitation, resulting in a temporal resolution of 1 image s−1] was used to obtain 999 serial images of a single slice in ∼16 minutes of imaging. A bolus of 0.2 mmol kg−1 per body weight of gadopentate dimeglumine (Gd-DTPA, Biophysics Assay Laboratory, Worcester, MA, USA), was manually delivered within 5 s via a jugular catheter after the acquisition of 60 baseline images.
After five Gd-DTPA blood-clearance half-lives (∼2.5 h) were allowed to elapse (without moving the animal within the magnet), the DSC-MRI studies were initiated. Prior to the DSC-MRI study, a second set of variable flip angle gradient- echo images, for T10 mapping, was acquired to ensure complete washout of the CA from the first injection. The DSC-MRI protocol employed a gradient-echo pulse sequence [TR= 15.625 ms, TE1/TE2=5.0/10 ms, FOV=(40 mm)2, slice thickness=2.0 mm, flip angle=9°, matrix =642 and one excitation, resulting in a temporal resolution of 1 image per second for 999 images]. Although this pulse sequence is not a traditional echo planar DSC-MRI sequence, we routinely use it for preclinical DSC-MRI studies at 4.7 T due to its lack of susceptibility-related artifacts and favorable signal-to-noise ratio. A similar sequence was previously used to acquire dual-echo DSC-MRI data in human brain tumors [32]. During the course of the image acquisition, a bolus of 0.2 mmol kg−1 per body weight of Gd-DTPA was manually delivered via the same jugular catheter after the acquisition of 60 baseline images. All studies adhered to our institution's animal care and use committee policies.
2.2. Data Analysis
Although animals did not move significantly during the experiment, for each rat we first coregistered all images to the first precontrast image using a rigid-body algorithm. The multiple flip angle data were fit to the following equation to construct T10 maps:
| (1) |
where S0 is a constant describing the scanner gain and proton density and it is assumed that map was then used to estimate . The T10 map was then used to estimate DCE R1 time courses for each voxel from the raw signal intensity time courses in the manner of Landis et al. [35]. The dual-echo DSC-derived T1-weighted signal time courses were computed through extrapolation of the dual-echo signal back to TE=0, at each time point, and then combined with the T10 maps to compute the DSC R1 time courses as previously described [32].
A reference region (RR) model was used to estimate the contrast agent pharmacokinetics from the DCE and DSC R1 time courses. This model enables the computation of the contrast agent kinetic parameters without the need to measure an arterial input function. Given that a manual injection could introduce variability in the rate and total contrast agent dose administered, the reference region approach was considered preferable to assuming an arbitrary arterial input function as such differences would, in principle, be reflected in the measured reference region time series. Details of the RR theory are described elsewhere [36]. Briefly, a tissue of interest (TOI) R1 time course, , can be modeled as the following:
| (2) |
where and are the longitudinal relaxation rate constants in the RR and TOI, respectively; Ktrans,RR and Ktrans,TOI are the contrast agent extravasation rate constants for the RR and the TOI, respectively; νe,RR and νe,TOI are the EES volume fractions for the RR and the TOI, respectively; νe,RR and R≡Ktrans,TOI/Ktrans,RR. Eq. (2) was used with a nonlinear least squares curve fitting routine to extract Ktrans,TOI and νe,TOI from the DSC and DCE R1 time courses for each voxel within the brain tumors. The RR time series was selected from a region of interest in muscle tissue. All imaging analysis was performed in AFNI [37].
2.3. Statistical Analysis
To compare the DSC- and DCE- derived maps of Ktrans and νe, we performed both region-of-interest (ROI) and voxel-wise analyses. The ROI analysis focused on the correlation between mean tumor parameter values across animals, whereas the voxel-wise analysis focused on the spatial correlation between the DCE- and DSC-derived parameters within each animal. For ROI analysis, we first computed the ROI means of Ktrans and νe for each animal and for each method. We then computed the following to assess the agreement between DCE and DSC ROI means: (1) the concordance correlation coefficient (CCC), (2) the Pearson correlation coefficient, and (3) the slope of the regression line using DSC as the dependent variable and DCE as the independent variable. For the voxel-wise analysis, we calculated the CCC, the Pearson's correlation and the slope for the regression line separately for each animal.
3. Results
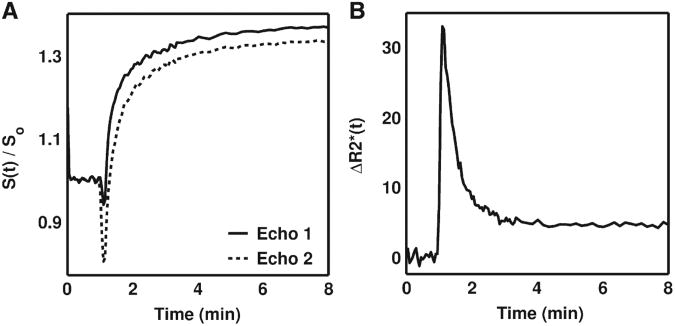
Fig. 1 illustrates examples of dual-echo DSC-MRI signals acquired in the rat C6 brain tumor. Compared to the longer echo time (‘Echo 2’), the shorter echo time (‘Echo 1’) had a higher sensitivity to T1 leakage effects as evidenced by a smaller signal drop during the first pass of the agent and a higher signal enhancement following the first pass (Fig. 1A). As previous studies have shown, using these two signals to compute the time course (Fig. 1B) appears to have removed the T1 leakage effects. Such curves have previously been used to compute measures of tumor blood flow and blood volume [21,31,34].
Fig. 1.
(A) Example C6 tumor MRI signals acquired with dual-echo DSC-MRI and (B) the resulting time course. As compared to the signal acquired at a longer echo time (Echo 2), the shorter echo time signal (Echo 1) had a lower signal drop during the first pass of the CA and a higher signal enhancement following the first pass, owing to its enhanced sensitivity to T1 effects. The computed dual echo time course is free of T1 leakage effects, which typically appear as negative values.
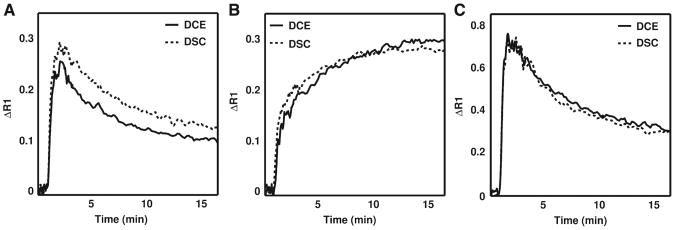
Example DSC- and DCE-derived ΔR1 time curves for muscle, C6 glioma and 9L gliosarcoma ROIs are interest are illustrated in Fig. 2A–2C, respectively. For the example shown, the DSC-derived ΔR1 time curve for muscle tissue (Fig. 2A) is 16% higher at peak value as compared to that measured with DCE-MRI. As the injections were manual, some differences in contrast agent dose and rate are expected. The DSC- and DCE-derived ΔR1 time curves in C6 and 9L tumors, shown in Fig. 2B and C, respectively, are very similar in magnitude and shape. Note the marked difference between the kinetics of the two brain tumor models. This enabled a comparison of the DCE- and DSC-derived kinetic parameters in two tumor models with dissimilar hemodynamic characteristics.
Fig. 2.
Example DSC-MRI-and DCE-MRI-derived ΔR1 time curves for (A) muscle, (B) C6 glioma and (C) 9L gliosarcoma regions of interest. Despite the use of manual contrast agent injections, the DSC-MRI and DCE-MRI methods yielded ΔR1 time curves across all the datasets that were generally similar in both shape and magnitude. The ΔR1 time curves in 9L and C6 whole-tumor regions of interest were markedly different, indicating that the underlying CA kinetics and hemodynamic characteristics of these tumors are dissimilar.
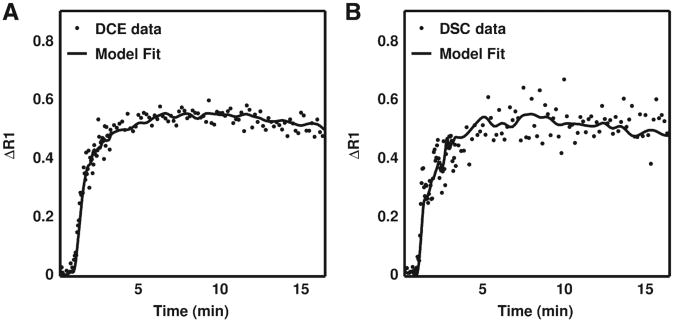
Fig. 3A and B display DSC- and DCE-derived ΔR1 time curves for a nine-voxel ROIs in a C6 tumor, respectively, and the corresponding kinetic model fit. The filled circles represent the data and the solid lines are the best-fit lines obtained from Eq. (2). Similar to the results shown in Fig. 2, the tumor curves are qualitatively similar in shape and magnitude. Given the influence of noise on the reliability of nonlinear fitting algorithms, we computed each tumor's mean temporal signal-to-noise ratio (TSNR) for the DSC-MRI- and DCE-MRI-derived ΔR1 time curves. No significant difference was found between the mean DSC and DCE TSNR values (P=.13). Furthermore, with the DSC and DCE methods used herein, we would expect, with 95% confidence, that the difference in TSNR between the two methods will be smaller than 5.6 (confidence interval=−5.6 to 0.77). To assess the goodness of the fit, we compared R2 values for the reference region model fits of the DSC- and DCE-derived ΔR1 time curves. The median DSC and DCE R2 values in the 9L group were 0.95 and 0.97, respectively, and 0.96 and 0.98, respectively, in the C6 group.
Fig. 3.
Example (A) DCE-MRI- and (B) DSC-MRI-derived ΔR1 time curves for a region of interest in a C6 tumor and the corresponding reference region model fit. For this dataset, the DCE-MRI- and DSC-MRI-derived Ktrans values were 0.016 and 0.014 min−1 and the νe values were 0.09 and 0.1, respectively. Across all animals no statistically significant difference was found between DSC-MRI and DCE-MRI temporal signal-to-noise ratios (P=.13).
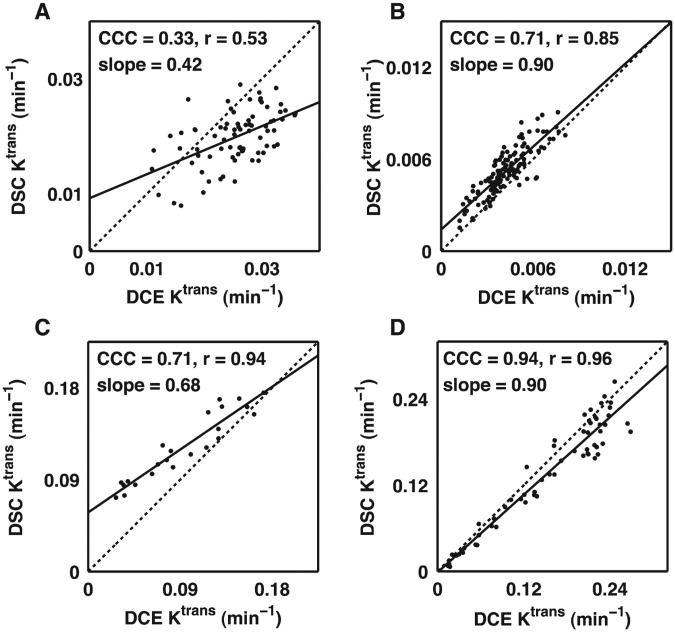
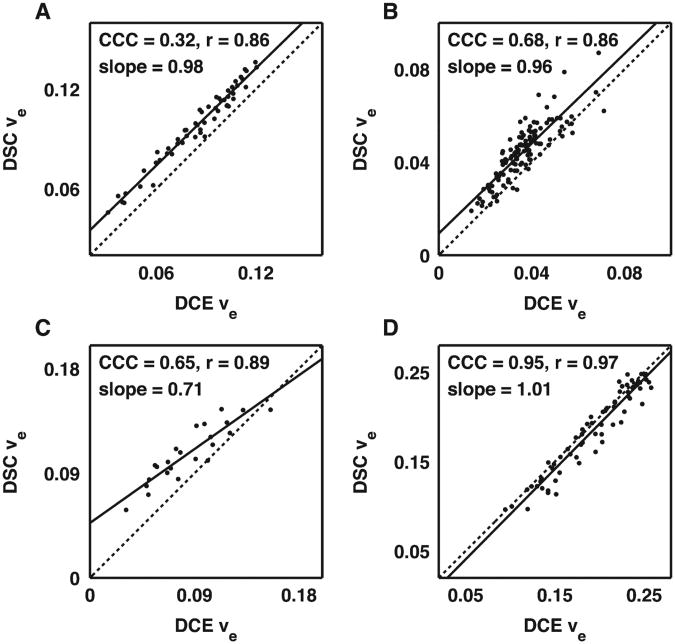
A voxel-by-voxel comparison of DSC- vs. DCE-derived Ktrans and νe values from four brain tumor-bearing rats are shown in Figs. 4 and 5, respectively. To illustrate the range of the results, scatterplots are presented illustrating the lowest measured CCC (Figs. 4A and 5A) over all the 9L and C6 data, the CCCs closest to the median value for C6 (Figs. 4B and 5B) and 9L (Figs. 4C and 5C) data, and the highest CCC (Figs. 4D and 5D) over all the 9L and C6 data. For Ktrans and νe, the median CCC, r and slope across all 9L and C6 tumors were 0.71, 0.88 and 0.83, and 0.67, 0.88 and 0.83, respectively.
Fig. 4.
Voxel-by-voxel comparison of DSC-MRI- and DCE-MRI-derived Ktrans values representing the (A) lowest CCC for all C6 and 9L datasets, (B) median CCC dataset for C6 tumors, (C) median CCC dataset for 9L tumors and (D) the highest CCC dataset for all C6 and 9L datasets. Overall, there was a reasonable correlation and agreement between the DSC-MRI- and DCE-MRI-derived Ktrans values in a given rat with a median CCC, r and slope across all 9L and C6 tumors of 0.71, 0.88 and 0.83, respectively.
Fig. 5.
Voxel-by-voxel comparison of DSC-MRI- and DCE-MRI-derived νe values representing the (A) lowest CCC for all C6 and 9L datasets, (B) median CCC dataset for C6 tumors, (C) median CCC dataset for 9L tumors and (D) the highest CCC dataset for all C6 and 9L datasets. There was a reasonable correlation between the DSC-MRI- and DCE-MRI-derived νe values in a given rat with a median CCC, r and slope across all 9L and C6 tumors of 0.71, 0.88 and 0.83, respectively.
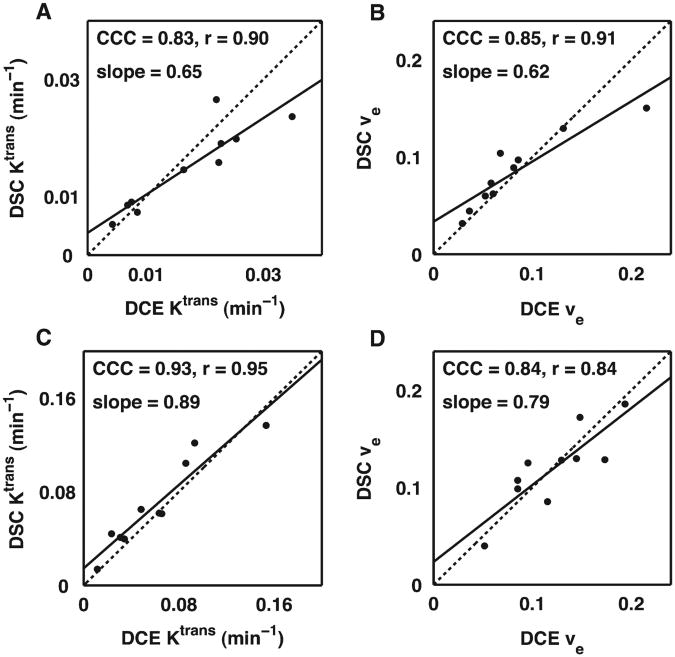
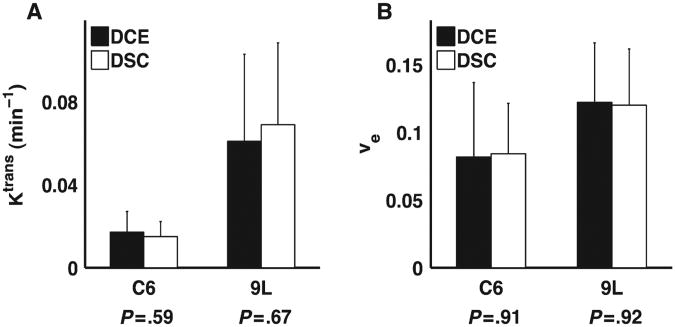
The grouped ROI comparison of DSC- vs. DCE-derived Ktrans and νe values for the C6 and 9L tumors are illustrated in Figs. 6 and 7, respectively, and summarized in Table 1. As shown in Fig. 6 and Table 1, we found a strong correlation (all CCC and r values >0.83) between DSC and DCE estimates of Ktrans and νe in both C6 and 9L tumors despite the differences in their underlying pathophysiology and associated CA kinetic characteristics. For all parameters, the slope of the DSC vs. DCE parameter Regression line was less than unity (ranging from 0.62 to 0.89). No significant difference (P>.5) was found between the mean DSC- and DCE-derived Ktrans and νe values as shown in Fig. 7.
Fig.6.
Grouped region of interest correlation analysis of DSC-MRI- and DCE-MRI-derived Ktrans (A and C) and νe values (B and D) for the C6 (top) and 9L tumors (bottom). The DSC and DCE estimates of Ktrans and νe in both C6 and 9L tumors were strongly correlated (the CCC and r values >.83) despite the differences in their underlying CA kinetic characteristics.
Fig. 7.
Grouped region of interest analysis of mean DSC-MRI- and DCE-MRI-derived Ktrans (A) and νe values (B) in the C6 and 9L tumors. There was no significant difference between the DSC-MRI and DCE-MRI kinetic parameters in either tumor model.
Table 1. ROI Correlation analysis of DSC and DCE kinetic parameters.
| Parameter | CCC (95% CI) | r (95% CI) | Slope |
|---|---|---|---|
| Ktrans (C6) | 0.83 (0.55−0.94) | 0.90 (0.62−0.98) | 0.65 |
| νe (C6) | 0.85 (0.63−0.94) | 0.91 (0.67−0.98) | 0.62 |
| Ktrans (9L) | 0.93 (0.74−0.98) | 0.95 (0.62−0.98) | 0.89 |
| νe (9L) | 0.84 (0.48−0.96) | 0.84 (0.44−0.96) | 0.79 |
CI: Confidence interval.
4. Discussion
In this report, we have described a direct comparison of dual-echo DSC-MRI- and DCE-MRI-derived estimates of Ktrans and νe in the 9L and C6 rat brain tumor models. We found a high degree of correlation between the DSC-MRI- and DCE-MRI-derived parameters within tumors and across the two tumor types. In this case, a high correlation indicates that the DSC-MRI approach is sensitive to the same physiological range of Ktrans and νe parameters as is measured with DCE-MRI. The mean tumor Ktrans and νe parameters for each method were also in good agreement as no significant differences were found in either the C6 or 9L tumor models. This finding suggests that quantitative DSC-MRI measures of Ktrans and νe should be comparable to those found using conventional DCE-MRI.
Ideally, the regression lines between the DSC- and DCE-derived parameters, such as those illustrated in Figs. 4–6, would have unity slope. For the group-based analysis, the slopes found for each tumor type was less than unity for Ktrans and νe. In a previous DCE-MRI repeatability study, which used an almost identical study design, we found a slope of 0.77 between the Ktrans values derived from the second and first injections of the contrast agent [38]. Such differences potentially result from variations in vessel perfusion expected in animals under anesthesia for extended durations (5 h in this study) or actual changes in tumor physiology over the course of the experiment. Although every effort was made to maintain constant body temperature and respiratory rates during the experiment, the animals' physiological status almost certainly changes under these circumstances and this could have altered the measurements. Imaging the animals on consecutive days could have reduced the animals' exposure to anesthesia during each day's experiment, but the tumor physiology would have likely changed during this period and it would have made it more difficult to compare the same section of tumor tissue. Alternatively, we could have reversed the order of the DCE and DSC studies in half of the animals to remove any bias that is introduced from performing the DSC study after hours of exposure to anesthesia. Furthermore, while the reference region kinetic model should account for any differences in the rate of contrast agent injection, the use of a power injector could have ensured more uniform injections between the DCE and DSC scans.
Given the sensitivity of pharmacokinetic modeling to signal noise, we anticipated that differences in the temporal SNR levels between the DSC-MRI- and DCE-MRI-derived R1 time series could introduce uncertainty in the extracted parameters. Interestingly, we found no practical difference between TSNR levels or the goodness-of-fit measures between the DSC and DCE data. This indicates that the noise characteristics of the DSC-MRI data do not limit its reliability for DCE-MRI pharmacokinetic modeling.
As indicated earlier, an advantage of the dual-echo DSC-MRI approach for estimating Ktrans and νe is its reliance on T1 rather than on T2 or -based changes in the DSC-MRI signal. The estimation of these parameters using T2 or is confounded by the complicated relationship between the signal intensity and CA concentration, which relies on the spatial distribution of the CA within the EES, the vascular architecture and the interaction of the susceptibility gradients generated by CA within the intra- and extravascular compartments. Even without CA extravasation this relationship is confounded because the vascular susceptibility calibration factor, which is the scaling constant between relaxation rate change and CA concentration, is known to vary across tissues with differing vascular geometries and architecture [39,40]. In tumor tissue, where vascular integrity and architecture are known to be highly heterogeneous, the estimation of CA concentration and the corresponding kinetic parameters from T2 and/or -based signal changes alone is likely to be less reliable than that measured from T1-based methods.
Another potential advantage of the dual-echo signal acquisition is that it could improve the reliability of the Ktrans and νe measures. Single-echo-based DCE-MRI signals can be confounded by effects originating from high levels of CA compartmentalized within the vasculature, particularly during its first pass. Similarly, the measurement of an arterial input function (AIF) can be challenging due to such effects. The dual-echo approach enables the quantification of ΔR1 by removing these contributions so the derived measures of CA concentration, as well as the derived kinetic parameters, should be more reliable. To test this notion we will compare DSC-MRI- and DCE-MRI-derived kinetic parameters to those derived from gold standard methods (e.g. quantitative autoradiography).
Future studies will also focus on how the selection of the echo times, the number of echoes and the difference between them, influence the reliability of the computed ΔR1 time series. With the goal of simultaneously assessing CA-induced T1 and changes, it seems reasonable to minimize the shorter echo time for optimal T1 contrast. The second echo time could be selected to optimize the quality of the AIF and the contrast-to-noise ratio. The dual-echo gradient-echo spiral -out sequence recently applied in a DSC-MRI study of human brain tumors could potentially satisfy both conditions [41]. While the use of additional echoes may increase the reliability of the derived T1 and time series, it is likely at the expense of temporal resolution and/or tissue coverage.
It is increasingly apparent that T1 and extravasation effects confound and reduce the reliability of DSC-MRI-derived measures of blood flow and blood volume. While the T1 effects are easily removed using multiple-echo acquisitions, such as the dual-echo approach used herein, accounting for the effects remains an active area of investigation. As mentioned above, the influence of leakage effects on the acquired DSC-MRI signals will greatly depend on the geometrical compartmentalization of CA within the EES. The geometry of the CA within the EES is most likely determined by the cell density and the spatial distribution of cells around blood vessels. This will introduce an additional and unknown susceptibility calibration factor relating the measured change to the EES CA concentration. These effects can be substantial at time points past the first pass of the CA, where the vascular CA concentration is low. Indeed, DSC-MRI sequences employing heavily -weighted acquisition methods often exhibit tumor time curves that do not return to the baseline over the duration of a typical DSC-MRI study and are higher in magnitude than would be observed for typical recirculation effects. Since the dual-echo approach provides a measure of the EES CA concentration, it may be possible to estimate this previously unknown calibration factor. This EES susceptibility calibration factor could provide a new contrast mechanism for characterizing tumor tissue as it potentially reflects features of tumor cellularity such as cell density. Furthermore, it may be possible to utilize the EES CA concentration time curves and the derived calibration factor to remove the contributions of the T1 and extravasation effects on DSC-MRI signals and ultimately improve the reliability of the blood flow and blood volume measurements. With these improved acquisition schemes and signal characterization steps, DSC-MRI may become a robust tool for the characterization of cerebral and non-cerebral tumor tissues. However, systematic validation of the derived kinetic parameters with gold standard metrics is still critical for the widespread acceptance of DSC-MRI methodology.
With conventional DSC-MRI it is well recognized that measures of tumor blood flow, blood volume and mean transit time can be assessed. We demonstrate that a dual-echo DSC-MRI experiment, when combined with a pre-contrast T1 map, enables the reliable determination of the Ktrans and νe parameters typically acquired in a quantitative DCE-MRI study. Given the experimental and clinical success of the DSC- and DCE-derived parameters to interrogate tumor vascular status, tumor grade and treatment response, the simultaneous approach described herein could serve as an important clinical tool for the management of patients with brain tumors.
Acknowledgments
We thank the National Institutes of Health for financial support through NIBIB 1K25-EB005936, NCI 2R25-CA092043, NCI 1K99/R00-CA127599, NIBIB R01 EB001452, NCI R01 CA138599, and NCI P30 CA68485 and NCI 1R01 CA158079. We also thank Zou Yue for her assistance with animal surgeries.
References
- 1.Yankeelov TE, Gore JC. Dynamic contrast enhanced magnetic resonance imaging in oncology. Curr Med Imaging Rev. 2007;3:91–107. doi: 10.2174/157340507780619179. [DOI] [PMC free article] [PubMed] [Google Scholar]
- 2.Ostergaard L. Principles of cerebral perfusion imaging by bolus tracking. J Magn Reson Imaging. 2005;22(6):710–7. doi: 10.1002/jmri.20460. [DOI] [PubMed] [Google Scholar]
- 3.Tofts P, Kermode A. Measurement of blood–brain barrier defect by magnetic resonance imaging and gadolinium-DTPA in patients with multiple sclerosis and brain tumors. Magn Reson Med. 1991;17:357–67. [Google Scholar]
- 4.Gossmann A, Helbich TH, Kuriyama N, Ostrowitzki S, Roberts TP, Shames DM, van Bruggen N, Wendland MF, Israel MA, Brasch RC. Dynamic contrast-enhanced magnetic resonance imaging as a surrogate marker of tumor Response to anti-angiogenic therapy in a xenograft model of glioblastoma multiforme. J Magn Reson Imaging. 2002;15(3):233–40. doi: 10.1002/jmri.10072. [DOI] [PubMed] [Google Scholar]
- 5.Yankeelov TE, Lepage M, Chakravarthy A, Broome EE, Niermann KJ, Kelley MC, Meszoely I, Mayer IA, Herman CR, McManus K, Price RR, Gore JC. Integration of quantitative DCE-MRI and ADC mapping to monitor treatment response in human breast cancer: initial results. Magn Reson Imaging. 2007;25(1):1–13. doi: 10.1016/j.mri.2006.09.006. [DOI] [PMC free article] [PubMed] [Google Scholar]
- 6.Aronen HJ, Cohen MS, Belliveau JW, Fordham JA, Rosen BR. Ultrafast imaging of brain tumors. Top Magn Reson Imaging. 1993;5(1):14–24. [PubMed] [Google Scholar]
- 7.Aronen HJ, Gazit IE, Louis DN, Buchbinder BR, Pardo FS, Weisskoff RM, Harsh GR, Cosgrove GR, Halpern EF, Hochberg FH. Cerebral blood volume maps of gliomas: comparison with tumor grade and histologic findings. Radiology. 1994;191(1):41–51. doi: 10.1148/radiology.191.1.8134596. [DOI] [PubMed] [Google Scholar]
- 8.Delile J, Slanetz P, Yeh E, Kopans D, Garrido L. Breast cancer: regional blood flow and volume with magnetic susceptibility-based MR imaging. Radiology. 2002;223:558–65. doi: 10.1148/radiol.2232010428. [DOI] [PubMed] [Google Scholar]
- 9.Muramoto S, Uematsu H, Sadato N, Tsuchida T, Matsuda T, Hatabu H, Yonekura Y, Itoh H. H(2) (15)0 positron emission tomography validation of semiquantitative prostate blood flow determined by double-echo dynamic MRI: a preliminary study. J Comput Assist Tomogr. 2002;26(4):510–4. doi: 10.1097/00004728-200207000-00005. [DOI] [PubMed] [Google Scholar]
- 10.Donahue KM, Krouwer HG, Rand SD, Pathak AP, Marszalkowski CS, Censky SC, Prost RW. Utility of simultaneously acquired gradient-echo and spin-echo cerebral blood volume and morphology maps in brain tumor patients. Magn Reson Med. 2000;43(6):845–53. doi: 10.1002/1522-2594(200006)43:6<845::aid-mrm10>3.0.co;2-j. [DOI] [PubMed] [Google Scholar]
- 11.Schmainda KM, Rand SD, Joseph AM, Lund R, Ward BD, Pathak AP, Ulmer JL, Badruddoja MA, Krouwer HG. Characterization of a first-pass gradient-echo spin-echo method to predict brain tumor grade and angiogenesis. AJNR Am J Neuroradiol. 2004;25(9):1524–32. [PMC free article] [PubMed] [Google Scholar]
- 12.Hakyemez B, Erdogan C, Ercan I, Ergin N, Uysal S, Atahan S. High-grade and low-grade gliomas: differentiation by using perfusion MR imaging. Clin Radiol. 2005;60(4):493–502. doi: 10.1016/j.crad.2004.09.009. [DOI] [PubMed] [Google Scholar]
- 13.Fuss M, Wenz F, Essig M, Muenter M, Debus J, Herman TS, Wannenmacher M. Tumor angiogenesis of low-grade astrocytomas measured by dynamic susceptibility contrast-enhanced MRI (DSC-MRI) is predictive of local tumor control after radiation therapy. Int J Radiat Oncol Biol Phys. 2001;51(2):478–82. doi: 10.1016/s0360-3016(01)01691-1. [DOI] [PubMed] [Google Scholar]
- 14.Weber MA, Thilmann C, Lichy MP, Gunther M, Delorme S, Zuna I, Bongers A, Schad LR, Debus J, Kauczor HU, Essig M, Schlemmer HP. Assessment of irradiated brain metastases by means of arterial spin-labeling and dynamic susceptibility-weighted contrast-enhanced perfusion MRI: initial results. Invest Radiol. 2004;39(5):277–87. doi: 10.1097/01.rli.0000119195.50515.04. [DOI] [PubMed] [Google Scholar]
- 15.Lee MC, Cha S, Chang SM, Nelson SJ. Dynamic susceptibility contrast perfusion imaging of radiation effects in normal-appearing brain tissue: changes in the first-pass and recirculation phases. J Magn Reson Imaging. 2005;21(6):683–93. doi: 10.1002/jmri.20298. [DOI] [PubMed] [Google Scholar]
- 16.Bruening R, Kwong KK, Vevea MJ, Hochberg FH, Cher L, Harsh GRT, Niemi PT, Weisskoff RM, Rosen BR. Echo-planar MR determination of relative cerebral blood volume in human brain tumors: T1 versus T2 weighting. Am J Neuroradiology. 1996;17(5):831–40. [PMC free article] [PubMed] [Google Scholar]
- 17.Quarles CC, Ward BD, Schmainda KM. Improving the reliability of obtaining tumor hemodynamic parameters in the presence of contrast agent extravasation. Magn Reson Med. 2005;53(6):1307–16. doi: 10.1002/mrm.20497. [DOI] [PubMed] [Google Scholar]
- 18.Johnson G, Wetzel SG, Cha S, Babb J, Tofts PS. Measuring blood volume and vascular transfer constant from dynamic, T(2)*-weighted contrast-enhanced MRI. Magn Reson Med. 2004;51(5):961–8. doi: 10.1002/mrm.20049. [DOI] [PubMed] [Google Scholar]
- 19.Colvin DC, Yankeelov TE, Does MD, Yue Z, Quarles C, Gore JC. New insights into tumor microstructure using temporal diffusion spectroscopy. Cancer Res. 2008;68(14):5941–7. doi: 10.1158/0008-5472.CAN-08-0832. [DOI] [PMC free article] [PubMed] [Google Scholar]
- 20.Boxerman JL, Schmainda KM, Weisskoff RM. Relative blood volume maps corrected for contrast agent extravasation significantly correlate with glioma tumor grade, whereas uncorrected maps do not. Am J Neuroradiol. 2006;27:859–67. [PMC free article] [PubMed] [Google Scholar]
- 21.Heiland S, Benner T, Debus J, Rempp K, Reith W, Sartor K. Simultaneous assessment of cerebral hemodynamics and contrast agent uptake in lesions with disrupted blood–brain-barrier. Magn Reson Imaging. 1999;17(1):21–7. doi: 10.1016/s0730-725x(98)00149-0. [DOI] [PubMed] [Google Scholar]
- 22.Vonken EJ, van Osch MJ, Bakker CJ, Viergever MA. Measurement of cerebral perfusion with dual-echo multi-slice quantitative dynamic susceptibility contrast MRI. J Magn Reson Imaging. 1999;10(2):109–17. doi: 10.1002/(sici)1522-2586(199908)10:2<109::aid-jmri1>3.0.co;2-#. [DOI] [PubMed] [Google Scholar]
- 23.Uematsu H, Maeda M, Sadato N, Matsuda T, Ishimori Y, Koshimoto Y, Kimura H, Yamada H, Kawamura Y, Yonekura Y, Itoh H. Blood volume of gliomas determined by double-echo dynamic perfusion-weighted MR imaging: a preliminary study. AJNR Am J Neuroradiol. 2001;22(10):1915–9. [PMC free article] [PubMed] [Google Scholar]
- 24.Sourbron S, Heilmann M, Biffar A, Walczak C, Vautier J, Volk A, Peller M. Bolus-tracking MRI with a simultaneous T1- and T2*-measurement. Magn Reson Med. 2009;62(3):672–81. doi: 10.1002/mrm.22042. [DOI] [PubMed] [Google Scholar]
- 25.Bjornerud A, Sorensen AG, Mouridsen K, Emblem KE. T(1)- and T(2)(*)-dominant extravasation correction in DSC-MRI: Part I. Theoretical considerations and implications for assessment of tumor hemodynamic properties. J Cereb Blood Flow Metab. 2011 doi: 10.1038/jcbfm.2011.52. [DOI] [PMC free article] [PubMed] [Google Scholar]
- 26.Buckley DL. Transcytolemmal water exchange and its affect on the determination of contrast agent concentration in vivo. Magn Reson Med. 2002;47(2):420–4. doi: 10.1002/mrm.10098. [DOI] [PubMed] [Google Scholar]
- 27.Yankeelov TE, Rooney WD, Li X, Springer CS., Jr Variation of the relaxographic “shutter-speed” for transcytolemmal water exchange affects the CR bolus-tracking curve shape. Magn Reson Med. 2003;50(6):1151–69. doi: 10.1002/mrm.10624. [DOI] [PubMed] [Google Scholar]
- 28.Quarles CC, Gochberg DF, Gore JC, Yankeelov TE. A theoretical framework to model DSC-MRI data acquired in the presence of contrast agent extravasation. Phys Med Biol. 2009;54(19):5749–66. doi: 10.1088/0031-9155/54/19/006. [DOI] [PMC free article] [PubMed] [Google Scholar]
- 29.Semmineh NB, Xu J, Gore JC, Quarles CC. The assessment of tumor cellularity using DSC-MRI; Proceedings of the International Society of Magnetic Resonance in Medicine; Montreal, Canada. 2011; p. 1084. [Google Scholar]
- 30.Kuperman VY, Karczmar GS, Blomley MJ, Lewis MZ, Lubich LM, Lipton MJ. Differentiating between T1 and T2* changes caused by gadopentetate dimeglumine in the kidney by using a double-echo dynamic MR imaging sequence. J Magn Reson Imaging. 1996;6(5):764–8. doi: 10.1002/jmri.1880060509. [DOI] [PubMed] [Google Scholar]
- 31.Vonken EP, van Osch MJ, Bakker CJ, Viergever MA. Simultaneous quantitative cerebral perfusion and Gd-DTPA extravasation measurement with dual-echo dynamic susceptibility contrast MRI. Magn Reson Med. 2000;43(6):820–7. doi: 10.1002/1522-2594(200006)43:6<820::aid-mrm7>3.0.co;2-f. [DOI] [PubMed] [Google Scholar]
- 32.Barbier EL, den Boer JA, Peters AR, Rozeboom AR, Sau J, Bonmartin A. A model of the dual effect of gadopentetate dimeglumine on dynamic brain MR images. J Magn Reson Imaging. 1999;10(3):242–53. doi: 10.1002/(sici)1522-2586(199909)10:3<242::aid-jmri4>3.0.co;2-h. [DOI] [PubMed] [Google Scholar]
- 33.d'Arcy JA, Collins DJ, Rowland IJ, Padhani AR, Leach MO. Applications of sliding window reconstruction with cartesian sampling for dynamic contrast enhanced MRI. NMR Biomed. 2002;15(2):174–83. doi: 10.1002/nbm.755. [DOI] [PubMed] [Google Scholar]
- 34.Kim EJ, Kim DH, Lee SH, Huh YM, Song HT, Suh JS. Simultaneous acquisition of perfusion and permeability from corrected relaxation rates with dynamic susceptibility contrast dual gradient echo. Magn Reson Imaging. 2004;22(3):307–14. doi: 10.1016/j.mri.2004.01.012. [DOI] [PubMed] [Google Scholar]
- 35.Landis CS, Li X, Telang FW, Coderre JA, Micca PL, Rooney WD, Latour LL, Vetek G, Palyka I, Springer CS., Jr Determination of the MRI contrast agent concentration time course in vivo following bolus injection: effect of equilibrium transcytolemmal water exchange. Magn Reson Med. 2000;44(4):563–74. doi: 10.1002/1522-2594(200010)44:4<563::aid-mrm10>3.0.co;2-#. [DOI] [PubMed] [Google Scholar]
- 36.Yankeelov TE, Luci JJ, Lepage M, Li R, Debusk L, Lin PC, Price RR, Gore JC. Quantitative pharmacokinetic analysis of DCE-MRI data without an arterial input function: a reference region model. Magn Reson Imaging. 2005;23:519–29. doi: 10.1016/j.mri.2005.02.013. [DOI] [PubMed] [Google Scholar]
- 37.Cox RW. AFNI: software for analysis and visualization of functional magnetic resonance neuroimages. Comput Biomed Res. 1996;29(3):162–73. doi: 10.1006/cbmr.1996.0014. [DOI] [PubMed] [Google Scholar]
- 38.Yankeelov TE, DeBusk LM, Billheimer DD, Luci JJ, Lin PC, Price RR, Gore JC. Repeatability of a reference region model for analysis of murine DCE-MRI data at 7T. J Magn Reson Imaging. 2006;24(5):1140–7. doi: 10.1002/jmri.20729. [DOI] [PubMed] [Google Scholar]
- 39.Pathak AP, Rand SD, Schmainda KM. The effect of brain tumor angiogenesis on the in vivo relationship between the gradient-echo relaxation rate change (DeltaR2*) and contrast agent (MION) dose. J Magn Reson Imaging. 2003;18(4):397–403. doi: 10.1002/jmri.10371. [DOI] [PubMed] [Google Scholar]
- 40.Kiselev VG. On the theoretical basis of perfusion measurements by dynamic susceptibility contrast MRI. Magn Reson Med. 2001;46(6):113–22. doi: 10.1002/mrm.1307. [DOI] [PubMed] [Google Scholar]
- 41.Paulson ES, Schmainda KM. Comparison of dynamic susceptibility-weighted contrast-enhanced MR methods: recommendations for measuring relative cerebral blood volume in brain tumors. Radiology. 2008;249(2):601–13. doi: 10.1148/radiol.2492071659. [DOI] [PMC free article] [PubMed] [Google Scholar]


