

Abstract
Carboxylesterases (CES) metabolize esters. Two CES isoforms are expressed in human liver (CES1 and CES2) and liver extracts are used in reaction phenotyping studies to discern interindividual metabolic variation. We tested the hypothesis that an individual’s CES phenotype can be characterized by reporter substrates/probes that interrogate native CES1 and CES2 activities in liver and immunoblotting methods. We obtained 25 livers and found that CES1 is the main hydrolytic enzyme. Moreover, although CES1 protein levels were similar, we observed large interindividual variation in bioresmethrin hydrolysis rates (17-fold), a pyrethroid metabolized by CES1 but not CES2. Bioresmethrin hydrolysis rates did not correlate with CES1 protein levels. In contrast, procaine hydrolysis rates, a drug metabolized by CES2 but not CES1, were much less variant (3-fold). Using activity-based fluorophosphonate probes (FP-biotin), which covalently reacts with active serine hydrolases, CES1 protein was the most active enzyme in the livers. Finally, using bioorthogonal probes and click chemistry methodology, the half-life of CES 1 and 2 in cultured HepG2 cells was estimated at 96 h. The cause of the differential CES1 activities is unknown, but the underlying factors will be important to understand because several carboxylic acid ester drugs and environmental toxicants are metabolized by this enzyme.
Keywords: Carboxylesterases, Human liver, CES1, Activity-based probes, Interindividual variation, Pesticides
Introduction
Several environmental toxicants and pharmaceutical agents contain ester bonds, which increase their lipophilicity and bio-availability in humans. Hydrolysis of ester-containing compounds in the body is accomplished in part by enzymes called carboxylesterases (CES) and results in the production of water soluble carboxylic acid and alcohol metabolites that are excreted from the body [1–3]. Furthermore, CES are an efficient sink for the removal of highly toxic organophosphate metabolites, although the enzymes are inactivated following phosphorylation by the reactive oxons [4]. Thus, hydrolytic metabolism catalyzed by CES is often a detoxification reaction. Moreover, recent findings indicate a role for CES in the metabolism of endogenous lipids, thus CES may be involved in diseases that exhibit dysregulated lipid metabolism such as diabetes and atherosclerosis [5–9]. There are five CES genes reported in the Human Genome Organization database [10]; however, CES1 and CES2 are the two best characterized and the principal CES genes expressed in liver. CES1, CES2, and CES3 encode ~60 kDa glycoproteins [11], although CES1 actually represents two separate but nearly identical genes (CES1A1, CES1A2) that have small nucleotide differences restricted to the promoter region and exon1, which encodes the signal peptide sequence. However, both CES1A1 and CES1A2 produce an identical CES1A protein following proteolytic processing (removal of signal peptide) in the endoplasmic reticulum [10]. CES1 protein (also called hCE1) is far more abundant than CES2 protein (also called hCE2) in human liver [12], and analysis of the human liver proteome indicates that CES1 is the tenth most abundant protein (out of >6000) expressed in this tissue [13] underscoring the fact that it is a constitutively and abundantly expressed protein in this organ.
The CES phenotype in liver can be defined as encompassing the overall expression and biochemical activities of the CES enzyme family in this vital metabolic organ. Characterization of the CES phenotype is important because it will allow clinicians and public health scientists to predict how individuals might respond metabolically to ester-containing drugs, pollutants, and endobiotics. Several examples of these chemicals exist. Of particular interest are pro-drugs, which are esterified in order to increase the lipophilicity and tissue availability of the pharmacophore, and are exemplified by the chemotherapeutic drug irinotecan (CPT-11). Pharmacokinetic studies have shown that considerable differences in interpatient irinotecan metabolism exist and one of the limiting factors in the efficacy of this compound is its bioactivation by CES [14]. In addition, impaired irinotecan hydrolysis in patients with chronic liver disease has been observed [15]. Furthermore, estercontaining pesticides such as pyrethroids and organophosphates (OPs) can elicit acute and developmental effects in rodents and possibly in humans [16], [17], which may be related to the hydrolytic metabolism of these compounds. Several pesticides also perturb xenobiotic metabolism by activating xenoreceptors (e.g., PXR) that regulate the levels of xenobiotic metabolizing enzymes expressed in the liver [18]. Examples of human variation in the detoxication activities of CES toward pyrethroid pesticides have been documented [19–21], which might make certain individuals more prone to pesticide-induced toxicities. With regard to endogenous activities, CES1 in both vessel wall macrophages and hepatocytes is proposed to have important roles in the regulation of cholesterol transport from vessel walls to the liver for eventual secretion as bile salts [22,23]. Thus, individuals with variants of CES1 that have low cholesteryl ester hydrolase activities may be less efficient at mobilizing cholesterol for disposal and more at risk to develop atherosclerosis. Therefore, characterization of the CES phenotype is important because it will identify individuals who are more susceptible to pathological effects caused by inefficient metabolism of exogenous toxins or the over-accumulation of endogenous lipids.
As mentioned above, variations in the hydrolytic metabolism of pyrethroid insecticides among individual human liver microsomes have been observed [20,21]. For example, we observed an 8-fold difference in the hydrolysis rates (Vmax) of permethrin [20], a commonly used pyrethroid insecticide metabolized by CES [24]. Moreover, Yang et al. [25] showed that CES1 and CES2 mRNA and protein expression were significantly different between adults and juveniles. A similar developmental expression pattern was also reported by Zhu et al. [26]. As a first step toward defining the CES phenotype in humans, we utilized individual livers to test the hypothesis that individuals can be characterized using a combination of specific “reporter” substrates/probes that interrogate the activities of native CES1 and CES2 and by immunoblotting methods that measure the abundance of CES1 and CES2. The results indicate that CES1 is the primary enzyme in liver responsible for the hydrolysis of ester-containing substrates. Moreover, although CES1 protein levels in livers were remarkably similar, large interindividual variation (17-fold) in the hydrolysis rates of bioresmethrin, a pyrethroid pesticide that is metabolized by CES1 but not CES2 was observed. In contrast, variation in the hydrolysis rates of procaine, an analgesic drug that is metabolized by CES2 but not CES1 was much less pronounced (3-fold).
Materials and methods
Source of human livers
Samples of frozen human livers were obtained from the Liver Tissue Cell Distribution System (LTCDS, NIH contract # N01-DK-9-2310) at the University of Minnesota, Minneapolis. Twenty-five liver specimens were obtained and stored at −80 °C until processed (<1 week after receiving the samples). Demographic information for the liver donors is provided in Table 1. Nineteen of the 25 livers were deemed to be normal based on information provided by LTCDS and histological examination that was performed by Fisher et al. [27]. The remaining 6 livers showed evidence of steatosis (>10% hepatocytes with fat deposition).
Table 1.
Liver tissue donor information.a
| Patient ID | Gender | Age | Raceb | Tissue state |
|---|---|---|---|---|
| HL899 | F | 23 | C | Normal |
| HL1201 | M | 69 | C | Steatosis (20%)c |
| HL1202 | F | 67 | C | Normal |
| HL1209 | F | 30 | C | Steatosis (40%) |
| HL1220 | F | 47 | C | Normal |
| HL1223 | F | 58 | C | Normal |
| HL1226 | M | 53 | C | Steatosis (40%) |
| HL1231 | M | 54 | C | Normal |
| HL1234 | M | 56 | C | Normal |
| HL1240 | F | 47 | C | Steatosis (40%) |
| HL1246 | M | 70 | C | Normal |
| HL1248 | F | 42 | C | Steatosis (50%) |
| HL1249 | M | 59 | H | Normal |
| HL1274 | F | 55 | AA | Normal |
| HL1278 | M | 59 | C | Normal |
| HL1281 | M | 16 | C | Normal |
| HL1286 | M | 50 | C | Normal |
| HL1299 | M | 57 | AA | Steatosis (50%) |
| HL1307 | F | 12 | C | Normal |
| HL1308 | M | 64 | C | Normal |
| HL1320 | F | 67 | C | Normal |
| HL1328 | F | 43 | C | Normal |
| HL1356 | F | 25 | C | Normal |
| HL1361 | F | 23 | C | Normal |
| HL1363 | M | 22 | C | Normal |
Bold font indicates liver samples that were diagnosed to be steatotic (information obtained from LTCDS and Fisher et al. [27]).
C, Caucasian; AA, African-American; H, Hispanic.
Steatosis is defined as: >10% hepatocytes with fat deposition. Actual % provided by LTCDS is shown in parentheses.
Chemicals and reagents
para-Nitrophenyl valerate (pNPV), 4-methylumbelliferyl acetate (4-MUBA), procaine, benzil (diphenylethane-1,2-dione) and buffer components were purchased from Sigma (St. Louis, MO). 1R-trans-Resmethrin (also called bioresmethrin) was from Chem-Service (West Chester, PA). The activity-based serine hydrolase probe, fluorophosphonate-biotin (FP-biotin), was from Toronto Research Chemicals (North York, Ontario). HPLC grade solvents were from Burdick and Jackson. Recombinant human CES1 and CES2 proteins were expressed in baculovirus-infected Spodoptera frugiperda cells and purified [28,29]. Rabbit anti-CES1 and anti-CES2 were gifts from Dr. M. Hosokawa (Chiba University, Japan) and Dr. Phil Potter (St. Jude Children’s Hospital), respectively. Histidine-tagged β-actin protein and anti-histidine tagged β-actin antibodies were from Santa Cruz Biotechnology. Enhanced chemiluminescent substrate was from Pierce. Protein A-agarose beads were from Invitrogen (Carlsbad, CA). Streptavidin-agarose beads were from Bio-Rad (Hercules, CA). Rabbit pre-immune IgG was purchased from Biomeda Corp (Foster City, CA). Ten individual human liver microsomal samples and a pooled human liver microsomal sample were obtained from BD Biosciences (Woburn, MA). HepG2 cells were obtained from ATCC and cultured using the instructions provided. FP-azido and FP-rhodamine activity-based probes were purchased from Thermo Pierce. The rhodamine–alkyne tag was from Invitrogen.
Hepatic S9 fractions
Human liver S9 fractions were prepared as described previously [59] and stored at −80 °C in aliquots. S9 protein concentrations were determined using the BCA reagent (Pierce). To represent an “average human liver”, a pooled S9 sample was prepared using equal amounts of S9 protein from each individual. S9 fractions were prepared because CES enzymes are found in both microsomes and cytosolic fractions [30], and S9 is comprised of both subcellular fractions.
Enzymatic assay of hepatic S9 samples
Four reporter substrates were used to estimate the hydrolytic activity of the hepatic S9 fractions: pNPV, 4-MUBA, bioresmethrin, and procaine. All reactions were run in 50 mM Tris–HCl (pH 7.4) buffer. Single concentrations of substrate that are greater than the Km for the esterases were used. All reaction rates were corrected for non-enzymatic hydrolysis. Activity determinations for each liver sample were performed in triplicate. Raw data were converted to μmol product formed/min/mg of protein. Specific activities of S9 samples are reported as the means ± SD.
pNPV
pNPV was used to assay ‘total’ esterase activity by a spectrophotometric assay in the absence and presence of the pan CES inhibitor benzil [31]. Esterase activities were determined by monitoring the production of p-nitrophenol that was liberated from pNPV (500 μM, final concentration) by measuring the absorbance at 405 nm using a plate reader [32]. Liver S9 proteins were diluted into 50 mM Tris–HCl (pH 7.4) buffer for the assay.
4-MUBA
4-MUBA (500 μM, final concentration) was also used to assay ‘total’ esterase activity. Its hydrolysis activity was determined using a fluorescent plate reader as described in [32]. Liver S9 proteins were diluted into 50 mM Tris–HCl (pH 7.4) buffer for the assay.
Bioresmethrin
CES1 can specifically metabolize bioresmethrin [20]. Thus, hydrolysis of bioresmethrin (50 μM, final concentration) yields the ‘CES1 activity’ of the liver samples. Pilot experiments were performed to determine conditions (e.g., protein concentrations and incubation times) to maintain the metabolism in the linear range. Liver S9 fractions were diluted to 0.25–0.5 mg protein/ml in 50 mM Tris–HCl (pH 7.4) buffer and the incubation time was 15 min at 37 °C. Reactions were terminated with 250 μL acetonitrile containing an internal standard [10 μM of 3-(4-methoxy)-phenoxy-benzaldehyde]. After centrifugation the supernatant was analyzed by HPLC/UV assay to monitor hydrolysis of the pyrethroid insecticide, as described previously [20,33].
Procaine
Hydrolysis of procaine to 4-aminobenzoic acid is catalyzed specifically by CES2 [14]. Therefore, this analgesic drug (100 μM, final concentration) was used to estimate the ‘CES2 activity’ of the liver samples. Pilot experiments were performed to determine conditions (e.g., protein concentrations and incubation times) to maintain the metabolism in the linear range. Liver S9 proteins were diluted to 0.5 mg/ml in 50 mM Tris–HCl (pH 7.4) buffer. Reactions were terminated after 15 min at 37 °C with 250 μL acetonitrile containing an internal standard (3-aminobenzoic acid). After centrifugation the supernatant was analyzed by HPLC/UV assay, based on the method of Wu et al. [14].
7-Ethoxycoumarin
Oxidation of 7-ethoxycoumarin by hepatic S9 fractions was performed as previously described [34].
Immunoblotting
CES1 and CES2 were quantified in individual S9 samples by immunoblotting as previously described [20]. Briefly, S9 samples were subjected to SDS–polyacrylamide gel electrophoresis (PAGE), proteins were transferred to polyvinyldifluoride (PVDF) membranes, probed with rabbit anti-human CES1 or anti-human CES2 polyclonal antibodies, and mouse anti-His antibodies for 1 h at room temperature. Membranes were washed, followed by incubation with goat anti-rabbit and goat anti-mouse secondary antibodies conjugated to HRP. The chemiluminescent signal was recorded using X-OMAT photographic film (Eastman Kodak Co., Rochester, NY). The level of expression of CES1 and CES2 protein in each liver sample was normalized against the amount of Histagged β-actin (1 μg, internal standard) that was added to each sample immediately before electrophoresis. Band densities were determined using NIH Image J software and the following calculation made: (band density of CES/band density of His-tagged β-actin). Levels of native β-actin were not used for protein normalization because they were found to vary substantially in the liver samples.
Activity-based probe analysis of native CES1 activity
The fluorophosphonate (FP)-biotin probe is a serine hydrolase activity-based probe [35] used to measure native CES1 activity in liver S9 samples. Briefly, human liver S9 fractions were suspended in 50 mM Tris–HCl (pH 7.4) buffer (1 mg protein/ml) and either incubated with FP-biotin (2 μM final concentration) for 30 min or FP-biotin (0.2 μM final concentration) for 0, 1, 3, 5, 7 min in 25 μL (at room temp). FP-biotin was added to reactions from a DMSO stock (final DMSO amount in reactions, 2% v/v). Activity-based probe reactions were terminated by adding 10 μL of 6x SDS–PAGE loading buffer and heated at 95 °C (5 min). Samples were cooled and immediately loaded on a 10% SDS–PAGE gel. Proteins were separated by electrophoresis and transferred to a PVDF membrane. After blocking with 3% (w/v) non-fat milk, the membrane was probed with avidin-HRP (Sigma, 1:3000 v/v) for 30–60 min at room temp. The membrane was then washed 4x (~5–10 min each) with Tween buffer, and the Enhanced chemiluminescent substrate (Pierce) added for 5 min. The chemiluminescent signals on the membrane were captured on X-ray film and band intensities determined by densitometry using Image J (NIH). Plots of normalized integrated band density of native CES1 vs. reaction time were created. Negative control reactions consisted of proteomes that were heat denatured before treatment with FP-biotin.
Immunoprecipitation of CES1 from liver S9 fractions
CES1 was partially purified from hepatic S9 fractions by immunoprecipitation using methods previously outlined [36]. Briefly, two individual liver S9 fractions (HL1202 and HL1274) were solubilized in 10 mM Tris–HCl (pH 7.4) buffer containing 0.5% Brij (non-ionic detergent) for 1 h at 4 °C with rotation. The concentration of S9 protein in the solubilization buffer was 1 mg/ml. The solubilized samples were centrifuged (16,000g, 15 min, 4 °C) and the supernatant was mixed with either pre-immune rabbit IgG (non-specific) or rabbit anti-CES1 IgG (specific) antibodies that were linked to protein A-agarose beads. The antigens and beads were incubated for 3 h with tumbling (4 °C), followed by brief centrifugation to pellet beads. The beads were extensively washed as outlined [36] and then resuspended in 1 × SDS–PAGE loading buffer (30 μL total volume). The samples were incubated at room temp (5 min), followed by incubation at 95 °C (5 min). After cooling and brief centrifugation to pellet the beads, the supernatant was loaded on a 10% SDS–PAGE gel. Following electrophoresis the gel was stained with Coomassie blue to visualize proteins. Protein bands at Mr ~ 60 kDa and 80 kDa, which were only found in the samples precipitated with CES1 antibodies, were excised and digested in-gel with trypsin. The resulting peptides were desalted and subjected to MALDI-TOF/TOF mass spectrometry.
Enrichment of native CES1 from liver S9 fractions using FP-biotin
Liver S9 proteins (1 mg/ml) from HL1202 and HL1274 (either heat denatured or native) were incubated with 2-μM FP-biotin in 50 mM Tris–HCl (pH 7.4) buffer for 1 h at room temperature. The reactions were quenched by adding SDS to a final concentration of 0.5% (w/v) and heating at 95 °C for 5 min. After cooling to room temp, excess FP-biotin was removed by centrifuging the samples in 3000 Da MWCO spin filters. The biotinylated proteins were incubated with streptavidin–agarose beads (1/10 volume) at room temp for 2 h on a tumbler. After washing the beads (2 × with 50 mM Tris, pH 7.4, containing 0.2% SDS; 2× with 50 mM Tris, pH 7.4), the trapped biotinylated proteins were eluted in 1× SDS–PAGE loading buffer (50 μL) and heated (95 °C, 5 min). After cooling and brief centrifugation to pellet the beads, the supernatant was loaded on a 10% SDS–PAGE gel. After electrophoresis, the gel was stained with Coomassie blue.
Quantitation of arachidonic acid in human livers
Non-esterified arachidonic acid (AA)1 levels in human livers were determined in the following manner. Approximately 0.025– 0.05 g of frozen liver tissue (exact weight recorded) was placed into a glass scintillation vial. One-mL of aqueous 1% (w/v) NaCl was added to the tissue, followed immediately by 2 mL of CHCl3 and 1 mL of methanol. The livers were homogenized on ice using a Branson sonicator probe in a biosafety hood. After homogenization, 26 nmol of AA-d8 (deuterated arachidonic acid, internal standard) was added to each homogenate. The homogenates were centrifuged (3500 rpm, 10 min) and the organic layer transferred into a clean test tube (16 × 100 mm). The tissue homogenates were then re-extracted with 2:1:2 (v/v/v) CHCl3: methanol: 1% NaCl/1% formic acid solution. The mixture was centrifuged and the organic layers from the two extracts were combined in the same test tube and evaporated to dryness under nitrogen gas. The lipid residues were re-suspended in 1:1 (v/v) methanol/isopropanol (200 μL), filtered (0.22 μm), and the clear filtrate transferred to LC vials containing volume reducing inserts for targeted LC–MS analysis of arachidonic acid. LC–MS conditions for AA are specified in [9]. AA was quantified by comparing the area of the m/z 303 peak (endogenous AA) with the area of the m/z 310 peak (deuterated AA standard, representing 26 nmol) in the same chromatographic run. An empirical correction factor of 4.305 was used to account for the lower ionization efficiency of AA-d8 relative to native AA when equimolar amounts of standards were analyzed on the Thermo MSQ single-quadrupole mass spectrometer. AA amounts were normalized on liver wet weight.
Bioorthogonal activity-based probes and click chemistry
Cultured HepG2 cells were seeded into 6-well plates and grown to 80% confluence in complete growth medium. The cells were treated with FP-azido (2 μM) for 4 h, followed by removal of the probe. After washing the cells with fresh serum-free medium (2×), the cells were incubated with 1 μM paraoxon for 1 h to inhibit any remaining CES1 and 2 proteins that did not react with the FP-azido probe. The cells were then washed to remove paraoxon and fresh complete medium was added to the cells, which was replaced every 2 days with fresh medium. Cells were lysed in cold 50 mM Tris–HCl (pH 7.4) buffer by sonication on 0, 1, 2, 4, 5 and 6 days after the “pulse” of FP-azido. Protein concentrations were determined and click chemistry was done to tag the FP-azido-labeled proteins with rhodamine–alkyne [37]. The labeled proteins were separated by SDS–PAGE (denaturing) and visualized using a Typhoon fluorescent imager. Band densities were determined using NIH Image J. Separate experiments were done in which HepG2 cell lysate proteins were titrated with paraoxon (1– 1000 nM, 30 min, 37 °C), followed by treatment with FP-rhodamine (2 μM, 1 h, room temp) and subsequent SDS–PAGE to determine which serine hydrolases were most sensitive to the oxon. Further, intact HepG2 cells were treated with vehicle (ethanol) and paraoxon (0.1, 1.0 μM) for 1 h, followed by cell lysis and subsequent native PAGE and in-gel staining using the fluorogenic substrate 4-MUBA, as described by [30]. Finally, semi-quantitative western blots were performed on HepG2 cell lysates to estimate CES1 and CES2 protein content using known amounts of recombinant human CES1 and CES2 proteins as standards.
Data analysis and statistics
Correlations of enzyme activity using the various ester substrates were determined with Sigma Stat or Sigma Plot using Pearson’s correlation analysis. Immunoblot data was expressed as relative values and CES protein expression levels were correlated with hepatic S9 activities (bioresmethrin or procaine activities) using Pearson’s correlation analysis. The level of significance for correlation analysis was set at p ≤ 0.05. Differences between two groups were assessed using Student’s t-test.
Results
Carboxylesterase phenotype in human livers: correlation of hydrolytic activities
The data reported here is a snapshot of the carboxylesterase activities found in 25 human livers. Although 6 of the 25 livers exhibited evidence of steatosis (Table 1) there was no statistical difference between the hydrolytic activities of the steatotic livers and normal livers (p > 0.05, Student’s t-test) when assessed using all of the esterase substrates (pNPV, 4-MUBA, bioresmethrin, and procaine). Consequently, all livers (n = 25) were grouped together in this study for analysis of carboxylesterase phenotype. Future studies with larger numbers of fatty and normal livers will be needed to determine whether diseased livers exhibit altered hydrolytic activities as compared to normal livers.
Our initial phenotyping study of 25 individual human livers used a correlative approach to compare the hydrolytic activities obtained with four different ester-containing substrates (Table 2). Significant correlations were found when the hydrolysis rates of pNPV and bioresmethrin (r = 0.58, p = 0.003) or 4-MUBA and bioresmethrin (r = 0.53, p = 0.006) were compared. pNPV and 4-MUBA are thought of as universal substrates for esterases and are hydrolyzed by both CES1 and CES2 [30], whereas bioresmethrin is hydrolyzed by CES1 only [20]. Furthermore, pNPV and 4-MUBA hydrolysis rates among the liver samples were highly correlated with each other (r = 0.82, p < 0.001), suggesting that both substrates report on the same panel of hydrolytic enzymes in liver. Moreover, addition of benzil (50 μM final concentration), a compound that inhibits both CES1 and CES2 [31,38], to the hepatic S9 fractions ablated the hydrolysis of pNPV (% inhibition, 97.7 ± 2.1%; mean ± SD, n = 25 livers), indicating that CES1 and CES2 accounts for the bulk of the pNPV hydrolytic activity in human liver. Interestingly, when the liver samples were used to measure cytochrome P450 activity (oxidation of 7-ethoxycoumarin), a poor correlation with CES1 hydrolytic activity (hydrolysis of bioresmethrin) was noted (r = 0.24, p > 0.05). This indicates that livers that exhibited good CES activity do not necessarily exhibit good activity toward CYP substrates, and vice versa.
Table 2.
Correlation analysis of human liver S9 fractions: Hydrolysis of ester-containing substrates correlation coefficients (r) from linear regression analysis.
| Substrate | pNPV | 4-MUBA | Bioresmethrin | Procaine |
|---|---|---|---|---|
| pNPV | – | 0.82 (<0.001a) | 0.58 (0.003) | 0.49 (0.01) |
| 4-MUBA | – | 0.53 (0.006) | 0.14 (0.50) | |
| Bioresmethrin | – | 0.32 (0.12) | ||
| Procaine | – |
p Value for linear regression analysis are in parentheses. r values in bold font are significant (p < 0.05).
Only modest correlation of enzyme activity between pNPV and procaine (a CES2-specific substrate) was observed (r = 0.49, p = 0.01), whereas no significant correlation between 4-MUBA and procaine was found (r = 0.14, p = 0.50). As expected, when the hydrolysis rates of the individual liver samples were compared using bioresmethrin (CES1-specific substrate) and procaine (CES2-specific substrate), no significant correlation was noted (r = 0.32, p = 0.12) indicating that these two substrates are hydrolyzed by different enzymes. Taken together, this initial correlation analysis indicated that the hydrolysis activities of pNPV and 4-MUBA can predict the CES hydrolytic phenotype of human livers reasonably well. It also demonstrated that bioresmethrin and procaine can be used as selective probes to examine CES1- and CES2-esterolytic activities in human liver samples, respectively.
Expression of CES1 and CES2 protein in human liver
CES1 and CES2 proteins are both found in human liver microsomes (HLM) ([30]), although CES1 is ~50-fold more concentrated than CES2 (Fig. 1A and [12]). CES1 is also present in human liver cytosol (HLC) [30,39], but at lower levels (4-fold) than in the microsomal fraction. It is also known that esterase activity is greater in the microsomal fraction than in the cytosolic fraction when assessed with various ester-containing substrates [30,40]. Since CES1 is found in both the microsomal and cytosolic fractions of liver, S9 fractions were used in this study to examine the interindividual expression of CES1 protein. Increasing amounts of protein from a representative human liver S9 sample were loaded onto an SDS–PAGE gel to determine the appropriate amount for quantitative western blotting (Fig. 1B). Accordingly, 0.2 μg of liver S9 protein was selected because this amount was within the linear portion of the CES1 band intensity vs. S9 protein amount curve. On the other hand, for CES2, 5 μg was found to be the appropriate amount of S9 protein to load on SDS–PAGE gels (data not shown).
Fig. 1.

CES1 and CES2 protein content in human liver. (A) Quantities of CES1 and CES2 found in an average human liver determined by immunoblotting [12]. *p < 0.05; Student’s t-test. (B) Representative immunoblot of CES1 protein in liver S9 fraction. Increasing amounts (0.1–2.0 μg) of denatured human liver S9 protein were loaded on a SDS–PAGE gel. The intensity of the immunoreactive bands was plotted vs. protein amount.
No correlation between native CES1 enzyme activity and CES1 protein levels in individual human livers
We next investigated the S9 fractions of the 25 individual human livers by western blotting to measure CES1 protein abundance and enzyme activity assays to measure the hydrolysis of a specific CES1 substrate, bioresmethrin. These results are shown in Fig. 2. Marked variation in native CES1 enzymatic activities was noted (17-fold difference between the highest and lowest activities, CV = 54%), yet the native CES1 activities did not correlate with CES1 protein abundance in the livers (r = 0.32, p = 0.45, n = 25). Moreover, the abundance of CES1 protein in the 25 livers was remarkably similar (CV = 20%). These data indicate that the mere abundance of CES1 protein expression in human liver does not predict its native biochemical activity. Further, spectral counting of proteomic mass spectrometry data obtained using randomly selected liver samples that exhibited high and low CES enzyme activity indicated that CES1 protein was equally abundant in these samples (spectral counts for CES1: poor metabolizer, 109 ± 1; good metabolizer, 124 ± 21; p = 0.41, Student’s t test), thus validating the western blot data.
Fig. 2.

CES1 protein amounts do not predict its biochemical activity in human liver. (A) Equal amounts of human liver S9 proteins (0.2 μg) were subjected to SDS–PAGE and immunoblotting using anti-CES1 and anti-His antibodies. His-tagged β-actin (1 μg) was added to each sample before electrophoresis as an internal standard to control intergel variations. Numerical values below each lane represent the relative expression of CES1. (B) Human liver S9 samples were used to determine their hydrolytic activity with a CES1-specific substrate, bioresmethrin. Bioresmethrin hydrolysis reactions using human S9 fractions (total reaction volume, 250 μL) were performed in 50 mM Tris–HCl buffer (pH 7.4) after adding bioresmethrin to a final concentration of 50 μM. Reactions were terminated after 15 min with 250 μL acetonitrile containing an internal standard [10 μM 3-(4-methoxy)-phenoxy-benzaldehyde]. After centrifugation, the supernatant was analyzed by HPLC/UV. Specific activities of each individual liver sample are reported as pmol/min/mg protein (mean ± SD, n = 3 per hepatic S9 sample) and plotted in order from poorest metabolizer to greatest metabolizer of bioresmethrin.
Confirmation that the reduced hydrolytic activity in human liver was due specifically to attenuated CES1 activity was shown by using the activity-based chemical probes fluorophosphonate (FP)-biotin [35] or FP-rhodamine [41]. These probes contain an organophosphate chemotype linked to either a biotin or rhodamine tag and react covalently with the serine residue in the active site of functional serine hydrolases, but do not react with inactive or denatured proteins [51]. Thus, they can be used to interrogate the functional CES1 activity in complex proteomes such as liver (see Fig. 3A and B). Of the serine hydrolases in human liver, the carboxylesterases at Mr ~ 60 kDa were covalently labeled by FP-rhodamine and FP-biotin to the greatest extent, followed by arylacetamide deacetylase (AADA; Mr ~ 45 kDa). Although CES1 and CES2 are equally reactive toward these activity-based probes (data not shown) and cannot be separated by SDS–PAGE, which is a limitation of the gel-based assay, the 60 kDa bands in Fig. 3 are designated CES1 on the basis that ~98% of the carboxylesterase content in liver is attributed to CES1 (see Fig. 1). In general, the extent of reaction of 8 liver samples (4 poor metabolizers; four good metabolizers) with FP-biotin (Fig. 3B) mirrored its hydrolytic activity toward the substrates pNPV, 4-MUBA, or bioresmethrin (r > 0.6, p < 0.05). In addition, when liver proteomes from a poor metabolizer (HL1202) and good metabolizer (HL1274) of bioresmethrin were treated with 0.2 μM FP-biotin for increasing amounts of time (0– 7 min), the intensity of the biotinylated CES1 band in HL1202 was faint and did not change between 1 and 7 min, whereas the intensity of the CES1 band in HL1274 was strong and steadily increased from 1 to 7 min, indicating a greater extent of covalent modification by the probe (see Fig. 4). Thus, FP-biotin could distinguish the functional activity of CES1 in each liver sample and further demonstrated that variable CES1 biochemical activities exist in human livers.
Fig. 3.

Carboxylesterases are the major serine hydrolases found in human liver extracts. (A) Individual liver microsomes with low (L) and high (H) carboxylesterase activity based on reactivity toward FP-rhodamine. (B) Individual liver S9 proteins (1 mg/ml) were treated with 2-μM FP-biotin for 1 h at room temperature. The quenched reactions were subjected to SDS–PAGE, transferred to PVDF membranes and probed with avidin conjugated to HRP to detect FP-biotin-labeled proteins. The + pre-heat lanes correspond to proteins that react with FP-biotin after heat denaturation of liver proteins and is caused by non-specific binding of FP-biotin to protein. The − pre-heat lanes correspond to non-denatured (native) proteins that react with FP-biotin. Note the difference between Sample 1202 (a poor metabolizer) and 1274 (a good metabolizer). AADA, arylacetamide deacetylase.
Fig. 4.

Time course for reaction between FP-biotin and two human liver samples (HL1202 and HL1274). (A) Left, HL1202 and HL1274 are poor and good metabolizers of bioresmethrin, respectively. Hydrolysis data for HL1202 and HL1274 from Fig. 2 are reproduced here for comparative purpose. Error bars are not shown but the coefficient of variation for each liver sample was <7%. Right, western blots of HL1202 and HL1274 probed for CES1 and His-tagged β-actin. Relative amount of CES1 is indicated. (B) Avidin-HRP blotting of biotinylated proteins following a 0–7 min reaction of the two liver samples (S9 fraction) with 0.2 μM FP-biotin. CES1 protein is indicated with arrow. The arrow designated as “Non specific” refers to a liver protein that is not enzymatically active but is labeled by FP-biotin.
We next partially purified CES1 protein from solubilized hepatic extracts of poor esterase activity livers (HL1202) and good esterase activity livers (HL1274) by immunoprecipitation. The resulting precipitated proteins were then separated by one-dimensional SDS–PAGE analysis and the Coomassie stained protein bands at Mr ~ 60 kDa were identified to be CES1 by MALDI-TOF/TOF MS (Fig. 5). This result confirmed the western blot data shown in Fig. 2A by demonstrating that near identical amounts of CES1 protein are immunoprecipitated from equivalent amounts of HL1202 and HL1274 liver protein. The dichotomy between CES1 protein abundance and catalytic activity in HL1202 and HL1274 livers was further demonstrated when native proteomes from the two livers were treated with the activity probe, FP-biotin, and the resulting biotinylated proteins enriched by incubation with streptavidin-agarose beads. When the captured proteins were subjected to SDS–PAGE analysis, followed by Coomassie blue staining, a marked difference in CES1 band intensity was noted between the two samples (Fig. 6). This approach indirectly measures the activities of native CES1 in the two human livers and the results obtained are consistent with the differential bioresmethrin specific activities found for HL1202 and HL1274 (Fig. 2B).
Fig. 5.

Immunoprecipitation of CES1 protein from HL1202 and HL1274 liver S9. Control IgG and hCE1 IgG represent samples of liver S9 protein that had been incubated overnight with pre-immune rabbit IgG and rabbit anti-CES1 IgG antibodies (linked to protein A-agarose beads), respectively. Precipitated proteins were washed and subjected to SDS–PAGE and Coomassie blue staining. The boxed bands designated as CES1 were excised and digested with trypsin, and the peptides were analyzed by MALDI-TOF/TOF MS, which confirmed their identity. Note the identical band intensity of CES1 in HL1202 and HL1274. The band with Mr ~ 80 kDa in the hCE1 IgG lanes was identified as an albumin precursor by MALDI-TOF MS.
Fig. 6.
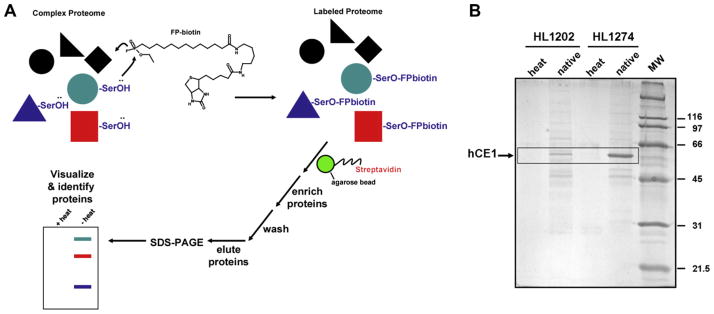
Treatment of liver S9 samples (HL1202 and HL1274) with FP-biotin demonstrates that native CES1 in HL1274 is more catalytically active than native CES1 in HL1202. (A) General strategy to evaluate the native enzyme activity of CES1 in complex liver proteomes using the activity-based probe FP-biotin. Proteomes are treated with FP-biotin, which only reacts with catalytically “active” serine hydrolases. The biotin-labeled proteins are enriched by incubation with streptavidin-conjugated agarose beads. After thorough washing of the beads, proteins are eluted, separated by SDS–PAGE and visualized by Coomassie blue staining. (B) S9 proteins from each liver sample (both heat denatured and native proteins) were incubated with 2-μM FP-biotin for 1 h at room temperature. To quench reactions, SDS was added to each sample at a final concentration of 0.5% (w/v), and samples heated at 95 °C for 5 min. Following removal of unreacted FP-biotin using 3000 Da MWCO spin filters, samples were incubated with streptavidinagarose beads at room temp for 2 h. After vigorous washing of beads, the trapped biotinylated proteins were eluted in SDS–PAGE loading buffer, heated, and separated by SDS–PAGE. After electrophoresis, the gel was stained in Coomassie blue. The boxed bands indicate the Rf of CES1. Note that HL1274 has a more catalytically-active CES1 protein than HL1202, based on the more intensely stained band detected. heat, proteomes were heat denatured before adding FP-biotin; native, proteomes were not heat denatured prior to adding FP-biotin.
The levels of arachidonic acid in human livers were not correlated with native CES1 activity
A previous study of ours had shown that recombinant CES1 and native CES1 in intact cells could be inhibited by AA [42]. Based on these findings, we hypothesized that free AA might bind to and inhibit CES1 in the liver. Accordingly, we speculated that levels of AA in individual human livers might be inversely correlated with native CES1 biochemical activity. Thus, we measured the amount of free (unesterified) AA in whole liver extracts by targeted LC–MS analysis (Fig. 7). The average amount of free AA measured in all 25 livers (330 ± 40 nmol/g liver, mean ± sem) agreed well with previous reports [43]. However, the data do not provide evidence that the amount of AA present in human livers is inversely correlated with CES1 biochemical activity (r = −0.078, p > 0.05). Furthermore, extraction of four hepatic S9 fractions (two poor metabolizers and two good metabolizers) instead of whole liver did not indicate that high quantities of AA were present in the poor metabolizer livers and low quantities in the good metabolizers (data not shown). In confirmation of this, no differences in the profile of hydrolytic activities were found when solubilized S9 proteins from poor and good metabolizers were assayed for CES activity before and after being thoroughly desalted with a 3000 kDa MWCO spin filter, which would have removed any small molecules that might have been inactivating enzyme activity (data not shown). Taken together, these results indicate that inhibition of native CES1 activity by AA does not account for the differential hydrolytic activities, thus the activity differences appear to be intrinsic to the enzymes themselves and not due to a reversibly acting small molecule inhibitor present in the samples.
Fig. 7.

Content of arachidonic acid in human livers does not explain interindividual variation in CES1 activities. (A) The CES1 specific activities (determined using bioresmethrin) of the liver samples were divided into three groups (tertiles). Significant differences in enzymatic activities were noted when the mid and high tertile groups were compared to the low tertile group (*p < 0.05, one-way ANOVA and Dunnett’s test). (B) The quantities of arachidonic acid in the liver samples do not parallel the CES1 hydrolytic activity in the three tertile groups. (C) The amount of arachidonic acid present in individual human livers was not correlated with its CES1 activity (r = 0.078, p > 0.05).
No correlation between native CES2 enzyme activity and CES2 protein levels in individual human livers
Similar to CES1, no correlation between CES2 protein abundance and CES2 enzyme activity as assessed using the CES2-specific substrate procaine was noted in the liver samples (r = 0.31, p = 0.47, n = 25). The differences in native CES2 enzymatic activities in this small population were slight (3-fold difference between the highest and lowest activities, CV = 32%; see Fig. 8) when compared to the native CES1 activities (Fig. 2). In addition, the maximal difference in CES2 protein amounts was only ~2-fold among the 25 livers (CV = 22%); thus, CES2 protein abundance does not likely predict native CES2 activity in liver. Similar findings were found when 10 individual human liver microsomes were examined; procaine activity and CES2 protein amounts were poorly correlated (r = 0.39, p > 0.05). CES2 protein levels varied among the human liver microsomes by 32% (Fig. 9), which is higher than the variation previously found for CES1 protein in microsomes (CV = 9%; [20]).
Fig. 8.

CES2 protein amounts in human liver and hydrolysis of procaine. ( A) Equal amounts of human liver S9 proteins ( 5 μg) were subjected to SDS–PAGE analysis and immunoblotting using anti-CES2 and anti-His antibodies. His-tagged β-actin (1 μg) was added to each sample before electrophoresis as an internal standard to control intergel variations. Numerical values below each lane represent the relative expression of CES2. (B) Human liver S9 samples were used to determine their hydrolytic activity with the CES2-specific substrate, procaine. Procaine hydrolysis reactions using human S9 fractions (total reaction volume, 250 μL) were performed in 50 mM Tris–HCl buffer (pH 7.4) after adding procaine to a final concentration of 100 μM. Reactions were terminated after 15 min with 250 μL acetonitrile containing an internal standard (3-aminobenzoic acid). After centrifugation the supernatant was analyzed by HPLC/UV. Specific activities of each individual liver sample are reported as pmol/min/mg protein (mean ± SD, n = 3 per hepatic S9 sample) and plotted in order from poorest metabolizer to greatest metabolizer of procaine.
Fig. 9.
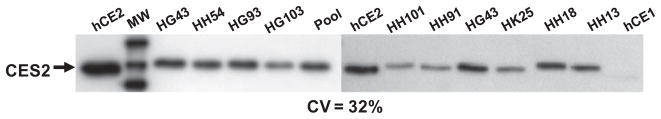
CES2 protein amounts in individual human liver microsomes. Commercially available human liver microsomes (5 μg protein) were subjected to SDS–PAGE analysis and immunoblotting using anti-CES2 antibodies. Bands on the film were quantified by densitometry. The specificity of the antibody is shown by its reactivity with recombinant hCE2 protein (50 ng) and lack thereof with recombinant hCE1 protein (50 ng). hCE1, recombinant CES1 protein; hCE2, recombinant CES2 protein; pool, 25 individual HLMs pooled together.
Stability of CES1 and CES2 proteins in cultured HepG2 cells
The remarkable consistency in CES1 and CES2 protein amounts in the individual human livers observed using western blotting suggested that these proteins may have a long half life in liver. We examined this issue using the human hepatoma cell line HepG2 and commercially available activity-based probes that can penetrate intact cells and label serine hydrolases such as CES (FP-azido). The in situ labeled proteins that are formed are then linked to rhodamine–alkyne tags via click chemistry methods [37] and are subsequently analyzed by denaturing SDS–PAGE and fluorescent scanning. In situ labeling of serine hydrolases in HepG2 cells indicated that carboxylesterases (CES1 and CES2) and AADA were the most intensely labeled proteins (Fig. 10A). On the basis of semi-quantitative western blots, we found that CES1 was only 2- fold more abundant than CES2 in HepG2 cells (Fig. 10E), which is markedly different than the 50-fold difference seen in human liver (Fig. 1). Therefore, we designated the CES band in the activity gels as CES1/2 to indicate the fact that these two isoforms are not resolved by SDS–PAGE and co-migrate on denaturing gels. The use of clickable probes can enable estimates of protein half lives in living cells [44]. As shown in Fig. 10B, when the half-life of the CES1/2 band (96 h) was compared to AADA (25 h) a marked difference was noted, which suggests that the carboxylesterase proteins are relatively stable proteins. Compared to other serine hydrolases in HepG2 cells, CES1 and CES2 are the most sensitive to the inhibitory effects of paraoxon, which is the bioactivated metabolite of the OP insecticide parathion (see Fig. 10C and D). Similar inhibition potencies were observed in vitro and in situ.
Fig. 10.

CES activity and half-life in intact cultured HepG2 cells. (A) In situ labeling of serine hydrolases in intact HepG2 cells by FP-azido, followed by click chemistry after cell lysis using Rh-alkyne tag to permit visualization after SDS–PAGE using a Typhoon fluorescent imager. The primary serine hydrolases detected are CES (CES1 and CES2, which comigrate on SDS–PAGE and are therefore designated CES1/2) and arylacetamide deactetylase (AADA). (B) Turnover of CES1/2 and AADA proteins in HepG2 cells. Cells were pulsed for 4 h with 2 μM FP-azido, then washed to remove excess probe. Cells were then lysed at the indicated time points and click chemistry reactions performed to link the FP-azido-labeled proteins to the Rh-alkyne tag. Following SDS–PAGE, the serine hydrolases CES1/2 and AADA were visualized and the band intensities plotted vs. time. The data were fit to the equation: I = I0 * e−kobs*t to obtain the pseudo-first order rate of protein decay (kobs) and to estimate half-lives of each protein. Data are representative of two independent experiments. (C and D) In HepG2 cells, CES1 and CES2 are the most sensitive serine hydrolases to the inhibitory effects of paraoxon. (C) Cell lysates of HepG2 were incubated with increasing amounts of paraoxon, followed by addition of FP-rhodamine probe and subsequent SDS–PAGE. The CES1/2 band intensity is markedly attenuated by paraoxon pre-treatment. Δ symbol indicates that the cell lysate was boiled prior to addition of FP-rhodamine. (D) Similar findings were observed when intact HepG2 cells were treated with the indicated amounts of paraoxon for 1 h, followed by cell lysis and subsequent native PAGE analysis. This approach showed that CES1 and CES2 are equally inhibited at 0.1 μM paraoxon in situ. CES1 is recombinant human CES1 protein, which was used as a standard. (E) Semi-quantitative western blots of HepG2 cell lysates indicate that CES1 is expressed 2-fold higher than CES2. Protein amounts in HepG2 cells were determined by comparison to a calibration curve prepared using the indicated amounts (1–50 ng) of recombinant CES1 and CES2 proteins.
Discussion
The carboxylesterases are an important family of xenobiotic detoxifying enzymes found in the mammalian liver. These promiscuous enzymes catalyze the hydrolysis of several pollutants, including pyrethroid and organophosphate insecticides. Pyrethroids will soon eclipse organophosphates in terms of total insecticide usage in the US. Thus, human populations will be increasingly exposed to these compounds. In addition, drugs used to treat disease are often administered in the form of pro-drugs that contain ester bonds and are hydrolyzed by CES to the active molecule [45]. Accordingly, investigation of the interindividual variation in carboxylesterase activities in human livers is important to study because of the role that this enzyme family plays in xenobiotic and endobiotic metabolism. The main findings of this study are that CES1 is the principal esterase in human liver responsible for the hydrolytic metabolism of substrates with ester bonds. Moreover, it showed that marked variation in the esterolytic metabolism of a pyrethroid pesticide (bioresmethrin), which is specifically hydrolyzed by CES1, was observed among the individual livers. Yang et al. [25] and our laboratory [20] had previously shown that bioresmethrin is hydrolyzed by CES1, but not CES2, when using pure recombinant enzymes. Interestingly, the level of CES1 protein expressed in the livers was remarkably invariant and did not parallel the CES1 activities measured using either ester-containing substrates or the serine hydrolase probe FP-biotin. Hatfield et al. [46] also showed that CES1 protein amounts in individual human liver microsomes were similar to each another. This suggested that the biochemical activities of native CES1 in human liver may vary in the population, but that mere CES1 protein abundance will not predict this variation. Furthermore, the estimated half life of CES1/2 in a cultured hepatocyte cell line (96 h) suggests that these proteins are quite stable and likely have important homeostatic functions.
Correlation analysis of human livers showed that hydrolysis rates of the CES1-specific substrate bioresmethrin, but not the CES2-specific substrate procaine, were significantly correlated with the hydrolysis rates of the general ester substrates pNPV and 4-MUBA (Table 2). This is despite the fact that pNPV and 4-MUBA are actually hydrolyzed by pure CES2 protein more efficiently than CES1 protein [28,47]. These findings probably reflect the much higher levels (50-fold) of CES1 protein expressed in liver relative to CES2 [12]. They also suggest that both pNPV and 4-MUBA are mainly hydrolyzed by CES1 in human liver S9. Overall, these results are consistent with Hatfield et al. [46], who showed that the chemotherapeutic prodrug CPT-11 was principally hydrolyzed by CES1 in human liver microsomal extracts despite the fact that it is more efficiently hydrolyzed by recombinant CES2 than recombinant CES1. Therefore, due to its 50-fold greater abundance over CES2, CES1 is probably responsible for the hydrolysis of most ester-containing substrates even when it is not as intrinsically efficient as CES2 at hydrolyzing these compounds.
The variable hydrolytic activity of human liver extracts toward the CES1-specific substrate bioresmethrin initially suggested that variable levels of CES1 protein abundance were responsible for this observation. However, the amounts of CES1 protein detected in liver samples by immunoblotting (Fig. 2) or immunoprecipitation (Fig. 5) were remarkably similar and did not correlate with native CES1 activity. Previous findings from us [20] and others [46] have shown that CES1 protein content does not vary significantly in individual adult human liver microsomes. However, significant differences were noted in the hydrolytic activities of the same liver samples when assessed with either pyrethroids or CPT-11. The differences in CES1 and CES2 protein expression observed between juvenile and adult human livers and the positive correlation of hydrolytic activities with CES protein levels that was previously reported [25,26] is different from our current results. We argue that the reason for this difference is that the previous reports utilized livers from infants, children, and elderly adults, and that these vastly different age groups will exhibit dramatically different carboxylesterase expression patterns that can account for the positive correlation with enzyme activity. In our study, except for a single individual, we used adult livers with a mean (±SD) age of 46.7 (±17.8) yrs (Table 1), thus our study mainly examined a middleaged cohort with a much lower age variation than was reported by both Yang et al. [25] and Zhu et al. [48]. It is well established in both animal models and humans that carboxylesterase protein expression increases with developmental age [25,49]. Together our current and previous findings are somewhat surprising and suggest that environmental and lifestyle factors do not seem to influence interindividual CES1 protein expression in adult human liver, which was a mechanism suggested by others to account for variable esterase activities in humans [50,51]. Evidence that variable hydrolytic activity among the livers was due to differences in CES1 activity was demonstrated in the current study by the variation in FP-biotin’s ability to react with CES1 in these samples (Figs. 3, 4 and 6). Activity-based probes report the activity of enzymes in their native state rather than measure protein content [52].
Since variation in hydrolytic activity observed in adult human livers does not result from differences in CES1 protein expression or the presence of endogenous small molecules, such as arachidonic acid, that inactivate CES1 activity (Fig. 7), what other mechanisms might account for the different native CES1 activities observed?While answers to this question are elusive, we postulate the following possibilities: (i) amino acid variants in the CES1 primary sequence; (ii) alternative splice sites in the gene; (iii) and/or differences in post-translational modifications (PTMs), including the possibility that the variation in CES1 activities might be due to OP-mediated inhibition since CES1 is exquisitely sensitive to chemical modification by oxons [4]. These possibilities, in combination or separately, could feasibly modulate CES enzymatic activity in human liver and contribute to the carboxylesterase phenotype. The human CES genes do not have a high frequency of coding SNPs. A genotyping study of 120 individuals identified 16 and 10 SNPs in CES1 and CES2 genes, respectively [53]. However, the majority of the SNPs occurred in introns and untranslated regions, whereas only a small number were present in exons. Two non-synonymous coding SNPs were found in CES1, and none were detected in CES2 in this study. However, the functional effects of the identified cSNPs on CES1 enzyme activity were not determined, although a more recent study revealed a rare mutation at codon 143 in the CES1 gene (p.Gly143Glu; <4% minor allele frequency) that caused a 5.4-fold decrease in enzyme activity when the recombinant protein was expressed and assayed [26]. The probability of finding an individual who is homozygous for this particular CES1 variant is 1/625 (0.16%); therefore, the low metabolizers in our small population are unlikely to be homozygous for the variant allele, although based on a 4% minor allele frequency one individual in our population may be heterozygous for the variant allele.
The subcellular localization of CES1 may also be a determinant of the variable activity; it is well known that microsomal CES1 protein content is much more abundant than cytosolic CES1 in the same liver [39]. We previously showed that when the hydrolytic activity of CES1 in pooled human liver microsomes and cytosols were compared, markedly higher hydrolytic activity was detected in the microsomal fraction compared to the cytosolic fraction, which was consistent with the higher CES1 protein level in the microsomes [30]. Further, in the same study, we observed significant variation in the CES1 protein content of individual liver cytosols, which also correlated with the hydrolytic activity of the cytosolic fractions. Thus, there may be a functional difference between the membrane bound form of CES1 and the soluble CES1 form. Tabata et al. [39] demonstrated that both forms of CES1 are identical in structure; the cytosolic CES1 form also does not possess a signal peptide. It is possible that the topology of CES1 in membranes might lead to protein–protein interactions that are vital to the activity of the enzyme.
The variation in hydrolytic activities found in our small population may also be caused by the presence of variant ‘CES1 proteotypes’, which manifests as the observed CES phenotype. ‘Proteotypes’ are defined as all combinations of variations that alter the primary sequence of a single protein as they occur in populations and change over time, and encompass not only coding SNPs but also alternative splice forms and PTMs [54,55]. Thus ‘proteotypes’ of proteins are analogous to haplotypes of genes. Characterization of CES1 ‘proteotypes’ will necessitate 100% sequence mapping of the various CES1 isoforms in human liver by mass spectrometry methods. We are currently attempting to determine the feasibility of this approach with CES1.
The significance of the current study is that it adds to a growing body of work suggesting that individuals possess distinct carboxylesterase phenotypes [25,26,51]. Characterization of this phenotype rather than genotype is important because it will help stratify individuals into categories on the basis of their toxicological risk following exposure to ester-containing pollutants metabolized by CES. Conversely, personalized medicine approaches that aim to identify individuals who will better respond to therapies would also benefit from the characterization of a carboxylesterase phenotype, particularly in light of a renewed emphasis on the ester chemotype in pharmaceutical development [56]. Furthermore, since several different carboxylic acid ester drugs can be hydrolyzed by CES, information regarding drug-drug interactions may be gained by this approach. Although this study takes a first step toward evaluating the carboxylesterase phenotype in human liver, several challenges lie ahead. For example, is it possible to identify less-invasive biomarkers (e.g. a biomarker present in blood) that predict an individual’s carboxylesterase phenotype rather than examining liver tissue, which is not practical? This may be a particularly challenging issue because humans do not express significant levels of CES in plasma [57], in contrast to several other mammalian species. Interestingly, carboxylesterase biomarkers (CES1) linked to hepatocellular carcinoma have been detected in plasma from liver cancer patients [58], suggesting a possible route ahead for personalizing prodrug chemotherapy.
Acknowledgments
We thank LTCDS (NIH Contract # N01-DK-9-2310) for the liver samples, and Drs. M. Hosokawa and Phil Potter for anti-CES1 and anti-CES2 antibodies, respectively. We are grateful to Dr. Tibor Pecan (MSU) for MALDI-TOF MS assistance and Dr. Matt Patricelli (ActivX) for preliminary experiments using the FP-rhodamine probe. Research support was provided by NIH P20 RR017661 and NIH 1R15ES015348-01A1 and is gratefully acknowledged. Dr. Ran Wang was sponsored by the Jiangsu Academy of Agriculturual Sciences-Mississippi State University Visiting Scholars Program.
Footnotes
Abbreviations used: AA, arachidonic acid; AADA, arylacetamide deacetylase; CES1, carboxylesterase 1; CES2, carboxylesterase 2; FP-biotin, fluorophosphonate-biotin; hCE1, human carboxylesterase 1; OP, organophosphate; pNPV, p-nitrophenyl valerate; 4-MUBA, 4-methylumbelliferyl acetate.
References
- 1.Redinbo MR, Potter PM. Drug Discov Today. 2005;10:313–325. doi: 10.1016/S1359-6446(05)03383-0. [DOI] [PubMed] [Google Scholar]
- 2.Ross MK, Edelmann MJ. Carboxylesterases: A Multifunctional Enzyme Involved in Pesticide and Lipid Metabolism. ACS Books; in press. [Google Scholar]
- 3.Satoh T, Hosokawa M. Annu Rev Pharmacol Toxicol. 1998;38:257–288. doi: 10.1146/annurev.pharmtox.38.1.257. [DOI] [PubMed] [Google Scholar]
- 4.Crow JA, Bittles V, Herring KL, Borazjani A, Potter PM, Ross MK. Toxicol Appl Pharmacol. 2012;258:145–150. doi: 10.1016/j.taap.2011.10.017. [DOI] [PMC free article] [PubMed] [Google Scholar]
- 5.Dolinsky VW, Gilham D, Alam M, Vance DE, Lehner R. Cell Mol Life Sci. 2004;61:1633–1651. doi: 10.1007/s00018-004-3426-3. [DOI] [PMC free article] [PubMed] [Google Scholar]
- 6.Ghosh S, Zhao B, Bie J, Song J. Vascul Pharmacol. 2010;52:1–10. doi: 10.1016/j.vph.2009.10.002. [DOI] [PMC free article] [PubMed] [Google Scholar]
- 7.Ross MK, Streit TM, Herring KL, Xie S. Carboxylesterases: dual roles in lipid and pesticide metabolism. J Pestic Sci. 2010;35:257–264. doi: 10.1584/jpestics.R10-07. [DOI] [PMC free article] [PubMed] [Google Scholar]
- 8.Wei E, Ben Ali Y, Lyon J, Wang H, Nelson R, Dolinsky VW, Dyck JR, Mitchell G, Korbutt GS, Lehner R. Cell Metab. 2010;11:183–193. doi: 10.1016/j.cmet.2010.02.005. [DOI] [PubMed] [Google Scholar]
- 9.Xie S, Borazjani A, Hatfield MJ, Edwards CC, Potter PM, Ross MK. Chem Res Toxicol. 2010;23:1890–1904. doi: 10.1021/tx1002194. [DOI] [PMC free article] [PubMed] [Google Scholar]
- 10.Sanghani SP, Sanghani PC, Schiel MA, Bosron WF. Protein Pept Lett. 2009;16:1207–1214. doi: 10.2174/092986609789071324. [DOI] [PubMed] [Google Scholar]
- 11.Satoh T, Taylor P, Bosron WF, Sanghani SP, Hosokawa M, La Du BN. Drug Metab Dispos. 2002;30:488–493. doi: 10.1124/dmd.30.5.488. [DOI] [PubMed] [Google Scholar]
- 12.Godin SJ, Crow JA, Scollon EJ, Hughes MF, DeVito MJ, Ross MK. Drug Metab Dispos. 2007;35:1664–1671. doi: 10.1124/dmd.107.015388. [DOI] [PubMed] [Google Scholar]
- 13.Sun A, Jiang Y, Wang X, Liu Q, Zhong F, He Q, Guan W, Li H, Sun Y, Shi L, Yu H, Yang D, Xu Y, Song Y, Tong W, Li D, Lin C, Hao Y, Geng C, Yun D, Zhang X, Yuan X, Chen P, Zhu Y, Li Y, Liang S, Zhao X, Liu S, He F. J Proteome Res. 2010;9:50–58. doi: 10.1021/pr900191p. [DOI] [PubMed] [Google Scholar]
- 14.Wu MH, Chen P, Wu X, Liu W, Strom S, Das S, Cook EH, Jr, Rosner GL, Dolan ME. Pharmacogenetics. 2004;14:595–605. doi: 10.1097/00008571-200409000-00004. [DOI] [PubMed] [Google Scholar]
- 15.d’Esposito F, Nebot N, Edwards RJ, Murray M. Br J Clin Pharmacol. 2010;70:400–408. doi: 10.1111/j.1365-2125.2010.03715.x. [DOI] [PMC free article] [PubMed] [Google Scholar]
- 16.Shafer TJ, Meyer DA, Crofton KM. Environ Health Perspect. 2005;113:123– 136. doi: 10.1289/ehp.7254. [DOI] [PMC free article] [PubMed] [Google Scholar]
- 17.Casida JE, Quistad GB. Chem Res Toxicol. 2004;17:983–998. doi: 10.1021/tx0499259. [DOI] [PubMed] [Google Scholar]
- 18.Lemaire G, Mnif W, Pascussi JM, Pillon A, Rabenoelina F, Fenet H, Gomez E, Casellas C, Nicolas JC, Cavailles V, Duchesne MJ, Balaguer P. Toxicol Sci. 2006;91:501–509. doi: 10.1093/toxsci/kfj173. [DOI] [PubMed] [Google Scholar]
- 19.Leng G, Lewalter J, Rohrig B, Idel H. Toxicol Lett. 1999;107:123–130. doi: 10.1016/s0378-4274(99)00039-9. [DOI] [PubMed] [Google Scholar]
- 20.Ross MK, Borazjani A, Edwards CC, Potter PM. Biochem Pharmacol. 2006;71:657–669. doi: 10.1016/j.bcp.2005.11.020. [DOI] [PubMed] [Google Scholar]
- 21.Wheelock CE, Wheelock AM, Zhang R, Stok JE, Morisseau C, Le Valley SE, Green CE, Hammock BD. Anal Biochem. 2003;315:208–222. doi: 10.1016/s0003-2697(03)00002-2. [DOI] [PubMed] [Google Scholar]
- 22.Zhao B, Natarajan R, Ghosh S. Physiol Genomics. 2005;23:304–310. doi: 10.1152/physiolgenomics.00187.2005. [DOI] [PubMed] [Google Scholar]
- 23.Zhao B, Song J, St Clair RW, Ghosh S. Am J Physiol Cell Physiol. 2007;292:C405–412. doi: 10.1152/ajpcell.00306.2006. [DOI] [PubMed] [Google Scholar]
- 24.Nishi K, Huang H, Kamita SG, Kim IH, Morisseau C, Hammock BD. Arch Biochem Biophys. 2006;445:115–123. doi: 10.1016/j.abb.2005.11.005. [DOI] [PMC free article] [PubMed] [Google Scholar]
- 25.Yang D, Pearce RE, Wang X, Gaedigk R, Wan YJ, Yan B. Biochem Pharmacol. 2009;77:238–247. doi: 10.1016/j.bcp.2008.10.005. [DOI] [PMC free article] [PubMed] [Google Scholar]
- 26.Zhu HJ, Patrick KS, Yuan HJ, Wang JS, Donovan JL, DeVane CL, Malcolm R, Johnson JA, Youngblood GL, Sweet DH, Langaee TY, Markowitz JS. Am J Hum Genet. 2008;82:1241–1248. doi: 10.1016/j.ajhg.2008.04.015. [DOI] [PMC free article] [PubMed] [Google Scholar]
- 27.Fisher CD, Lickteig AJ, Augustine LM, Ranger-Moore J, Jackson JP, Ferguson SS, Cherrington NJ. Drug Metab Dispos. 2009;37:2087–2094. doi: 10.1124/dmd.109.027466. [DOI] [PMC free article] [PubMed] [Google Scholar]
- 28.Hatfield MJ, Tsurkan L, Hyatt JL, Yu X, Edwards CC, Hicks LD, Wadkins RM, Potter PM. Br J Pharmacol. 2010;160:1916–1928. doi: 10.1111/j.1476-5381.2010.00700.x. [DOI] [PMC free article] [PubMed] [Google Scholar]
- 29.Morton CL, Potter PM. Mol Biotechnol. 2000;16:193–202. doi: 10.1385/MB:16:3:193. [DOI] [PubMed] [Google Scholar]
- 30.Crow JA, Borazjani A, Potter PM, Ross MK. Toxicol Appl Pharmacol. 2007;221:1–12. doi: 10.1016/j.taap.2007.03.002. [DOI] [PMC free article] [PubMed] [Google Scholar]
- 31.Wadkins RM, Hyatt JL, Wei X, Yoon KJ, Wierdl M, Edwards CC, Morton CL, Obenauer JC, Damodaran K, Beroza P, Danks MK, Potter PM. J Med Chem. 2005;48:2906–2915. doi: 10.1021/jm049011j. [DOI] [PubMed] [Google Scholar]
- 32.Ross MK, Borazjani A. Curr Protocol Toxicol Unit. 2007;14.24:4.24.21–24.24.14. doi: 10.1002/0471140856.tx0424s33. [DOI] [PubMed] [Google Scholar]
- 33.Godin SJ, Scollon EJ, Hughes MF, Potter PM, DeVito MJ, Ross MK. Drug Metab Dispos. 2006;34:1764–1771. doi: 10.1124/dmd.106.010058. [DOI] [PubMed] [Google Scholar]
- 34.Guengerich FP. Analysis and characterization of enzymes and nucleic acids. In: Hayes WB, editor. Principles and Methods of Toxicology. 4. Chapter 35 Taylor and Francis; Philadelphia: 2001. pp. 1625–1687. [Google Scholar]
- 35.Kidd D, Liu Y, Cravatt BF. Biochemistry. 2001;40:4005–4015. doi: 10.1021/bi002579j. [DOI] [PubMed] [Google Scholar]
- 36.Bonifacino DAE. Curr Protocol Prot Sci Unit. 1999;9.8:9.8.1–9.8.28. [Google Scholar]
- 37.Speers AE, Cravatt BF. Chem Biol. 2004;11:535–546. doi: 10.1016/j.chembiol.2004.03.012. [DOI] [PubMed] [Google Scholar]
- 38.Hyatt JL, Stacy V, Wadkins RM, Yoon KJ, Wierdl M, Edwards CC, Zeller M, Hunter AD, Danks MK, Crundwell G, Potter PM. J Med Chem. 2005;48:5543–5550. doi: 10.1021/jm0504196. [DOI] [PubMed] [Google Scholar]
- 39.Tabata T, Katoh M, Tokudome S, Nakajima M, Yokoi T. Drug Metab Dispos. 2004;32:1103–1110. doi: 10.1124/dmd.104.000554. [DOI] [PubMed] [Google Scholar]
- 40.Ross MK, Crow JA. J Biochem Mol Toxicol. 2007;21:187–196. doi: 10.1002/jbt.20178. [DOI] [PubMed] [Google Scholar]
- 41.Patricelli MP, Giang DK, Stamp LM, Burbaum JJ. Proteomics. 2001;1:1067– 1071. doi: 10.1002/1615-9861(200109)1:9<1067::AID-PROT1067>3.0.CO;2-4. [DOI] [PubMed] [Google Scholar]
- 42.Crow JA, Herring KL, Xie S, Borazjani A, Potter PM, Ross MK. Biochim Biophys Acta. 1801;2010:31–41. doi: 10.1016/j.bbalip.2009.09.002. [DOI] [PMC free article] [PubMed] [Google Scholar]
- 43.Puri P, Baillie RA, Wiest MM, Mirshahi F, Choudhury J, Cheung O, Sargeant C, Contos MJ, Sanyal AJ. Hepatology. 2007;46:1081–1090. doi: 10.1002/hep.21763. [DOI] [PubMed] [Google Scholar]
- 44.Chang JW, Moellering RE, Cravatt BF. Angew Chem Int Ed Engl. 2012;51:966–970. doi: 10.1002/anie.201107236. [DOI] [PMC free article] [PubMed] [Google Scholar]
- 45.Fleming CD, Bencharit S, Edwards CC, Hyatt JL, Tsurkan L, Bai F, Fraga C, Morton CL, Howard-Williams EL, Potter PM, Redinbo MR. J Mol Biol. 2005;352:165–177. doi: 10.1016/j.jmb.2005.07.016. [DOI] [PubMed] [Google Scholar]
- 46.Hatfield MJ, Tsurkan L, Garrett M, Shaver TM, Hyatt JL, Edwards CC, Hicks LD, Potter PM. Biochem Pharmacol. 2011;81:24–31. doi: 10.1016/j.bcp.2010.09.001. [DOI] [PMC free article] [PubMed] [Google Scholar]
- 47.Humerickhouse R, Lohrbach K, Li L, Bosron WF, Dolan ME. Cancer Res. 2000;60:1189–1192. [PubMed] [Google Scholar]
- 48.Zhu HJ, Appel DI, Jiang Y, Markowitz JS. Drug Metab Dispos. 2009;37:1819–1825. doi: 10.1124/dmd.109.028209. [DOI] [PubMed] [Google Scholar]
- 49.Lehner R, Cui Z, Vance DE. Biochem J. 1999;338(Pt 3):761–768. [PMC free article] [PubMed] [Google Scholar]
- 50.Hosokawa M, Endo T, Fujisawa M, Hara S, Iwata N, Sato Y, Satoh T. Drug Metab Dispos. 1995;23:1022–1027. [PubMed] [Google Scholar]
- 51.Jewell C, Bennett P, Mutch E, Ackermann C, Williams FM. Biochem Pharmacol. 2007;74:932–939. doi: 10.1016/j.bcp.2007.06.022. [DOI] [PubMed] [Google Scholar]
- 52.Cravatt BF, Wright AT, Kozarich JW. Annu Rev Biochem. 2008;77:383–414. doi: 10.1146/annurev.biochem.75.101304.124125. [DOI] [PubMed] [Google Scholar]
- 53.Marsh S, Xiao M, Yu J, Ahluwalia R, Minton M, Freimuth RR, Kwok PY, McLeod HL. Genomics. 2004;84:661–668. doi: 10.1016/j.ygeno.2004.07.008. [DOI] [PubMed] [Google Scholar]
- 54.Roth MJ, Forbes AJ, Boyne MT, 2nd, Kim YB, Robinson DE, Kelleher NL. Mol Cell Proteomics. 2005;4:1002–1008. doi: 10.1074/mcp.M500064-MCP200. [DOI] [PMC free article] [PubMed] [Google Scholar]
- 55.Siuti N, Kelleher NL. Nat Methods. 2007;4:817–821. doi: 10.1038/nmeth1097. [DOI] [PMC free article] [PubMed] [Google Scholar]
- 56.Testa B, Mayer JM. Hydrolysis in Drug and Prodrug Metabolism: Chemistry, Biochemistry, and Enzymology. Verlag Chimica Acta; Zurich, Switzerland: 2003. Hydrolysis. [Google Scholar]
- 57.Li B, Sedlacek M, Manoharan I, Boopathy R, Duysen EG, Masson P, Lockridge O. Biochem Pharmacol. 2005;70:1673–1684. doi: 10.1016/j.bcp.2005.09.002. [DOI] [PubMed] [Google Scholar]
- 58.Na K, Lee EY, Lee HJ, Kim KY, Lee H, Jeong SK, Jeong AS, Cho SY, Kim SA, Song SY, Kim KS, Cho SW, Kim H, Paik YK. Proteomics. 2009;9:3989–3999. doi: 10.1002/pmic.200900105. [DOI] [PubMed] [Google Scholar]
- 59.Ross MK, Pegram RA. Toxicol Appl Pharmacol. 2004;195:166–181. doi: 10.1016/j.taap.2003.11.019. [DOI] [PubMed] [Google Scholar]