

Abstract
Background
There is emerging evidence that clinical and neuro-pathological manifestations of Huntington's disease (HD) may occur in individuals with intermediate length cytosine-adenine-guanine (CAG) repeats (27–35 CAG repeats) in the Huntingtin (HTT) gene. We aim to further define the clinical characteristics of individuals who possess CAG repeat lengths in this range.
Methods
Data from the Cooperative Huntington's Observational Research Trial (COHORT) were analyzed. Participants were categorized according to the number of CAG repeats into normal (≤26), intermediate (27–35) and HD (≥36) groups. The motor, cognitive and behavioral scores on the Unified Huntington's Disease Rating Scale (UHDRS) were compared between the intermediate and normal groups.
Results
Of 1985 individuals affected by HD or with a family history of HD who were genotyped, 50 (2.5%) had their larger CAG repeat in the intermediate range. There were statistically significant differences in scores of some motor, cognitive, and behavioral domains of UHDRS at baseline between normal and intermediate length CAG repeats. Furthermore, a significantly greater number of subjects with CAG repeats in the intermediate range reported at least one suicide attempt compared to the normal group.
Discussion
Our findings of motor, cognitive and behavioral abnormalities in individuals with intermediate CAG repeats suggest the presence of subtle, but relevant, disease manifestations in patients with intermediate CAG repeats. These results have important implications for the pathogenesis of the disease and genetic counseling.
Keywords: Huntington disease, trinucleotide repeats, chorea, intermediate repeats, genetic counseling, huntingtin gene
Introduction
Huntington's disease (HD) is a progressive neurodegenerative disease with a variable worldwide occurrence but the prevalence in the United States is estimated at 7–10 in 100,000.1 Inherited in an autosomal dominant manner, HD is caused by an expanded cytosine-adenine-guanine (CAG) repeat length in the Huntingtin (HTT) gene on chromosome 4p16.3, resulting in accumulation of mutant huntingtin protein in the brain. While genetically defined HD requires ≥ 36 CAG repeats, some individuals with a mutable normal allele, or intermediate CAG range (between 27 and 35 repeats), have been reported to exhibit features of HD.2–6 Although most subjects with CAG repeats in this range are normal, intermediate repeats have the potential to expand into the disease range within one generation.7 In this study, we aim to further define the clinical characteristics of patients who possess CAG repeat lengths in the intermediate range as this has implications for understanding of the pathogenesis of the disease and for genetic counseling. We hypothesize that a subset of individuals with intermediate alleles demonstrates subtle clinical manifestations that resemble a mild HD phenotype. The expression of these features may be related to other, currently unidentified, genetic and non-genetic modifying factors.
Methods
Demographic, clinical and genetic data were analyzed, collected from 45 centers in the United States, Canada and Australia that participated in the Cooperative Huntington's Observational Research Trial (COHORT), a prospective observational study examining phenotypic characteristics and genetic factors in individuals from HD families. The COHORT study involved a baseline visit comprising an assessment with the Mini-Mental State Examination (MMSE), a neurological and physical examination, including body mass index (BMI), and the Unified Huntington's Disease Rating Scale 99 (UHDRS 99), conducted by trained study personnel. The UHDRS 99 evaluated four domains, consisting of motor function, cognition, behavior, and functional capacity. The motor assessment comprised 31 items, which included standardized ratings of chorea, dystonia, oculomotor function, as well as a measure of diagnostic confidence, defined as the degree to which the examiner was confident that the subject met the definition of the unequivocal presence of an extrapyramidal movement disorder in a subject at risk for HD. Follow-up visits were conducted yearly, and included the UHDRS 99, MMSE, a brief medical examination including height, weight and vital signs, and any additional information with regard to medical or mental health events. At each visit, subjects were also given the option of participating in a family history questionnaire, and providing specimens for storage in a repository. In order to maintain consistency, the same individual for a particular subject performed the UHDRS from year to year. Approval for COHORT was obtained from the institutional review boards for human research.
Inclusion criteria for enrollment in the COHORT study included a number of categories of subjects. Individuals were eligible to participate if they had been clinically affected by HD or were positive for the HD gene.8 Other subjects included in the COHORT were those who had not undergone genetic testing but were first degree relatives of an individual with manifest or pre-manifest HD, older adolescents who had a parent with manifest HD or pre-manifest HD enrolled in COHORT, or individuals who had not undergone DNA testing but were grandparents or grandchildren of an individual enrolled in COHORT who has manifest HD or pre-manifest HD. Control subjects included spouses or caregivers of an individual enrolled in COHORT with manifest HD or pre-manifest HD. Individuals with a family history of HD who had undergone DNA testing and did not carry the genetic mutation responsible for HD were also included.
All CAG genotyping was performed on coded DNA samples at the DNA Laboratory in the Molecular Neurogenetics Unit, Massachusetts General Hospital. The CAG repeat lengths were determined based on whole blood and lymphocyte analysis, and if both methods did not yield the same result for a particular individual, testing was repeated until the discrepancy was resolved and a common value was obtained. The investigators and subjects did not have access to the results of genotyping. The subjects were assessed yearly, for as many follow-up visits as possible. Raters were blinded to the results of DNA genotyping of the HTT gene. We report here baseline data collected through December 31, 2009.
Study participants were assigned into three primary groups. Subjects with an expanded CAG repeat length of 36 or more were classified positive for HD, those with a CAG repeat of 27–35 were classified as ‘intermediate’, and those with less than 27 repeats were considered ‘normal’. Participant characteristics were compared across the three primary groups using descriptive statistics. Initial analysis compared differences in demographic and clinical metrics for the intermediate versus normal and HD groups. Means were compared using analysis of covariance models adjusted for age and gender, while proportions were compared using Fisher's exact tests.
Further analysis compared individual items from the motor and behavioral sections of the UHDRS.9 These items are scored on a 0–4 point ordinal scale, with 0 representing no impairment and 1–4 representing increasing levels of impairment. For each item, the distribution of scores was compared using a Wilcoxon rank sum test. Comparisons were made between the intermediate and normal groups. All hypothesis testing was conducted at the two-sided significance level of 5%. No corrections were made for multiple testing in this exploratory analysis.
Results
As of December 31, 2009, 2318 participants had enrolled in the COHORT study. Information on CAG repeat length was not available for 333 individuals and they were therefore excluded from the analysis. Of the remaining 1985 subjects, 645 subjects were in the normal range and 50 were in the intermediate range. Baseline characteristics were assessed in the 1985 research participants (Table 1). There were significantly more females in the intermediate group than either the normal or the HD group. The level of education did not differ between intermediate and HD subjects, but the proportion employed and married were both significantly lower in HD subjects. Baseline body mass index (BMI) was not significantly different between the normal and intermediate group. Of note, a significantly greater proportion of subjects in the intermediate group reported at least one suicide attempt compared to the normal group.
Table 1.
Demographic and UHDRS Data
| Normal (N) | Intermediate (I) | p-value1 | Huntington's Disease (HD) | p-value1 | |
| (n = 645) | (n = 50) | (N vs. I) | (n = 1290) | (HD vs. I) | |
| Age [years] | 50.31 (13.29) | 49.08 (13.13) | 0.5828 | 48.80 (13.11) | 0.8021 |
| Female [%] | 373 (57.8) | 37 (74.0) | 0.0256 | 708 (54.9) | 0.0085 |
| White [%] | 602 (93.2) | 48 (96.0) | 0.7652 | 1206 (93.5) | 0.7667 |
| Employment status [% currently in labor force] | 444 (68.8) | 36 (72.0) | 0.7513 | 429 (31.6) | <0.0001 |
| Marital status [% currently married] | 505 (78.3) | 40 (80.0) | 0.8600 | 777 (60.2) | 0.0047 |
| History of at least one suicide attempt [%] | |||||
| – Overall | 9 (1.4) | 3 (6.0) | 0.0486 | 82 (6.4) | 1.0000 |
| – Females | 7 (1.9) | 3 (8.1) | 0.0522 | 48 (6.8) | 0.7346 |
| – Males | 2 (0.7) | 0 (0) | 1.0000 | 34 (5.8) | 1.0000 |
| Body mass index [kg/m2] | |||||
| – Overall | 28.63 (6.47) | 28.67 (7.00) | 0.8787 | 25.69 (5.42) | 0.0003 |
| – Females | 28.28 (6.76) | 28.91 (7.76) | 0.5416 | 25.55 (6.07) | 0.0008 |
| – Males | 29.09 (6.03) | 28.01 (4.45) | 0.5391 | 25.87 (4.50) | 0.1823 |
| Motor assessment | |||||
| Total UHDRS motor assessment [0–124] | 1.72 (2.91) | 2.16 (3.14) | 0.2581 | 30.11 (21.96) | <0.0001 |
| Total maximal chorea score [0–28] | 0.08 (0.41) | 0.16 (0.59) | 0.2245 | 7.72 (5.99) | <0.0001 |
| Total maximal dystonia score [0–20] | |||||
| – Overall | 0.01 (0.14) | 0.10 (0.42) | 0.0014 | 2.64 (3.60) | <0.0001 |
| – Females | 0.02 (0.18) | 0.14 (0.49) | 0.0001 | 2.56 (3.64) | <0.0001 |
| – Males | 0.004 (0.06) | 0 (0) | 0.9178 | 2.74 (3.56) | 0.0103 |
| Behavioral assessment | |||||
| UHDRS Behavioral frequency [0–44] | 4.39 (4.33) | 5.06 (4.48) | 6.94 (6.25) | ||
| UHDRS Behavioral frequency x severity [0–176] | 6.27 (9.12) | 8.28 (10.87) | 0.1945 | 13.51 (15.87) | 0.0186 |
| Cognitive assessment | |||||
| Mini Mental State Examination [0–30] | 29.12 (1.51) | 28.96 (1.56) | 0.3783 | 26.01 (4.30) | <0.0001 |
| UHDRS Verbal fluency | 40.25 (11.84) | 38.44 (11.51) | 0.1612 | 26.43 (14.88) | <0.0001 |
| UHDRS Symbol digit modalities test | 47.35 (10.91) | 45.65 (9.79) | 0.0734 | 30.11 (15.28) | <0.0001 |
| UHDRS Stroop color naming | 74.60 (15.32) | 72.27 (12.58) | 0.1264 | 52.05 (20.86) | <0.0001 |
| UHDRS Stroop word reading | |||||
| – Overall | 95.70 (18.36) | 89.96 (16.67) | 0.0187 | 67.39 (26.10) | <0.0001 |
| – Females | 96.90 (18.87) | 88.19 (17.42) | 0.0068 | 69.67 (26.00) | <0.0001 |
| – Males | 94.05 (17.53) | 95.25 (13.46) | 0.9647 | 64.66 (25.97) | 0.0001 |
| UHDRS Stroop interference | 43.40 (13.35) | 41.79 (11.59) | 0.2201 | 30.43 (14.74) | <0.0001 |
| UHDRS Independence assessment | 99.83 (1.38) | 99.49 (1.84) | 0.0942 | 84.31 (16.47) | <0.0001 |
| UHDRS Functional assessment | 24.89 (1.05) | 24.94 (0.32) | 0.7427 | 20.31 (5.80) | <0.0001 |
| UHDRS Total functional capacity | 12.85 (0.76) | 12.84 (0.59) | 0.9021 | 9.31 (3.55) | <0.0001 |
| Eye Movement Score [median (range)] | p-value2 (N vs I) | p-value3 (N vs I) | |||
| Ocular Pursuit – Horizontal | 0 (0–3) | 0 (0–1) | 0.9820 | 1 (0–4) | <0.0001 |
| Ocular Pursuit – Vertical | 0 (0–3) | 0 (0–1) | 0.9327 | 1 (0–4) | <0.0001 |
| Saccade Initiation – Horizontal | 0 (0–2) | 0 (0–2) | 0.1143 | 1 (0–4) | <0.0001 |
| Saccade Initiation – Vertical | 0 (0–2) | 0 (0–1) | 0.1788 | 1 (0–4) | <0.0001 |
| Saccade Velocity – Horizontal | 0 (0–1) | 0 (0–1) | 0.1096 | 1 (0–4) | <0.0001 |
| Saccade Velocity – Vertical | 0 (0–4) | 0 (0–1) | 0.0454 | 1 (0–4) | <0.0001 |
Abbreviations: N, Normal; I, Intermediate; HD, Huntington disease; n, sample size; UHDRS, Unified Huntington's Disease Rating Scale.
UHDRS scores are listed as mean (standard deviation) unless otherwise noted.
Two-sided p-values for comparing means based on Analysis of covariance (ANCOVA) model adjusted for age and gender; proportions compared using two-sided Fisher's exact test.
Based on two-sided Wilcoxon test for comparing median score for Normals vs. Intermediates.
Based on two-sided Wilcoxon test for comparing median score for Intermediates vs. HD.
In the motor component of the UHDRS, the intermediate group had a significantly higher Total Maximal Dystonia Score (mean 0.01 vs 0.10, p = 0.001) compared with the control group. In addition, compared with the normal group, there was a significantly lower proportion of subjects in the intermediate group with normal scores in the following categories: Vertical Saccade Velocity (89.8% vs 96.0%, p = 0.05), Maximal Dystonia RUE (95.9% vs 99.5%, p = 0.004), and Maximal Chorea LLE (95.9% vs 99.2%, p = 0.03). The items that were significantly different are presented in Figure 1. Scores on the Stroop Word Reading were lower in the intermediate group compared with the normal group (mean 90.0 vs 95.7, p = 0.02). In the behavioral domain, a lower proportion of subjects in the intermediate group received normal scores in Depressed Mood – Severity (48.0% vs 61.8%, p = 0.02) and Suicidal Thoughts – Severity (96.0% vs 99.4%, p = 0.01). There was a trend toward fewer intermediate subjects scoring normally on Suicidal Thoughts – Frequency (96.0% vs 99.1%, p = 0.05).

Difference in Various UHDRS Items between Subjects with Normal (<27) and Intermediate (27–35) CAG Repeats (0 = Normal; 1–4 Represents Increasing Levels of Impairment). *p<0.05, **p<0.01, RUE = right upper extremity, LLE = left lower extremity
The UHDRS diagnostic confidence levels for each group are shown in Figure 2. No differences in diagnostic confidence were detected between the normal group and the intermediate (p = 0.86) group, although there was a slightly higher proportion of subjects with confidence category of 2 and 4 in the intermediate group compared to normal controls.
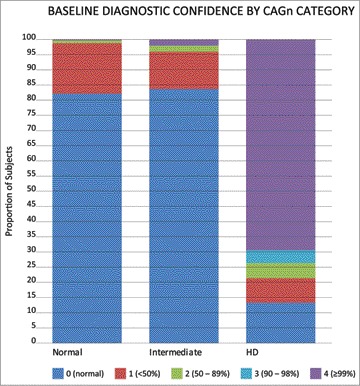
Diagnostic Confidence at Baseline between the Normal, Intermediate, ‘High-Intermediate’ and HD Groups
Discussion
HD presents with motor dysfunction as well as disturbances in cognitive and behavioral domains. Historically, this disease has been associated with stigma affecting not only patients with HD, but also those who are at risk for developing HD.10 In recent years, several cases have been reported in the literature, suggestive of clinical manifestations of HD in individuals with intermediate CAG repeats, in whom likely phenocopy syndromes have been excluded.11,12 This observation, if confirmed, would have important implications for genetic counseling.
In our analysis of the COHORT data, we found statistically significant differences in some UHDRS scores between the normal and intermediate group. These abnormalities tended to occur in some, but not all, subjects with intermediate repeats. The findings draw attention to the possibility of subtle motor, cognitive and behavioral abnormalities in some subjects with intermediate CAG repeats, but the differences that were identified in the motor scores would not likely be clinically meaningful. Of potentially greater clinical significance was that of the behavioral findings, including the history of suicide attempts, which was comparable between the intermediate, and HD groups. Whether this finding reflects an inherent abnormality in subjects with intermediate CAG repeats, or a tendency that is potentiated by the familial context, is unclear. Regardless, this finding raises an area of interest for further studies, with possible relevance for clinical management and intervention. The abnormal findings raise the possibility of whether an intermediate length allele is indeed sufficient to cause pathology, in a particular genetic and environmental milieu. Thus, although relatively subtle, these abnormalities appear to be important and relevant, particularly when they occur in the setting of a family history of HD.
In this study population, the frequency of intermediate alleles was 2.5%, which is in the frequency range (up to 6%) reported in control populations.13 Our figures do not include individuals whose larger allele may have been in the HD range, as these were excluded from the analysis. Hendricks et al. have estimated that the probability that a male who is a ‘high normal’ carrier will have a risk of an offspring with an expanded, penetrant, allele ranges from 1/6241 to 1/951.14 These low estimates, however, have been derived from prevalence studies of high normal alleles in the general population using a sample of primarily Parkinson's disease cases. Our results should be interpreted with caution, particularly when comparing to the general population. Data from this study were collected from subjects with signs or symptoms suggestive of HD, or from family members, and should not be applied to an otherwise healthy individual with similarly sized alleles. An intermediate allele in a family with sporadic HD appears to be less stable than those present in the general population.15
We acknowledge that there are a number of limitations to this study. The differences that we identified between the normal and intermediate groups may have occurred by chance as a result of inter-rater variability, particularly if the distinction between normal and mild impairment was based on the presence of subtle signs.
Although the UHDRS has a high rate of internal consistency within each of the domains,9 and is considered the ‘gold standard’ in HD clinical trials,16,17 the scale was originally designed for manifest individuals, and therefore may not be as sensitive in early or mild disease.18 The application of the UHDRS in the assessment of the normal population is not well defined. Indeed, although we found that a lower proportion of intermediate subjects scored normally on vertical saccade velocity, we also note that the normal group included outliers with very high scores, up to 4, which were not present in the intermediate group (Table 1).
Given that the analysis was conducted in an exploratory nature, adjustments for multiple comparisons were not applied. We do acknowledge however that the presence of numerous data sets may raise the possibility of a Type I error. A Bonferroni correction on all 84 hypothesis tests, consisting of 31 motor items, 25 behavioral items, and 28 demographic items, would establish a p-value of less than 0.0006 for statistical significance. The significant findings in our study, however, were all suggestive of abnormality in the intermediate group rather than the normal group, and as such, the possibility of all of these findings occurring by chance due to inter-rater variability in a blinded setting would seem less likely.
We note that several relevant items such as mean diagnostic confidence did not demonstrate significant differences, and we postulate that this is related to the averaging effect in assessing mean scores, in a population where only a minority of subjects appear to be affected. Low BMI, which is described in prodromal individuals, was also not found in our intermediate population. Whether the spectrum of the intermediate phenotype has a tendency to overlap with gene-expanded individuals in only certain areas is unclear. Weight loss in HD has been shown to correlate directly with the CAG repeat length.19 The eye movement abnormality identified in the intermediate group consisted only of vertical saccade velocity, and no differences were seen in ocular pursuit or saccadic initiation. Disturbances in eye motor control appear to be associated with the degree of clinical severity,20 and this would be in keeping with the mild phenotype of the intermediate group. Although further analysis stratified to gender suggested that the total maximum dystonia score and UHDRS Stroop Word Reading were due to the female intermediate subjects (Table 1), the small numbers limit meaningful conclusions, and larger studies are required.
Another limitation of our analysis is the lack of robust follow-up data. Without the benefit of longitudinal assessment, disease onset may potentially be missed, thus under-estimating the prevalence of abnormal phenotypes. The relatively small number of subjects with intermediate CAG repeats who attended follow-up visits does not allow for meaningful interpretation of this component of data at this time. Variations in age may have influenced the onset of disease. In this study, however, we found no significant differences in age between the normal, intermediate, and HD groups. In addition, our comparison of means using analysis of covariance models was adjusted for age.
The possibility of HD phenocopies must also be considered in an individual with signs or symptoms suggestive of HD. Although screening for HD phenocopies would have been valuable, in a study population consisting of HD individuals and their family members, it is unclear to what extent the possibility of HD phenocopies would have accounted for the results. The possibility of laboratory error should also be considered, particularly when interpreting alleles bordering on different penetrance classes. In this study, all CAG genotyping was performed in a single laboratory with considerable experience, on both whole blood and lymphocytes. Despite these limitations, we believe that the abnormal findings in the intermediate group are potential areas of interest that warrant further evaluation. Additional studies with larger sample sizes, follow-up assessments, and family data would be valuable in further defining this population of subjects. In conclusion, our exploratory analysis of the COHORT database revealed statistically significant differences in many UHDRS scores between normal and intermediate length CAG. Although not proven, these findings support the concept that clinically manifest disease may occur in individuals with intermediate CAG repeats.
Acknowledgments
We are grateful to the Huntington Study Group for providing the COHORT database.
We would like to thank Dr Ray Dorsey, Johns Hopkins University, Baltimore, for his helpful comments and Dr Ira Shoulson, Georgetown University, Washington, DC, for his support. We also thank Anthony Davidson, Baylor College of Medicine, Houston, for his assistance with data analysis.
Footnotes
Funding: None.
Competing Interests: The authors report no conflict of interest.
References
- 1.Ross CA, Tabrizi SJ. Huntington's disease: from molecular pathogenesis to clinical treatment. Lancet Neurol. 2011;10:83–98. doi: 10.1016/S1474-4422(10)70245-3. [DOI] [PubMed] [Google Scholar]
- 2.Herishanu YO, Parvari R, Pollack Y, et al. Huntington disease in subjects from an Israeli Karaite community carrying alleles of intermediate and expanded CAG repeats in the HTT gene: Huntington disease or phenocopy? J Neurol Sci. 2009;277:143–146. doi: 10.1016/j.jns.2008.11.005. [DOI] [PubMed] [Google Scholar]
- 3.Groen JL, de Bie RM, Foncke EM, et al. Late-onset Huntington disease with intermediate CAG repeats: true or false? J Neurol Neurosurg Psychiatry. 2010;81:228–230. doi: 10.1136/jnnp.2008.170902. [DOI] [PubMed] [Google Scholar]
- 4.Andrich J, Arning L, Wieczorek S, et al. Huntington's disease as caused by 34 CAG repeats. Mov Disord. 2008;23:879–881. doi: 10.1002/mds.21958. [DOI] [PubMed] [Google Scholar]
- 5.Kenney C, Powell S, Jankovic J. Autopsy-proven Huntington's disease with 29 trinucleotide repeats. Mov Disord. 2007;22:127–130. doi: 10.1002/mds.21195. [DOI] [PubMed] [Google Scholar]
- 6.Biglan K, Jankovic J, Eberly S, et al. Longitudinal analysis of intermediate CAGn repeat length expansion in the Prospective Huntington Disease At-Risk Observational Study (PHAROS). Mov Disord. 2010;(Suppl 2):S270. [Google Scholar]
- 7.Semaka A, Creighton S, Warby S, et al. Predictive testing for Huntington disease: interpretation and significance of intermediate alleles. Clin Genet. 2006;70:283–294. doi: 10.1111/j.1399-0004.2006.00668.x. [DOI] [PubMed] [Google Scholar]
- 8.Cooperative Huntington's Observational Research Trial. www.clinicaltrials.gov (accessed September 18, 2010). [Google Scholar]
- 9.Unified Huntington's Disease Rating Scale: reliability and consistency. Huntington Study Group. Mov Disord. 1996;11:136–142. doi: 10.1002/mds.870110204. [DOI] [PubMed] [Google Scholar]
- 10.Rawlins M. Huntington's disease out of the closet? Lancet. 2010;376(9750):1372–1373. doi: 10.1016/S0140-6736(10)60974-9. [DOI] [PubMed] [Google Scholar]
- 11.Ha AD, Jankovic J. Exploring the correlates of intermediate CAG repeats in Huntington disease. Postgrad Med. 2011;123:116–121. doi: 10.3810/pgm.2011.09.2466. [DOI] [PubMed] [Google Scholar]
- 12.Squitieri F, Esmaeilzadeh M, Ciarmiello A, et al. Caudate glucose hypometabolism in a subject carrying an unstable allele of intermediate CAG(33) repeat length in the Huntington's disease gene. Mov Disord. 2011;26:925–927. doi: 10.1002/mds.23623. [DOI] [PubMed] [Google Scholar]
- 13.Sequeiros J, Ramos EM, Cerqueira J, et al. Large normal and reduced penetrance alleles in Huntington disease: instability in families and frequency at the laboratory, at the clinic and in the population. Clin Genet. 2010;78:381–387. doi: 10.1111/j.1399-0004.2010.01388.x. [DOI] [PubMed] [Google Scholar]
- 14.Hendricks AE, Latourelle JC, Lunetta KL, et al. Estimating the probability of de novo HD cases from transmissions of expanded penetrant CAG alleles in the Huntington disease gene from male carriers of high normal alleles (27–35 CAG). Am J Med Genet A. 2009;149A:1375–1381. doi: 10.1002/ajmg.a.32901. [DOI] [PMC free article] [PubMed] [Google Scholar]
- 15.Goldberg YP, McMurray CT, Zeisler J, et al. Increased instability of intermediate alleles in families with sporadic Huntington disease compared to similar sized intermediate alleles in the general population. Hum Mol Genet. 1995;4:1911–1918. doi: 10.1093/hmg/4.10.1911. [DOI] [PubMed] [Google Scholar]
- 16.Curtis A, Mitchell I, Patel S, et al. A pilot study using nabilone for symptomatic treatment in Huntington's disease. Mov Disord. 2009;24:2254–2259. doi: 10.1002/mds.22809. [DOI] [PubMed] [Google Scholar]
- 17.Kieburtz K, McDermott MP, Voss TS, et al. A randomized, placebo-controlled trial of latrepirdine in Huntington disease. Arch Neurol. 2010;67:154–160. doi: 10.1001/archneurol.2009.334. [DOI] [PMC free article] [PubMed] [Google Scholar]
- 18.Vaccarino AL, Anderson K, Borowsky B, et al. An item response analysis of the motor and behavioral subscales of the unified Huntington's disease rating scale in huntington disease gene expansion carriers. Mov Disord. 2011;26:877–884. doi: 10.1002/mds.23574. [DOI] [PMC free article] [PubMed] [Google Scholar]
- 19.Aziz NA, van der Burg JM, Landwehrmeyer GB, et al. Weight loss in Huntington disease increases with higher CAG repeat number. Neurology. 2008;71:1506–1513. doi: 10.1212/01.wnl.0000334276.09729.0e. [DOI] [PubMed] [Google Scholar]
- 20.Patel S, Jankovic J, Hood A, et al. Reflexive and volitional saccades: Biomarkers of Huntington disease severity and progression. J Neurol Sci. 2012 Feb 15;313(1-2):35–41. doi: 10.1016/j.jns.2011.09.035. [DOI] [PMC free article] [PubMed] [Google Scholar]