

Abstract
Background and Purpose
Multiple antibiotic resistant strains of plague are emerging, driving a need for the development of novel antibiotics effective against Yersinia pestis. DNA adenine methylation regulates numerous fundamental processes in bacteria and alteration of DNA adenine methlytransferase (Dam) expression is attenuating for several pathogens, including Y. pestis. The lack of a functionally similar enzyme in humans makes Dam a suitable target for development of novel therapeutics for plague.
Experimental Approach
Compounds were evaluated for their ability to inhibit Dam activity in a high-throughput screening assay. DNA was isolated from Yersinia grown in the presence of lead compounds and restricted to determine the effect of inhibitors on DNA methylation. Transcriptional analysis was undertaken to determine the effect of an active inhibitor on virulence-associated phenotypes.
Key Results
We have identified a series of aryl stibonic acids which inhibit Dam in vitro. The most active, 4-stibonobenzenesulfonic acid, exhibited a competitive mode of inhibition with respect to DNA and a Ki of 6.46 nM. One compound was found to inhibit DNA methylation in cultured Y. pestis. The effects of this inhibition on the physiology of the cell were widespread, and included altered expression of known virulence traits, including iron acquisition and Type III secretion.
Conclusions and Implications
We have identified a novel class of potent Dam inhibitors. Treatment of bacterial cell cultures with these inhibitors resulted in a decrease in DNA methylation. Expression of virulence factors was affected, suggesting these inhibitors may attenuate bacterial infectivity and function as antibiotics.
Keywords: DNA adenine methylation, Yersinia, type III secretion, siderophore, stibonic acid
Introduction
The DNA adenine methyltransferase (Dam) of γ-proteobacteria catalyzes the methylation of adenine residues in GATC motifs (see Geier and Modrich, 1979). As DNA is replicated, hemi-methylated DNA is generated at the replication fork due to synthesis of unmethylated daughter strands in complement to methylated parent strands. Dam trails the replication fork at a short distance, so the hemi-methylated state is transient before full methylation prevails (see Wion and Casadesús, 2006). This interval allows methylation-sensitive regulatory proteins to moderate their binding to the hemi-methylated DNA, achieving diverse and global regulatory effects. In some cases, binding of proteins to the hemi-methylated GATC sites inhibits methylation, giving rise to stably inherited hemi- or non-methylated regions. As the low methylation patterns are maintained after chromosome replication, they can be transmitted to progeny to influence processes following cell division (Casadesús and Low, 2006; Low and Casadesús, 2008).
Both inactivation and over-expression of Dam have a significant impact on bacterial processes, some of which, such as mismatch repair and the timing of chromosomal replication, are fundamental to the survival of the organism. Dam methylation has also been found to affect the expression of virulence factors, including the correct secretion and translocation of type III effector proteins by Salmonella enterica, Yersinia pseudotuberculosis and Aeromonas hydrophila (Julio et al., 2002; Badie et al., 2004; Balbontín et al., 2006; Erova et al., 2006; Giacomodonato et al., 2009); phase variation of the Pap pili (see Braaten et al., 1992) and the Agn43 surface protein (Haagmans and van der Woude, 2000) of Escherichia coli; and phase variation of the fimbriae and LPS of S. enterica (see Broadbent et al., 2010). The mechanisms underlying these observations are being elucidated, with the oxidative stress response regulator, OxyR, having a key role in LPS and Agn43 phase variation (Haagmans and van der Woude, 2000; Broadbent et al., 2010), and Lrp regulating Pap expression (Braaten et al., 1992).
Considering the widespread and diverse effects of aberrant Dam expression, it is not surprising that pathogens either lacking or over-expressing Dam are attenuated (Garcia-del Portillo et al., 1999; Heithoff et al., 1999; Julio et al., 2001; Chen et al., 2003; Watson et al., 2004; Taylor et al., 2005; Erova et al., 2006; Robinson et al., 2005). Dam-defective mutants have been proposed as potential live-attenuated vaccines, and dam mutants of S. enterica serovar Typhimurium have been shown to protect chickens and calves against homologous challenges (Dueger et al., 2001; 2003). However, the effect of inactivation of Dam in S. enterica serovar Enteritidis resulted in truncated LPS expression, and as such, the strain induced only limited protection (Sarnacki et al., 2009). Therefore, despite being an attenuating target, the pleiotropic effects on the bacterium make protection harder to predict. The dam mutants of Y. pseudotuberculosis and Yersinia pestis were attenuated and induced a protective immune response (Taylor et al., 2005; Robinson et al., 2005). However, the LPS of a Dam-overproducing strain of Yersinia enterocolitica was shown to contain high levels of rough LPS, and as such, this strain may not induce effective protection (Fälker et al., 2007).
Pathogenic Yersinia species are a significant cause of human morbidity and mortality in the world. Of these, Y. pestis is the most virulent, being the aetiologic agent of bubonic and pneumonic plague. Approximately 2000 cases of plague are notified to the World Health Organization annually (Dennis et al., 1999). Treatment is normally via a wide spectrum antibiotic such as the aminoglycosides gentamicin and doxycycline or quinolones (Prentice, 2010), with prompt initiation of therapeutic regimens essential, particularly for the highly acute pneumonic form of disease.
The inexorable rise of antibiotic resistance has rendered many clinically prescribed therapeutic agents ineffective. Unfortunately, this is also true for treatment of plague, as multi-drug-resistant Y. pestis strains have been isolated from naturally arising human infections (Galimand et al., 1997; Guiyoule et al., 2001). The severity of the disease caused by Y. pestis, its ability to be transmitted in aerosols to cause pneumonic plague and the high associated mortality have meant that the pathogen has attracted attention from the unscrupulous wishing to develop biological weapons (Inglesby et al., 2000). Thus, in addition to naturally arising resistance, there is a need for effective novel antimicrobials in the event of a strain that has been selected or engineered for resistance. Due to the consistently attenuating nature of inactivating Dam expression, it has been proposed as a target for novel antimicrobials (Mashhoon et al., 2004).
Previously, we reported the construction of isogenic mutants defective for Dam in Y. pestis and its close relative the enteropathogen Y. pseudotuberculosis (Taylor et al., 2005; Robinson et al., 2005). Both these mutants were attenuated in mouse infection models. In order to facilitate the development of Dam-specific inhibitors, we developed a continuous fluorescence-based assay for monitoring Dam activity that is suitable for the high-throughput screening (HTS) of potential Dam inhibitors (Wood et al., 2007). In this current study, we describe the screening of an inhibitor library and identification of compounds with specific activity against Dam in this assay, providing a lead for the development of antimicrobials against this target. We also report the effects of inhibiting Dam methylation on transcriptional profiles of Y. pestis to understand why the mutation is attenuating and how an inhibitor may influence the physiology of the bacterium.
Methods
Dam activity assay
Recombinant DpnI, E. coli Dam and Y. pestis Dam were expressed and purified as described in Supplementary Section S1. The break light oligonucleotide used in the assay (ATDBio, Southampton, UK) was: oligonucleotide 1 5′-(F)CCGGAmTCCAGTTTTCTGGATCCGG(D)-3′ [Dam recognition sequence in bold, (F) represents fluorescein, (D) represents a dabcyl quencher and Am represents N6-methyladenine]. Activity assays were prepared using a Beckman Coulter (High Wycombe, UK) Biomek 3000 liquid handling system. Fluorescence measurements were recorded in a Tecan SafireII (Reading, UK) microplate reader using 10 readings per well (each measurement) a Z-position of 12 000 μM and an integration time of 20 μs. Fluorescence measurements were made using an excitation wavelength of 486 nM with a bandwidth of 5 nM, and an emission wavelength of 518 nM with a bandwidth of 10 nM and the gain was set at 170, unless otherwise stated. Calibration plots were prepared as described previously (Wood et al., 2007) and in Supplementary Section S2 to enable conversion of rate of change in fluorescence to change of rate of reaction (Supplementary Table S1 and Figure S1). The activity of Y. pestis Dam was measured in triplicate (unless otherwise stated) in black, flat bottomed, 384 Well Small Volume™ HiBase polystyrene microplates (Greiner, Stonehouse, UK), with a total assay volume of 20 μL, maintained at 30°C. Assays containing buffer E (20 mM Tris, pH 7.9; 80 mM NaCl, 8 mM MgCl2, 1 mM DTT, 0.1 mg mL−1 BSA, 5% glycerol) supplemented with 0–200 μM AdoMet hydrochloride (Sigma-Aldrich, Poole, UK) and 0–30 nM oligonucleotide 1 were equilibrated in a Tecan SafireII (10 min, 30°C). Before initiation with 1 or 0.3 nM Y. pestis Dam and 2 nM DpnI in buffer E at 4°C, an average background fluorescence (over 5 reads) was measured and this background was subtracted from all final assay data. Fluorescein emission was then monitored over 2000–3000 s. The program Matlab (MathWorks, Cambridge, UK) was used to determine the maximum rate of fluorescence change by taking a moving average over 5 data points and differentiating to find the maximum gradient (corresponding to the maximum rate), unless otherwise stated. Background changes in fluorescence were accounted for by subtracting a negative control (lacking AdoMet) when appropriate. Further data analysis was carried out using the software package SigmaPlot 11 (Systat Inc., San Jose, CA, USA).
HTS
A total of 3082 compounds from the National Cancer Institute Developmental Therapeutics Program (NCI/DTP) open access library and the arylstibonic acid sub-library (39 compounds) were dissolved in 100% DMSO to a concentration of 500 μM. The phosphonic acid sub-library (41 compounds) was dissolved in 25 mM ammonium carbonate to a concentration of 500 μM. Libraries were screened in a 384-well format using the Dam activity assay. Assays were prepared in sets of 96 in buffer E supplemented with 25 μM AdoMet hydrochloride, 10 nM oligonucleotide 1 and 25 μM library compound, and initiated with 1 nM Y. pestis Dam and 2 nM DpnI in buffer E at 4°C. Each library compound was screened in duplicate in two separate sets of assays for the DTP library and in the same set of assays for sub-library screens. Four positive (lacking library compound, but supplemented with DMSO or ammonium carbonate) and four negative control assays (lacking library compound and AdoMet, but supplemented with DMSO or ammonium carbonate) were prepared on either side of the plate, giving 16 control assays in total. Rates of reaction were calculated between 220 and 540 s (over 10 data points, allowing for initiation of all 96 assays). The Z-factor for each assay set (80 compounds and 16 controls) was calculated [Supplementary Information, equation (1) and assay sets with a Z-factor of less than 0.5 were repeated]. Relative percentage inhibition was calculated [Supplementary Information, equation (2)] and hits were classified as those compounds falling outside 3 SDs from the average of the positive control.
Counter-screening
Compounds identified as inhibitors in the high-throughput Dam screen were counter-screened for DpnI inhibition in a 384-well format using a modified version of the Dam activity assay. The break light oligonucleotide used in the assay (ATDBio) was oligonucleotide 2 5′-(F)CCGGAmTCCAGTTTTCTGGAmTCCGG(D)-3′ [DpnI recognition sequence in bold, (F) represents fluorescein, (D) represents a dabcyl quencher and Am represents N6-methyladenine]. Assays were prepared in sets of 96 in buffer E supplemented with 10 nM oligonucleotide 2 and 25 μM library compound, and initiated by the addition of 12.5 pM DpnI in buffer E at 4°C. Each library compound was screened in triplicate. Rates of reaction were calculated between 400 and 730 s (over 10 data points, allowing for initiation of all 96 assays and a slight lag-phase) and relative percentage inhibition was calculated using equation 2.
Fluorescence intercalation displacement assay
Assays for DNA intercalation were prepared using the substrate oligonucleotide (ATDBio) 3: 5′-CCGGATCCAGTTTTCTGGATCCGG-3′ (Dam recognition sequence in bold) using a Beckman Coulter Biomek 3000 liquid handling system. Fluorescence measurements were recorded in a Tecan SafireII microplate reader using 10 readings per well (each measurement), a Z-position of 12 000 μM and an integration time of 20 μs. Fluorescence measurements were made using an excitation wavelength of 504 nM with a bandwidth of 5 nM and an emission wavelength of 527 nM with a bandwidth of 5 nM, the gain was set at 255. Displacement was measured in triplicate in black, flat bottomed, 384 Well Small Volume™ HiBase polystyrene microplates, with a total assay volume of 20 μL, maintained at 25°C. Assays containing buffer F (100 mM Tris, pH 7.9; 100 mM NaCl) supplemented with 100 nM oligonucleotide 3, 500 nM thiazole orange and 5% DMSO were equilibrated in a Tecan SafireII for 5 min at 25°C. 0–1000 μM library compound and DMSO (5%) were then added and the plate was equilibrated for 30 min at 25°C. An average of 10 end-point fluorescence readings were then taken and percentage fluorescence decrease was calculated relative to an average of three positive controls (lacking library compound) (Supplementary Information, equation 3).
IC50 measurements
Y. pestis Dam activity was measured using the Dam activity assay as described, with substrate concentrations at the Km for the enzyme (determined as described in Supplementary Section S3). Assays were supplemented with 3 nM oligonucleotide 1, 16 μM AdoMet hydrochloride, 0–100 or 0–1000 μM library compound (7 concentrations, 0.1 × dilution series) and 5% DMSO and initiated with 0.3 nM Y. pestis Dam and 2 nM DpnI in triplicate. The fluorometer gain was set to 190. The rate of fluorescence change was calculated and converted to rate of reaction as described and fractional activity was calculated (Supplementary Information, equation 4) and IC50 values were calculated (Supplementary Information, equation 5).
Ki determinations
Dam activity assays were prepared as described and supplemented with 0–4 × [IC50] compound (4 concentrations, 0.6 × dilution series), 5% DMSO, 160 μM AdoMet hydrochloride and 3.1–12 nM oligonucleotide 1, or 5.4–70 μM AdoMet hydrochloride and 10 nM oligonucleotide 1. Each set of conditions was prepared in duplicate and initiated with 0.3 nM Y. pestis Dam for variable DNA or 1 nM Y. pestis Dam for variable AdoMet and 2 nM DpnI. The rate of fluorescence change was converted to rate of reaction as described, enabling mode of inhibition to be determined for the varied substrate (Supplementary Section 3). Replots of the gradient (Km/Vmax) and y-axis intercept (1/Vmax) against inhibitor concentration allowed the determination of Ki and αKi, respectively, from the x-axis intercept.
Fluorescence anisotropy competition binding assays
Fluorescently labelled oligonucleotide used in the assay (ATDBio) was oligonucleotide 4 5′-(F)CCGGAmTCCAGTTTTCTGGATCCGG-3′ [Dam recognition sequence in bold, (F) represents fluorescein and Am represents N6-methyladenine]. Fluorescence anisotropy measurements were recorded in a BMG (Aylesbury, UK) Polarstar Omega microplate reader using 10 readings per well (each measurement) and an integration time of 20 μs. Fluorescence measurements were made using an excitation wavelength of 490 nM with a bandwidth of 10 nM and an emission wavelength of 520 nM with a bandwidth of 10 nM, the gain was set at 2315 for emission channel A and 2366 for emission channel B (G factor = 0.978). Fluorescence anisotropy was measured in triplicate in black, flat bottomed, 96-well half area polystyrene microplates (Greiner), with a total assay volume of 100 μL maintained at 25°C. Assays contained buffer E supplemented with 0.1% Tween, 20 nM oligonucleotide 4, 0 or 100 μM S-adenosylhomocysteine (AdoHcy) (Sigma-Aldrich), 0–1000 μM compound (seven concentrations, 10-fold dilution series) and 5% DMSO and were equilibrated in a BMG Polarstar Omega for 10 min at 25°C. Finally, 200 nM E. coli Dam in buffer E at 4°C was added and the parallel and perpendicular fluorescence emissions were measured and used to calculate fluorescence anisotropy (Supplementary Information, equation 7a). Control assays lacking Dam were used to calculate the fluorescence anisotropy of free oligonucleotide 4 and control assays lacking both Dam and oligonucleotide 4 were used to calculate background fluorescence. The fraction of substrate bound was then calculated (Supplementary Information, equation 7b) (Roehrl et al., 2004).
Binding assays in which the concentration of E. coli Dam was varied were used to calculate the binding constant (Kd) of oligonucleotide 4 for E. coli Dam in the absence and presence of AdoHcy (see Supplementary Figure S4). These constants were then used to determine the competition binding constant (Kdi) for the library compound directly via the method of Roehrl et al. (2004) or indirectly by the method of Kenakin (1987) (see Supplementary Section S4).
Minimum inhibitory concentration evaluation
The effect of stibonic acid Dam inhibitors on growth of Y. pseudotuberculosis was evaluated using a standard serial dilution approach according to Clinical Laboratory and Standards Institute guidelines, based on the published method of Andrews (2001). Two strains, YPIII and IP32953, were selected and cultured in Luria Bertani (LB) broth at 28°C with agitation. Inhibitor solutions were prepared at 2 mg mL−1 with 2.5% DMSO in water and stored at 4°C. Inhibitors were twofold serially diluted in broth across a microtitre tray, with the highest concentration of 256 μg mL−1. Controls without inhibitor were included, as were controls with 2.5% DMSO, also doubly diluted, to ensure that the solvent did not affect growth. Each well was inoculated with 108 cfu of bacteria and plates incubated at 28°C overnight with agitation (180 rpm). Optical density was determined at 590 nM (OD590).
Determination of the methylation status of DNA
Y. pestis GB, a biovar Orientalis clinical isolate, was grown on blood agar base (BAB) agar supplemented with haemin, at 28°C for 2 days, under ACDP 3 containment conditions. Colonies were used to inoculate BAB broth, which was incubated overnight at 28°C. Y. pseudotuberculosis was grown in LB broth overnight at 28°C with agitation. Solutions of compounds 14 and 19 were prepared at 2 mg mL−1 with 2.5% DMSO in water and stored at 4°C. Where required, media were supplemented with final concentrations of 20 μg mL−1 compound 14 or 19 and 0.025% DMSO. Y. pseudotuberculosis and Y. pestis cultures were grown as above and then used to inoculate 10 mL of liquid media supplemented with 20 μg mL−1 compound 14 and DMSO or DMSO only, and incubated at 28°C overnight. Genomic DNA (2 μg) was isolated using the Puregene DNA isolation kit (Gentra Systems, Minneapolis, MN, USA) and digested by one of the restriction endonucleases, MboI, Sau3AI or DpnI (Promega, Southampton, UK) for 4 h at 37°C. Restricted DNA was analysed by electrophoresis on 0.7% (w/v) agarose gels. After electrophoresis, the gels were visualized under UV illumination.
Effect of compound 14 on Yersinia growth
Growth curves were performed to confirm that the inhibitor did not affect the growth of Y. pestis. Overnight broth culture was used to inoculate 10 mL of liquid media: BAB broth supplemented with 2.5 mM CaCl2, BAB broth supplemented with 2.5 mM CaCl2, 20 μg mL−1 compound 14 and 0.025% DMSO, or BAB broth supplemented with 2.5 mM CaCl2 and 0.025% DMSO. Cultures were incubated at 37°C with agitation and 1 mL of samples was removed periodically and the OD590 was determined. This was performed in triplicate.
Transcriptional analysis
Y. pestis GB cultures were grown as above and 0.25 mL aliquots were used to inoculate 10 mL of BAB broth supplemented with 2.5 mM CaCl2, compound 14 and 0.025% DMSO. Controls were also prepared and supplemented with 2.5 mM CaCl2 and 0.025% DMSO. Cultures were incubated at 37°C with agitation to an OD590 of 0.4. Aliquots of 2 mL of culture were removed into RNA Protect (Qiagen, Crawley, UK) and mRNA was extracted using the RNeasy kit (Qiagen) according to the manufacturer's instructions. RNA concentration was determined for each preparation by nanodrop quantification. Ethanol precipitation was performed and the RNA was re-suspended with the appropriate volume of RNase-free distilled water to give a final concentration of 1 mg mL−1. Samples were stored at −80°C until required. All hybridizations were performed according to the protocol described previously (Robinson et al., 2005).
Whole genome microarrays based on the CO92 strain were obtained from St Georges' Hospital Bacterial Microarray group at the University of London. All predicted CO92 coding sequences are represented on the microarray. Gene numbers refer to the published genome sequence annotation (Parkhill et al., 2001). Microarray slides were scanned using an Affymetrix 428 scanner (MWG Biotech, London, UK) with GenePix software. Subsequent GenePix analysis enabled spot quantification to be captured. Quantified data were loaded into Genespring 6.0 (Silicon Genetics, now Agilent). Data were interpreted using the ‘log of ratio’, with the cross-gene error model switched off. A twofold difference in expression level between the wild type and the mutant was set as the cut-off. Genes that demonstrated at least a twofold difference in expression level were tested by Student's t-test to determine that the difference was statistically significant. The Benjamini and Hochberg false discovery rate was used to correct for multiple testing. The results are a compilation of the gene expression profiles of three biological replicates grown on different days and two arrays of each replicate were also performed on different days, resulting in a total of six arrays.
To validate the transcriptional data, quantitative reverse-transcription PCR (RT-PCR) was undertaken on cultures grown in triplicate either with or without compound 14. RNA was extracted as above, converted to cDNA and analysed using primers listed in Table 1. Briefly, RNA was pretreated with a Turbo DNA-free kit (Ambion, Austin, TX, USA) according to the manufacturer's instructions and reverse-transcribed using an Enhanced Avian RT First Strand Synthesis kit (Sigma-Aldrich). PCR was performed in 20 μL reactions containing 125 mM dNTPs, 1 mM oligonucleotides, 50 ng cDNA, 2 μL of PCR buffer (Roche, UK) and 0.1 μL of Taq polymerase. PCRs were performed under the following conditions: denaturation at 94°C for 5 min, followed by 30 cycles of 94°C for 30 s, 55°C for 30 s and 72°C for 1 min, and a final elongation at 72°C for 7 min. The gyrB, proS and 16S rRNA genes were used as internal controls. Genomic DNA was included as a positive control, and distilled water and RNA controls were performed to exclude the possibility of DNA contamination. Bands were compared under UV light after 1% agarose gel electrophoresis of samples.
Table 1.
Oligonucleotide primers used for RT-PCR validation of transcriptional profiling
| Primer name | Forward primer | Reverse primer | Gene | Size of amplicon (bp) |
|---|---|---|---|---|
| gyrB | AAGTGGTGGGTGAAACTGAG | GTTCAGGGTACGGGTCATCG | DNA gyrase subunit B | 419 |
| iucA | CCAGGCAGAACAAGGATTAC | ACAGGGTTCGTACTGAGTTG | Similar to E. coli aerobactin siderophore | 460 |
| iutA | CAGACCGGCTTGCAATATTC | AACGTCATGCCGCCGGATTG | Putative ferric siderophore receptor | 524 |
| proS | CCTTCCATACTACGCAAGAG | AGGAGCGCAACCAACTTATG | Prolyl-tRNA synthetase | 406 |
| ybtT | TGCATTCTGAACGCCAGCTC | AGGACCGGGCTTGTTGAATG | Yersiniabactin biosynthetic protein | 339 |
| YPO0264 | TTGCCCACCCATTATGGTTG | GTTTGCGCCTGCATAGAACG | Conserved hypothetical protein | 493 |
| YPO0265 | AGTTATTCCGGCGGCTTATC | TGCAGCATTGGAGAGCTGAG | Putative type III secretion system apparatus | 498 |
| YPO0266 | GCCATCAATCTTGCCTTCTC | TCCCGTAGCCGTTTAGCTTC | Secretion system apparatus protein | 398 |
| YPO0267 | GTGGCGCAGGGTGAATTATG | GGAGTCAGCACCTGTTCAAG | Putative type III secretion ATP synthase | 500 |
| YPO0268 | GACGCTACAACGGCTATTGG | CGCTGATTACGCCGTAACCG | Type III secretion system apparatus protein | 330 |
| YPO0269 | GTTGTTGGCCGCAGAGTTAG | TTCTGTTCCCACCCTCTAGC | Type III secretion system apparatus protein | 428 |
| YPO0270 | CGCTGGGTGTTCAACAAGTG | AAGCTGTCCGAGAACCAATG | Putative type III secretion system apparatus | 506 |
| YPO0271 | CTGGCCACTGAGTTGTTATG | GGCCGCATACTGGTTATCTG | Putative type III secretion system apparatus | 242 |
| YPO0272 | GGTGTTATGCACGGAGCTAC | GTAGTGATGCAGGCCATAAG | Putative type III secretion system apparatus | 508 |
| YPO0273 | GCATATCGTGGTGGTCTTGG | CTGCTTAATGTGCGGATCCC | Putative type III secretion system apparatus | 457 |
| YPO1532 | GCATCAGTGAGCGAGTATTG | GCGGGTGGCTGCGATTAAAG | Putative siderophore biosynthetic enzyme | 549 |
| YPO1533 | GACGGAAGATGAACGTATCG | TAATGATCCGGCAACGTAGC | Putative iron-siderophore transport system | 392 |
| YPO1534 | CAATTGCGGTTACCAAGAGC | CAAGCCCGGCATAACCAGTC | Putative iron-siderophore transport system | 450 |
| YPO1535 | CTACTCGGTGCAGCACTAGC | GCCGAGCAGTAAGCAATAAG | Putative iron-siderophore transport system | 492 |
| YPO1536 | CGGCCAAACACTCGGAGAAG | TCAGCGGTGTGCCATAGGAC | Putative iron-siderophore transport system | 446 |
| YPO1537 | ATACAGCGGCCTGACTTATG | GACTTTCCGTGGTGTGACTG | Putative iron-siderophore receptor | 421 |
| YPO1538 | GGGCGATTACCAATGGGAAC | TTTGGCATAGGGCTTTCTCG | Putative siderophore biosynthetic enzyme | 495 |
Results
HTS
The real-time molecular break light Dam activity assay (Figure 1), previously utilized in a 96 well format, was adapted for HTS in a 384 well format. Assay conditions were optimized to ensure maximization of the screening window (described in detail in Supplementary Section S5). This was monitored by calculating the Z-factor over 96 assays prepared in a 20 μL volume. Optimal conditions for screening were found to be 25 μM AdoMet, 10 nM hemimethylated oligonucleotide 1, 2 nM DpnI and 1 nM Y. pestis Dam. The reproducibility, the background activity (observed in negative control experiments) and the size of the screening window were measured in a set of control experiments and the analysis of these data is presented in Table 2. The results show the assay to be highly reproducible [coefficient of variation (CV) ∼ 10%], with an excellent screening window as measured by the Z-factor (Zhang et al., 1999) (0.71) and an acceptably low activity in negative control assays (1.41% relative to positive control assays) due to non-specific cleavage of substrate oligonucleotide 1 by DpnI.
Figure 1.

Break light Dam activity assay and raw assay data. (A) Hemimethylated break light oligonucleotide 1 containing a GATC methylation site is fully methylated in a reaction catalyzed by Dam forming oligonucleotide 2, which is a substrate for the restriction enzyme DpnI. Cleavage by DpnI results in the separation of fluorophore (fluorescein) and quencher (dabcyl) and a subsequent proportional increase in fluorescence. (B) Fluorescence signal against time for positive (containing no library compound) and negative (containing no AdoMet and no library compound) control assays. (C) Fluorescence signal against time for full assay supplemented with inhibitor compound 3 (1, 10 or 100 μM).
Table 2.
Statistical analysis of assay reproducibility and quality under HTS conditions during optimization and screening
| Coefficient of variation (CV) [(σc+/μc+) × 100]a | Negative control activity [(μc-/μc+) × 100]a | Z-factor* (Equation 1) | |
|---|---|---|---|
| HTS optimizationb | 9.05% | 1.41% | 0.71 |
| HTS experiment Ac | 10.5 ± 3.53% | 5.46 ± 1.93% | 0.63 ± 0.12 |
| HTS experiment Bc | 9.07 ± 2.43% | 3.85 ± 1.12% | 0.69 ± 0.08 |
μc+ and μc- are the mean of the positive (no library compound) and negative (no library compound or AdoMet) controls, respectively, and σc+ and σc- are the standard deviation of the positive and negative controls respectively.
Data from 1 set of 48 positive and 48 negative controls.
Data from 39 sets of 8 positive and 8 negative controls.
Zhang et al. (1999).
A set of 3082 compounds from the open access NCI/DTP library was screened in duplicate (labelled experiments A and B in Table 2) at a concentration of 25 μM using the Dam activity assay (Figure 1). During screening experiments A and B, activity was measured in over 300 (positive and negative) control assays and these data confirmed the reproducibility, excellent screening window (Zhang et al., 1999) and low non-specific activity of the assay (as shown in Table 2). A total of 146 compounds were identified as potential Dam inhibitors (hits) in both the initial and the duplicate screens, giving a hit rate of 4.7%. Counter-screening these compounds against DpnI eliminated 120 non-specific inhibitors and fluorescence intercalation displacement (FID) assays showed that 20 of the remaining compounds intercalated DNA at a concentration of 5 μM, leaving 6 viable leads (Figures 2 and 3).
Figure 2.
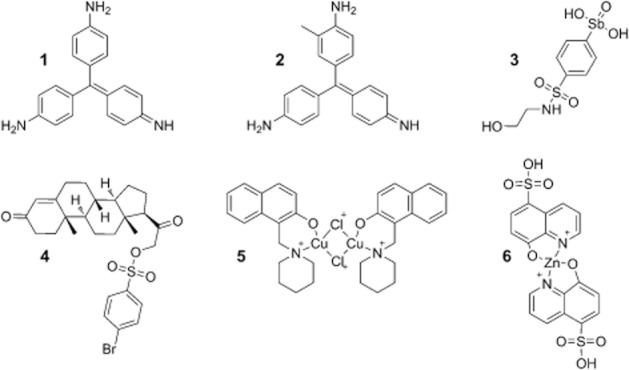
Structure of NCI/DTP library screen hits. Structures of NSC compounds: 10460 (1), 93739 (2), 13776 (3), 88915 (4), 109268 (5) and 166687 (6).
Figure 3.
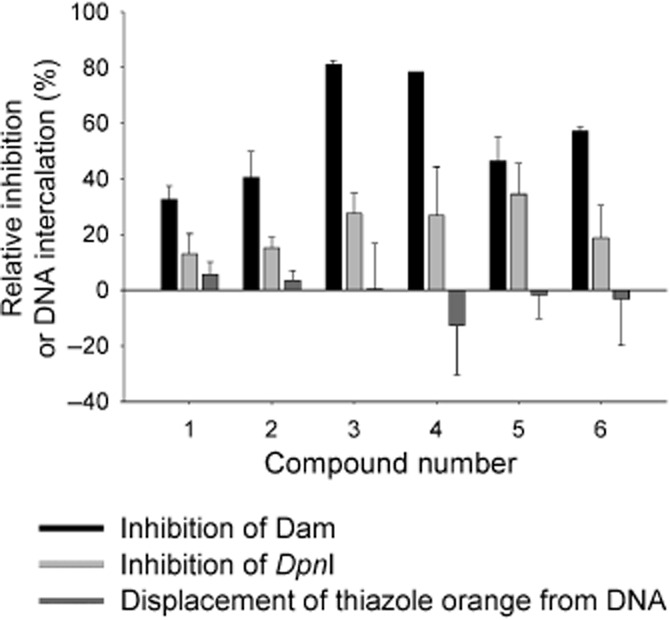
Results of screening and counter-screening for NCI/DTP library screen hits. Bar chart showing inhibition of Yersinia pestis Dam, inhibition of DpnI and percentage displacement of thiazole orange from DNA. All percentages shown are relative to positive control assays containing no library compound.
FID assays at higher concentrations identified compounds 1 (NSC 10460) and 2 (NSC 93739) as DNA intercalators, displacing thiazole orange at concentrations greater than those originally tested. Further characterization showed compound 4 (NSC 88915) to be an impure sample, with at least three different components identifiable by TLC and compound 5 (NSC 109268) to be poorly soluble under assay conditions. All four compounds were therefore discarded.
Assays of Y. pestis Dam activity over a concentration range of 0.001–1000 μM of bis(8-hydroxyquinoline-5-sulfonic acid) zinc(II) 6 (NSC 166687) and its component parts, 8-hydroxy-quinoline-5-sulphonic acid (HQSA) and zinc (assayed as the chloride salt), showed HQSA to have no inhibitory effect on Y. pestis Dam (Supplementary Section S6 and Figure S8A). The IC50 of zinc chloride was measured as 9.79 ± 1.52 μM, approximately half that of compound 6, 25.9 ± 4.99 μM, suggesting that the inhibitory effect of compound 6 was due to the release of zinc ions in the solution.
Further investigations (Supplementary Figure S8B) demonstrated that zinc chloride inhibited DpnI with an IC50 of 17.5 ± 3.21 μM, significantly lower than the IC50 of compound 6 for DpnI (96.4 ± 23.3 μM). Divalent zinc ions have a radius of approximately 0.74 Å, similar to that of divalent magnesium ions (0.71 Å), which are required for the catalytic activity of DpnI (Lacks and Greenberg, 1975). The inhibition of DpnI by zinc ions may therefore be due to competitive binding to the catalytic site, blocking the binding of magnesium ions and preventing DNA cleavage, although other mechanisms of inhibition may also be operating. Zinc has a role in many important cellular processes (Stefanidou et al., 2006), which led us to conclude that the inhibitory effect observed in these experiments was unlikely to lead to a therapeutic agent and compound 6 was therefore excluded from further investigations.
In summary, of the six hits from the HTS (Figure 2), compounds 1 and 2 were discarded as weak DNA intercalators, compound 4 showed poor aqueous solubility, the sample of compound 5 was impure and compound 6, a zinc salt, was unlikely to be acting as a specific Dam inhibitor. This narrowed the six hits down to a single potential lead, the aryl stibonic acid 3 (NSC 13776).
Structure–activity relationships
The role of the stibonic acid group in the activity of (4-(N-(2-hydroxyethyl)sulfamoyl)phenyl)stibonic acid 3 (NSC 13776) was investigated through a sub-library screen of a series of arylstibonic acids obtained from the NCI/DTP (Figure 4). The 38-compound sub-library was screened in duplicate against Y. pestis Dam, identifying 17 additional hits. These hits were assayed over a concentration range of 0.0001–100 μM to determine IC50 values and the compounds were then ranked in terms of potency (Table 3 and Figure 4).
Figure 4.
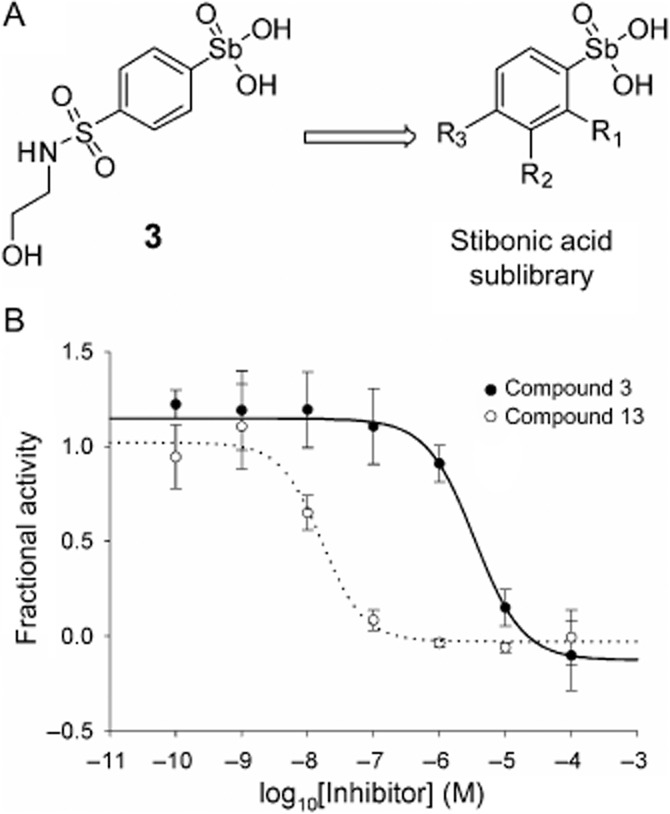
Arylstibonic acid sub-library and IC50 plots of arylstibonic acid inhibitors. (A) Structure of the arylstibonic acid sub-library (individual compound structures are shown in Supplementary Section S7). (B) IC50 plots for compounds 3 and 13 showing increase in potency, data fitted to equation 5 to give the results shown in Table 3. Structure of compound 3 is shown; for compound 13, R1 and R2 = H and R3 = SO3H.
Table 3.
IC50 values for arylstibonic acids as inhibitors of Y. pestis Dam and DpnI, and selectivity for Y. pestis Dam over DpnI
| Compounda | R1 | R2 | R3 | Y. pestis Dam IC50 (nM−1) |
|---|---|---|---|---|
| 13 (13746) | H | H | SO3H | 16.4 ± 4.46 |
| 15 (15578) | H | H | CH2SO3H | 43.1 ± 15.9 |
| 16 (13771) | H | CO2CH3 | H | 65.5 ± 22.2 |
| 11 (13759) | H | CO2H | H | 75.9 ± 11.8 |
| 17 (15584) | H | CO2C2H5 | H | 87.8 ± 9.23 |
| 10 (13755) | H | NO2 | CO2H | 119 ± 19.5 |
| 12 (13760) | H | H | CO2H | 125 ± 20.3 |
| 18 (15583) | H | H | CO2C2H5 | 214 ± 74.7 |
| 19 (13778) | H | C2H4CO2H | H | 247 ± 71.8 |
| 20 (13765) | H | CONH2 | H | 288 ± 126 |
| 21 (13793) | H | H | C3H6CO2C2H5 | 488 ± 74.6 |
| 14 (13782) | H | CONHC2H4OH | H | 742 ± 82.6 |
| 22 (15575) | H | H | CONH2 | 1 020 ± 136 |
| 23 (15577) | H | H | CH3 | 1 320 ± 700 |
| 24 (13758) | CO2H | H | H | 2 850 ± 893 |
| 3 (13776) | H | H | SO2NHC2H4OH | 3 260 ± 1 140 |
| 25 (13745) | H | H | OH | 7 250 ± 1 150 |
| 26 (25176) | H | H | NH2 | >10 000 |
Compounds ranked by Y. pestis Dam IC50, NSC identifier given in parentheses.
The effect of replacing the stibonic acid moiety with a phosphonic acid isostere was investigated using a series of 41 compounds obtained from the NCI/DTP. Duplicate screening of this sub-library at a concentration of 25 μM identified no hits. Further Dam activity assays of three phosphonic acids [NSC: 129465 (7), 666474 (8) and 13565 (9), shown in Supplementary Section S8] were completed over a concentration range of 0.001–1000 μM. The analogous arylstibonic acids [NSC: 13755 (10), 13759 (11) and 13760 (12), shown in Supplementary Section S7] inhibited Y. pestis Dam, with IC50 values ranging from 0.08 to 0.12 μM; however, the phosphonic acids showed no effect on Y. pestis Dam activity up to a concentration of 1 mM.
Kinetic characterization of the arylstibonic acid Dam inhibitors
Apparent Ki values were determined for the original hit compound 3 and the most potent arylstibonic acid inhibitor, 4-stibonobenzenesulfonic acid 13 (NSC 13746) (Figure 5 and Supplementary Table S5). Further analysis (Supplementary Figure S3) revealed a competitive mode of action for both 3 and 13 with respect to oligonucleotide 1 and non-competitive modes of action with respect to AdoMet. The apparent Ki was measured as 0.96 ± 0.49 μM for compound 3 and 6.46 ± 0.29 nM for compound 13 in an experiment in which oligonucleotide 1 concentration was varied and AdoMet was present in excess (approximating to a single variable substrate concentration).
Figure 5.

Inhibition of Y. pestis Dam by compounds 3 and 13. (A) Varying DNA concentration and (B) varying AdoMet concentration. Each substrate was tested against a range of concentrations of inhibitor 3 (0, 0.77, 1.92, 4.80, 12.00, 30 and 75 μM). (C) Varying DNA concentration and (D) varying AdoMet concentration. Each substrate was tested against a range of concentrations of inhibitor 13 (0, 6.54, 15.36, 38.40, 96, 240 and 600 nM). For the experiments in which the concentration of oligonucleotides 1 was varied, data were fitted to a competitive inhibition model to give Ki values of 4.90 ± 1.78 nM for compound 13 and 0.70 ± 0.18 μM for compound 3. A non-competitive model was used for experiments in which AdoMet was varied and gave Ki values of 47.80 ± 3.02 nM for compound 13 and 4.52 ± 0.23 μM for compound 3.
The extent to which compounds 3 and 13 affect the binding of oligonucleotide 4 to Dam in the presence and absence of the methyl donor product AdoHcy was determined in a fluorescence anisotropy competition binding assay (Supplementary Section S4). Such competition binding assays took up to 1 h to complete, and the -term stability of Dam during these experiments was therefore an important consideration. Kinetic analysis of Y. pestis Dam inactivation has shown the enzyme to be particularly unstable (Wood et al., 2007) and the more stable E. coli enzyme was used for these measurements. Both compounds 3 and 13 were found to fully displace oligonucleotide 4 in the presence and absence of AdoHcy, resulting in a drop in fluorescence anisotropy values to that of free-labelled 4 in solution. Competition binding constants (Kdi) were determined (Table 4 and Supplementary Section S9).
Table 4.
Inhibition binding constants for compounds 3 and 13 with and without the AdoMet analogue AdoHcy
| Compound | Second ligand | Kd inhibition (μM) (Roehrl18) | Goodness of fit (R2) | Kd inhibition (μM) (Kenakin19) | Goodness of fit (R2) |
|---|---|---|---|---|---|
| 3 | None | 32.78 ± 15.34 | 0.796 | 32.39 ± 9.89 | 0.961 |
| AdoHcy | 49.82 ± 4.50 | 0.880 | 42.91 ± 6.16 | 0.989 | |
| 13 | None | 0.62 ± 0.27 | 0.955 | 0.55 ± 0.10 | 0.993 |
| AdoHcy | 0.71 ± 0.10 | 0.968 | 0.71 ± 0.09 | 0.997 |
Screening of stibonic acid sub-library against Yersinia
Compounds identified as inhibiting Dam activity in the HTS assay were tested for their ability to penetrate bacterial cells and inhibit Dam. Y. pseudotuberculosis is a close relative of Y. pestis, but can be handled at lower levels of containment. Therefore, preliminary screening was undertaken with the less dangerous pathogen. Standard minimum inhibitory concentration (MIC) experiments showed no inhibition of growth of Y. pseudotuberculosis in vitro (data not shown). DNA was isolated from cultures grown in the presence of each inhibitor and digested with three restriction enzymes that recognize GATC sites, MboI, Sau3AI or DpnI (Figure 6). Enzyme Sau3AI degrades DNA regardless of methylation state, so complete digestion was observed in the presence of no inhibitor (not shown) and in the presence of each inhibitor. Enzyme DpnI only cuts fully methylated GATC motifs. DNA isolated from cultures grown in the presence of all the compounds was degraded by DpnI, showing that methylation of GATC sites had occurred. Enzyme MboI only cuts non-methylated GATC motifs and thus should not cut normally methylated Yersinia DNA. In the presence of most of the test compounds, the DNA remained uncut, indicating complete methylation, and only DNA isolated from bacteria grown in the presence of compound 14 was digested by MboI, indicating that at least a proportion of GATC sites in this preparation were un-methylated. It should be noted that although compound 3 was significantly more potent during in vitro enzyme activity assays, compound 3 and the other aryl stibonic acids (with the single exception of compound 14) showed no activity with cultured Yersinia, a result that is probably due to the differences in the ability of the compounds to penetrate intact cultured bacteria.
Figure 6.
Inhibition of Dam activity by compound 14 in (A) Y. pseudotuberculosis and (B) Y. pestis. Genomic DNA (2 μg) was isolated using the Puregene DNA isolation kit (Gentra Systems, Minneapolis, USA) from (A) Y. pseudotuberculosis and (B) Y. pestis. The DNA was digested by one of the restriction endonucleases, MboI, Sau3AI or DpnI then analysed by electrophoresis on 0.7% (w/v) agarose gels. Uncut DNA appears as a dark smear high on the gel. Digestion results in degradation of the DNA to a range of small fragments, which make a faint smear. In (A), Lane 1: Markers (DriGestIII, Amersham), Lanes 2-5: DNA isolated from Y. pseudotuberculosis grown in the presence of compound 19 either uncut (Lane 2) or after incubation with DpnI (Lane 3), MboI (Lane 4) or Sau3AI (Lane 5). Lanes 6-9: DNA isolated from Y. pseudotuberculosis grown in the presence of compound 14 either uncut (Lane 6) or after incubation with DpnI (Lane 7), MboI (Lane 8) or Sau3AI (Lane 9). Uncut DNA is visible in Lanes 2, 4 and 6, but not in the remaining lanes, showing that the DNA has been digested in these samples to small fragments. In (B). Lanes 1-4: DNA isolated from Y. pestis grown in the presence of compound 14 either uncut (Lane 1) or after incubation with DpnI (Lane 2), MboI (Lane 3) or Sau3AI (Lane 4). Lane 5: Markers (DriGestIII, Amersham). Uncut DNA is visible in Lane 1, as expected. DNA is not visible in Lanes 2 and 4, showing that the DNA has been digested in these samples to small fragments. A smear is visible in Lane 3, showing that the DNA has been digested, but the fragments are larger than was generated in Lanes 2 and 4.
Having identified compound 14 as modulating the extent of DNA methylation in cultured Yersinia species, we wished to test its activity in Y. pestis. MIC experiments showed no inhibition of growth of Y. pestis in vitro (data not shown). Therefore, investigation into the effect of the compound on growth of Y. pseudotuberculosis and Y. pestis was undertaken. No differences in growth were observed during logarithmic growth with or without inhibitor (Figure 7). Y. pestis was grown in the presence of compounds 14 and 19 (selected randomly from the compounds that were ineffective at penetrating into Y. pseudotuberculosis) and the DNA was digested as above. Again, growth in the presence of compound 19 did not affect the pattern of DNA restriction, while the pattern observed after growth in broth supplemented with compound 14 was affected similarly in Y. pestis as it was in Y. pseudotuberculosis (Figure 6).
Figure 7.
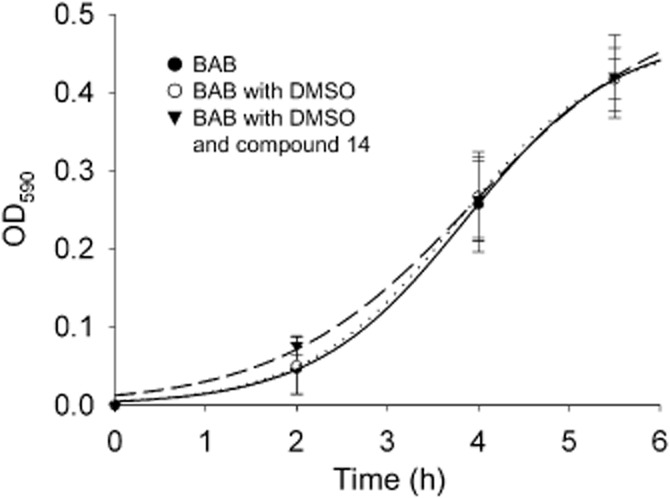
Growth curves for Y. pestis GB in BAB, BAB supplemented with DMSO or BAB supplemented with DMSO and compound 14. Data fitted to a sigmoid of the form f = a/{1 + exp[−(x − x0)/b]}.
Compound 14 affects diverse bacterial systems, including known Yersinia virulence traits
Six paired RNA samples were isolated from Y. pestis GB grown in BAB broth supplemented with 2.5 mM CaCl2 and compound 14 and DMSO (Dam inhibitor-treated test samples) or BAB broth supplemented with 2.5 mM CaCl2 and DMSO (untreated control samples). For each hybridization, the control (minus inhibitor) was compared with the matched test (with inhibitor). Each sample was compared in duplicate to provide two technical replicates for each biological replicate, thus increasing the power for statistical analysis. An initial statistical analysis was performed using an unpaired t-test with no multiple testing correction (MTC). This enabled the generation of a gene list detailing 625 Y. pestis open reading frames (ORFs), which showed a statistically significant fold change (greater than 1.3-fold up-/down-regulation) following exposure to Dam inhibitor compound 14. The Benjamini Hochberg MTC was applied to this initial gene list, generating a final data set of 91 Y. pestis ORFs showing a statistically significant fold change after treatment with compound 14 (Table 5). Among those Y. pestis genes down-regulated in the presence of compound 14, chromosomally located ORFs annotated as encoding proteins involved in iron acquisition, type III secretion, DNA repair and response to universal stress. Furthermore, cross-reference with the larger data set with no MTC identified additional down-regulated genes, within the chromosomally located type III secretion operon, which were excluded from the final data set by the stringent statistical analysis applied. To further confirm that selected genes of interest were down-regulated by Y. pestis during exposure to compound 14, primers were designed to enable semi-quantitative RT-PCR analysis and validation of the microarray data. Primers were designed for ORFs YPO0264-YPO0273 to see whether the down-regulation seen for YPO265 and YPO0273 was also observed for other genes in the operon encoding the type III secretion system (TTSS). Down-regulation of transcription was observed for the majority of these genes by RT-PCR, except for YPO0269, suggesting that expression of the entire operon was down-regulated, and confirming observations from the microarray analysis. Similarly, RT-PCR was used to analyse the mRNA levels from ORFs YPO1532-YPO1538, which constitute an operon associated with siderophore-mediated acquisition of iron, and other iron acquisition-associated genes, iutA, iucA and ybtT. By microarray analysis, down-regulation had been observed for YPO1532, YPO1536, iutA, iucA and ybtT. RT-PCR confirmed the down-regulation of these genes, except for iucA, for which no signal could be obtained from multiple preparations. All other genes in the YPO1532-YPO1538 operon were seen to be down-regulated in the presence of the inhibitor.
Table 5.
Y. pestis GB genes showing >1.3-fold differential regulation during growth in the presence of compound 14
| Gene ID | Annotation | Corrected P value | P value | FC absolutea |
|---|---|---|---|---|
| Up-regulation | ||||
| nupC | Nucleoside permease | 1.43E−03 | 2.28E−06 | 2.38 |
| pCD1-yscJ | Putative type III secretion lipoprotein | 1.21E−02 | 1.06E−04 | 2.26 |
| YPO0473 | Hypothetical protein | 4.41E−03 | 2.11E−05 | 2.23 |
| YPO2605 | Conserved hypothetical protein | 1.65E−03 | 4.59E−06 | 2.14 |
| dacA | Cutative penicillin-binding protein 5 | 2.56E−02 | 4.49E−04 | 1.98 |
| fabF | 3-oxoacyl-[acyl-carrier-protein] synthase II | 1.21E−02 | 9.97E−05 | 1.97 |
| topA | DNA topoisomerase I | 6.96E−04 | 8.30E−07 | 1.96 |
| YPO1716 | Putative transport protein | 1.49E−03 | 3.08E−06 | 1.90 |
| pCD1-27 | Putative type III secretion protein | 4.93E−03 | 2.55E−05 | 1.88 |
| secD | Protein-export membrane protein SecD | 2.44E−02 | 2.91E−04 | 1.88 |
| YPO2422 | Conserved hypothetical protein | 2.53E−02 | 3.34E−04 | 1.81 |
| dapX | Lipoprotein | 2.53E−02 | 3.99E−04 | 1.80 |
| prfA | Peptide chain release factor 1 | 7.20E−03 | 4.01E−05 | 1.78 |
| ffh | Signal recognition particle protein | 7.65E−03 | 4.56E−05 | 1.77 |
| YPO2978 | Putative membrane protein | 4.13E−02 | 1.21E−03 | 1.76 |
| YPO2875 | GTP-binding protein | 2.53E−02 | 4.17E−04 | 1.76 |
| trmD | tRNA (guanine-N1)-methyltransferase | 3.53E−02 | 8.60E−04 | 1.72 |
| rpoH | RNA polymerase sigma-32 factor | 2.53E−02 | 3.28E−04 | 1.69 |
| yapA | Putative autotransporter protein | 4.64E−02 | 1.57E−03 | 1.67 |
| fabH | 3-oxoacyl-[acyl-carrier-protein] synthase III | 2.85E−02 | 5.33E−04 | 1.66 |
| pCD1-sycE | Putative yopE chaperone | 3.83E−02 | 1.04E−03 | 1.66 |
| YPO2050 | Conserved hypothetical protein | 4.05E−02 | 1.18E−03 | 1.65 |
| pCD1-yscX | Putative type III secretion protein | 2.93E−03 | 1.25E−05 | 1.62 |
| hemH | Ferrochelatase | 3.53E−02 | 8.46E−04 | 1.60 |
| pyrG | CTP synthase | 3.83E−02 | 1.07E−03 | 1.60 |
| YPO1575 | Conserved hypothetical protein | 4.97E−02 | 1.84E−03 | 1.59 |
| ribD | Riboflavin biosynthesis protein RibD | 2.22E−02 | 2.39E−04 | 1.57 |
| cysP | Thiosulfate-binding protein | 3.67E−02 | 9.42E−04 | 1.55 |
| nadD | Putative nicotinate-nucleotide | 1.21E−02 | 1.01E−04 | 1.52 |
| purK | Phosphoribosylaminoimidazole carboxylase ATPase | 4.96E−02 | 1.79E−03 | 1.52 |
| rplM | 50S ribosomal protein L13 | 3.53E−02 | 8.17E−04 | 1.51 |
| nuoF | NADH dehydrogenase I chain F | 3.53E−02 | 8.70E−04 | 1.51 |
| atpI | ATP synthase protein I | 1.21E−02 | 9.99E−05 | 1.51 |
| pCD1-73c | Hypothetical protein | 3.08E−02 | 6.01E−04 | 1.50 |
| murB | UDP-N-acetylenolpyruvoylglucosamine reductase | 2.53E−02 | 4.32E−04 | 1.50 |
| tatC | Sec-independent protein translocase protein | 1.71E−02 | 1.64E−04 | 1.50 |
| mreC | Rod shape-determining protein MreC | 4.67E−02 | 1.60E−03 | 1.49 |
| speE | Spermidine synthase | 2.53E−02 | 4.01E−04 | 1.45 |
| tmk | Thymidylate kinase | 2.53E−02 | 3.11E−04 | 1.40 |
| pPMT1-85 | – | 3.26E−02 | 6.48E−04 | 1.36 |
| YPO3170 | Conserved hypothetical protein | 4.36E−02 | 1.35E−03 | 1.35 |
| YPO3857 | Conserved hypothetical protein | 3.53E−02 | 8.35E−04 | 1.32 |
| guaC | GMP reductase | 4.36E−02 | 1.35E−03 | 1.30 |
| Down-regulation | ||||
| YPO2304 | Hypothetical protein | 2.25E−02 | 2.60E−04 | 3.09 |
| katA | Catalase | 2.93E−03 | 1.26E−05 | 2.87 |
| YPO1892 | Putative oxidoreductase | 2.53E−02 | 4.24E−04 | 2.74 |
| YPO3279 | Putative sigma 54 modulation protein | 1.93E−02 | 1.98E−04 | 2.55 |
| YPO3744 | Hypothetical protein | 2.25E−02 | 2.59E−04 | 2.49 |
| YPO2675 | Putative potassium channel protein | 7.74E−03 | 4.92E−05 | 2.40 |
| uspA | Universal stress protein A | 1.49E−03 | 3.57E−06 | 2.39 |
| YPO0735 | Hypothetical protein | 4.58E−02 | 1.53E−03 | 2.39 |
| nrdA | Ribonucleoside-diphosphate reductase 1α | 1.93E−02 | 2.00E−04 | 2.34 |
| narX | Nitrate/nitrite sensor protein | 4.73E−02 | 1.68E−03 | 2.23 |
| 23 s rRNA | 23S ribosomal RNA | 3.53E−02 | 8.36E−04 | 2.12 |
| YPO0072 | Bifunctional regulatory protein/DNA repair | 3.78E−02 | 1.01E−03 | 2.06 |
| YPO2705 | Conserved hypothetical protein | 2.93E−03 | 1.06E−05 | 1.99 |
| YPO2745 | Conserved hypothetical protein | 3.48E−02 | 7.20E−04 | 1.97 |
| YPO3556 | Conserved hypothetical protein | 3.89E−02 | 1.11E−03 | 1.97 |
| YPO1354 | Putative lipoprotein | 4.29E−02 | 1.30E−03 | 1.96 |
| YPO2935 | Putative exported protein | 2.93E−03 | 1.28E−05 | 1.94 |
| YPO1536 | Putative iron-siderophore transport system | 4.58E−02 | 1.53E−03 | 1.90 |
| YPO2197 | putative integral membrane protein: pseudogene in CO92 | 3.06E−02 | 5.83E−04 | 1.88 |
| frdC | Fumarate reductase hydrophobic protein | 4.43E−02 | 1.39E−03 | 1.88 |
| YPO1532 | Putative siderophore biosynthetic enzyme | 3.52E−02 | 7.42E−04 | 1.87 |
| dps | Putative DNA-binding protein | 3.67E−02 | 9.64E−04 | 1.87 |
| YPO3649 | Putative γ carboxymuconolactone | 4.49E−02 | 1.45E−03 | 1.87 |
| YPO3527 | Conserved hypothetical protein | 4.67E−02 | 1.62E−03 | 1.84 |
| ureE | Urease accessory protein | 2.53E−02 | 4.06E−04 | 1.78 |
| ureD | Urease accessory protein | 2.67E−02 | 4.77E−04 | 1.76 |
| YPO1736 | Putative membrane protein | 3.83E−02 | 1.06E−03 | 1.74 |
| YPO0505 | Conserved hypothetical protein | 4.96E−02 | 1.80E−03 | 1.73 |
| YPO1683 | Conserved hypothetical protein | 1.21E−02 | 9.99E−05 | 1.72 |
| iucA | Similar to E. coli aerobactin siderophore | 4.47E−02 | 1.42E−03 | 1.72 |
| YPO4020 | Putative membrane protein | 3.67E−02 | 9.53E−04 | 1.69 |
| ybtT | Yersiniabactin biosynthetic protein YbtT | 3.53E−02 | 8.61E−04 | 1.68 |
| YPO0966 | Putative kinase | 2.83E−02 | 5.17E−04 | 1.67 |
| YPO2672 | Conserved hypothetical protein | 3.60E−02 | 9.02E−04 | 1.66 |
| 16 s rRNA | 16S ribosomal RNA | 4.71E−02 | 1.65E−03 | 1.64 |
| napC | Cytochrome C-type protein NapC | 1.30E−02 | 1.18E−04 | 1.64 |
| YPO0273 | Putative type III secretion apparatus protein | 2.53E−02 | 4.14E−04 | 1.63 |
| cueR | Putative regulatory protein | 2.53E−02 | 3.91E−04 | 1.62 |
| map | Methionine aminopeptidase | 4.49E−02 | 1.47E−03 | 1.61 |
| YPO0511a | Hypothetical protein | 1.17E−02 | 7.93E−05 | 1.60 |
| YPO1568 | Hypothetical protein | 3.53E−02 | 7.89E−04 | 1.58 |
| pheT | Phenylalanyl-tRNA synthetase beta chain | 4.24E−02 | 1.26E−03 | 1.52 |
| nrdG | Anaerobic ribonucleoside-triphosphate reductase | 3.83E−02 | 1.08E−03 | 1.48 |
| YPO2846 | Putitive ABC-transporter ATP-binding protein | 2.53E−02 | 4.29E−04 | 1.43 |
| YPO0265 | Putative type III secretion system apparatus | 3.34E−02 | 6.78E−04 | 1.38 |
| YPO0969 | Hypothetical protein | 4.96E−02 | 1.81E−03 | 1.37 |
| ssuB | Putative aliphatic sulfonates transport | 2.53E−02 | 4.23E−04 | 1.37 |
| YPO3978 | Putative regulatory protein | 3.53E−02 | 8.05E−04 | 1.31 |
Discussion and conclusions
Despite the increasing problem of antibiotic resistance in medically important bacteria, few novel classes of antibiotic have been discovered recently (see Simmons et al., 2010). Only two new structural classes of antimicrobial in clinical use, daptomycin and linezolid, have been identified by empirical methods. HTS using purified enzyme targets to screen extensive small-molecule compound libraries can provide lead compounds that can then be modified to improve activity in vivo. However, HTS has had limited success in identifying the next generation of antibiotics. Often, compounds with good activity in enzyme assays fail when tested against microbes due to off-target effects, mainly because they have not been appropriately counter-screened to ensure adequate specificity.
In this study, we have used HTS, along with subsequent counter-screens to eliminate compounds with unwanted characteristics. A primary in vitro screen of the 3082 compounds from the NCI/DTP open access library identified 146 potential Dam inhibitors. Counter-screening eliminated 120 non-specific, DpnI inhibitors and a further 20 DNA intercalators, leaving a total of 6 Dam inhibitors. Of these final compounds, five were found to be unsuitable for further development, leaving one valid hit, the stibonic acid compound 3, and giving a final hit rate of 0.03%.
Basic structure–activity relationships for compounds related to 3 were investigated by screening an arylstibonic acid sub-library for Dam inhibitors. A further 17 inhibitors were identified from this sub-library screen. The most potent inhibitors were found to be those with a carbonyl or sulfonyl functional group in the meta- or para- positions, with the meta-substituted compounds showing a slightly greater potency than their para- and ortho-substituted analogues where available. Of the arylstibonic acid compounds tested, substituent groups were ranked in the following order of potency: sulfonic acid > carboxylic acid ≍ ester > amide. The increase in potency in this series is relatively small and unlikely to be due purely to an ionic interaction. However, the trends observed are consistent with the carbonyl/sulfonyl oxygen atom acting as a hydrogen bond acceptor. The increase in potency observed for meta-substituted compounds over their para- and ortho-substituted analogues may indicate a more favourable active site positioning or orientation of this hydrogen bond acceptor.
It has been suggested that the stibonate moiety of the arylstibonic acids may mimic the phosphate backbone of DNA, affecting the binding interaction between protein and DNA (Kim et al., 2008; Seiple et al., 2008). In order to investigate this hypothesis and improve structure–activity relationship data, a series of aryl phosphonic acids directly analogous to some of the inhibitory arylstibonic acids were screened for Dam inhibition. No inhibition was observed, suggesting that the arylstibonic acids are not acting as direct phosphate mimics.
Mode of inhibition studies showed compounds 3 and 13 to have competitive modes of action with respect to DNA and non-competitive modes of action with respect to AdoMet, suggesting that a common mode of inhibition may be observed for all the arylstibonic acid Dam inhibitors. Competition binding studies complemented these data by showing that both compounds 3 and 13 can fully displace a hemimethylated oligonucleotide substrate from E. coli Dam. Examination of the crystal structure of Dam complexed to an oligonucleotide duplex and AdoHcy (Horton et al., 2006) shows the surface contact area of Dam for the DNA to be larger (580 Ǻ2) than the surface contact area for the ligand AdoHcy (280 Ǻ2) (Krissinel and Henrick, 2007). The results of the competition binding experiments imply that the site to which the arylstibonic acids bind is located on the DNA-binding surface of the protein; however, the surface contact areas is too large to allow the precise site of binding to be determined at present and will require structural elucidation.
Arylstibonic acids have previously been shown to interact with a wide range of proteins, including those that bind DNA (Bond et al., 2006; Kim et al., 2008; Seiple et al., 2008; Rishi et al., 2010). Detailed analysis of the selectivity of stibonic acids against human DNA-binding proteins would therefore be an essential next step in assessing the suitability of these compounds as novel antimicrobial agents. In the current absence of such data, the only available data for the assessment of the toxicity of the arylstibonic acids to human cell lines come from the results of the National Cancer Institute's AIDS antiviral screen (http://dtp.nci.nih.gov/docs/aids/aids_data.html). This screen utilized a soluble formazan assay (Weislow et al., 1989) to determine the ability of each compound to protect T-lymphocyte-derived cells against the cytopathic effects of HIV. Uninfected T cells were also tested in order to determine cytotoxicity. Of the 17 arylstibonic acids found to be active against Dam, 11 have publicly available AIDS antiviral screening results, including toxicity data, which shows all of the compounds to have IC50 values against T cells of greater than 30 μM. These results would suggest that the arylstibonic acids are not inherently toxic to this cell line, and therefore, although they may interact with several different targets, they may have a common mode of inhibition that is not so promiscuous that it precludes their use as selective inhibitor.
A second reason promising compounds fail is because they cannot accumulate within the bacterial cell to sufficient levels to inhibit their target. This may be due to the degradation of compound by microbial enzymes, active efflux or lack of penetration by the compound into the cell. The stibonic acid sub-library was screened against Y. pestis and Y. pseudotuberculosis to identify compounds capable of accumulating within the cell and inhibiting Dam. A single compound, compound 14, was found to affect methylation levels in Yersinia, with genomic DNA digests showing altered digest patterns indicative of an increased proportion of unmethylated GATC sites. Isogenic dam mutants of Y. pseudotuberculosis and Y. pestis did not have an in vitro growth defect (Robinson et al., 2005; Taylor et al., 2005); therefore, inhibitors of Dam would not be expected to inhibit growth in laboratory media, unless there was an off-target toxic effect. As the growth of Y. pestis GB was unaffected by the addition of compound 14, we surmised that this inhibitor has little or no such toxicity.
The stibonic acid compound identified in this study may represent a lead compound against a novel target. Inhibition by compound 14 resulted in incomplete methylation of DNA in Yersinia, the effects of which were shown to be diverse and widespread. For example, the expression of iron acquisition systems was shown to be affected. Y. pestis has multiple iron uptake systems, of which the Yersiniabactin (Ybt) system is regarded as the most important in vivo. Mutants unable to synthesize or transport the Ybt siderophore were attenuated in murine models of bubonic and pneumonic plague (Fetherston et al., 2010). The ybtT gene, encoding part of the siderophore synthetic machinery, was the most significantly affected gene in this operon when the pathogen was grown with compound 14, and part of the ABC transporter required for Ybt uptake was also down-regulated. There are a range of further iron uptake systems in Y. pestis, such as Ybt, Yfe, Yfu, Hmu, Has, Yiu, Iuc, Ysu and Fhu systems (see Gao et al., 2008). The Ysu system, putatively encoding an iron uptake system, also showed differential regulation in cultures grown with inhibitor. However, it has yet to be shown that the system is active in ion acquisition and uptake, so the significance of this observation is not known. Regulation of iron acquisition systems by Dam has not been shown for any pathogen previously. One study involving Y. enterocolitica compared the expression of an iron siderophore receptor (FyuA) under normal and over-expression levels of Dam, and found no difference in FyuA expression (Fälker et al., 2005). A second in vivo-induced system essential for virulence of the human pathogenic Yersinia is a plasmid-encoded TTSS: loss of the TTSS is attenuating. Previously, overproduction of Dam has been shown to alter expression and secretion of components of the TTSS in Y. pseudotuberculosis and Y. enterocolitica (Julio et al., 2002; Fälker et al., 2006). Similarly, TTSS regulation was also shown to be influenced by Dam in S. enterica (Lopez-Garrido and Casadesus, 2010). Consistent with these observations, we found that the addition of compound 14 reduced expression of genes contributing to the TTSS in Y. pestis.
In conclusion, we have identified a novel class of compounds that inhibit Dam, using in vitro HTS. The lead compound also appears to inhibit Dam activity in bacterial cells and thus affects expression of systems key to virulence and in vivo survival. The true test of efficacy will be in vivo evaluation as this is an ‘anti-virulence’ target rather than a bactericidal or bacteriostatic target. However, before animal studies can be undertaken, the compound must be optimized and in vitro toxicology testing undertaken. A novel class of antivirulence agents has been identified that could, if active in vivo, be further developed into useful chemotherapeutic agents.
Acknowledgments
The authors wish to thank K. Barnes, S. Elvin and S. Richards for their help and support during this project. This work was funded and supported by contract W911NF-08-C0004 from the Defence Threat Reduction Agency.
Glossary
- AdoHcy
S-adenosylhomocysteine
- Am
N6-methyladenine
- D,
dabcyl quencher
- Dam
DNA adenine methyltransferase HQSA, 8-hydroxy-quinoline-5-sulphonic acid
- HTS
high-throughput screening
- Kdi
competition binding constant
- LB
Luria Bertani
- MTC
multiple testing correction
- NCI/DTP
National Cancer Institute Developmental Therapeutics Programme
- ORF
open reading frame
- TTSS
type III secretion system
Conflict of interest
None.
Supporting information
Additional Supporting Information may be found in the online version of this article:
Section S1 Expression and purification of recombinant enzymes.
Section S2 Fluorescence calibration curves.
Section S3 Kinetic analysis.
Section S4 Fluorescence anisotropy measurements.
Section S5 High-throughput Dam activity assay optimization.
Section S6 Inhibition of Dam and DpnI by compound 6 and its component parts.
Section S7 Structures of the arylstibonic acid sub-library.
Section S8 Structures of the phosphonic acid sub-library.
Section S9 Fluorescence anisotropy binding experiments.
Equation S1 The Z-factor. Where μc+ and μc− are the average positive and negative control signals, respectively, and σc+ and σc− are their respective standard deviations.
Equation S2 Relative percentage inhibition. Where μs is the library sample signal and μc+ is the average positive control signal.
Equation S3 Percentage fluorescence decrease. Where μs is the library sample signal and μc+ is the average positive control signal.
Equation S4 Fractional activity. Where νc+ is the average positive control rate, νc− is the average negative control rate and νi is the rate in the presence of an inhibitor.
Equation S5 Four-parameter logistic sigmoid where Fmin is the minimum fractional activity, Fmax is the maximum fractional activity, [I] is the concentration of inhibitor, IC50 is the half maximal inhibitory concentration of inhibitor and h is the Hill coefficient.
Equation S6 The Lineweaver–Burke equation. Where ν is the initial rate, KM is the Michaelis–Menten constant for the substrate, Vmax is the maximum rate and [S] is the substrate concentration.
Equation S7 Determination of fluorescence anisotropy (A) and fraction of substrate bound (B). Where Aobs is observed anisotropy, F‖ is parallel fluorescence, F‖bg is background parallel fluorescence, F⊥ is perpendicular fluorescence, F⊥bg is background, FSB is fraction of substrate bound, Af is anisotropy of free-labelled ligand, Ab is anisotropy of fully bound-labelled ligand and Q is the ratio of bound to free fluorescence.
Equation S8 (A,B) The Michaelis–Menten equation. Where ν is the initial rate, KM is the Michaelis–Menten constant for the substrate, Vmax is the maximum rate, [S] is substrate concentration and Ki is the substrate inhibition constant.
Equation S9 Determination of Kd. Where Kd is the dissociation binding constant, LT is the total labelled ligand concentration and ET is the total enzyme concentration.
Equation S10 Competition binding fit via the method of Roehrl et al. (A) and Kenakin (B). Where FSB is fraction of substrate bound, Kd is the dissociation binding constant, Kdi is the competition binding constant, LT is the total labelled ligand concentration, IT is the total inhibitor concentration, ET is the total enzyme concentration, Lf is the free-labelled ligand concentration at [I] = IC50, If is the free inhibitor concentration at [I] = IC50 and Lb is the bound-labelled ligand concentration at [I] = IC50.
References
- Andrews JM. Determination of minimum inhibitory concentrations. J Antimicrob Chemother. 2001;48:5–16. doi: 10.1093/jac/48.suppl_1.5. [DOI] [PubMed] [Google Scholar]
- Badie G, Heithoff DM, Mahan MJ. LcrV synthesis is altered by DNA adenine methylase overproduction in Yersinia pseudotuberculosis and is required to confer immunity in vaccinated hosts. Infect Immun. 2004;72:6707–6710. doi: 10.1128/IAI.72.11.6707-6710.2004. [DOI] [PMC free article] [PubMed] [Google Scholar]
- Balbontín R, Rowley G, Pucciarelli MG, Lopez-Garrido J, Wormstone Y, Lucchini S, et al. DNA adenine methylation regulates virulence gene expression in Salmonella enterica serovar Typhimurium. J Bacteriol. 2006;188:8160–8168. doi: 10.1128/JB.00847-06. [DOI] [PMC free article] [PubMed] [Google Scholar]
- Bond A, Reichert Z, Stivers JT. Novel and specific inhibitors of a Poxvirus type I topoisomerase. Mol Pharmacol. 2006;69:547–557. doi: 10.1124/mol.105.019067. [DOI] [PubMed] [Google Scholar]
- Braaten BA, Platko JV, van der Woude MW, Simons BH, de Graaf FK, Calvo JM, et al. Leucine-responsive regulatory protein controls the expression of both the pap and fan pili operons in Escherichia coli. Proc Natl Acad Sci U S A. 1992;89:4250–4254. doi: 10.1073/pnas.89.10.4250. [DOI] [PMC free article] [PubMed] [Google Scholar]
- Broadbent SE, Davies MR, van der Woude MW. Phase variation controls expression of Salmonella lipopolysaccharide modification genes by a DNA methylation-dependent mechanism. Mol Microbiol. 2010;77:337–353. doi: 10.1111/j.1365-2958.2010.07203.x. [DOI] [PMC free article] [PubMed] [Google Scholar]
- Casadesús J, Low D. Epigenetic gene regulation in the bacterial world. Microbiol Mol Biol Rev. 2006;70:830–856. doi: 10.1128/MMBR.00016-06. [DOI] [PMC free article] [PubMed] [Google Scholar]
- Chen L, Paulsen DB, Scruggs DW, Banes MM, Reeks BY, Lawrence ML. Alteration of DNA adenine methylase (Dam) activity in Pasteurella multocida causes increased spontaneous mutation frequency and attenuation in mice. Microbiology. 2003;149:2283–2290. doi: 10.1099/mic.0.26251-0. [DOI] [PubMed] [Google Scholar]
- Dennis DT, Gage KL, Grantz N, Poland JD, Tikhomirov E. Plague Manual: Epidemiology, Distribution, Surveillance and Control. Geneva: World Health Organization; 1999. [Google Scholar]
- Dueger EL, House JK, Heithoff DM, Mahan MJ. Salmonella DNA adenine methylase mutants elicit protective immune responses to homologous and heterologous serovars in chickens. Infect Immun. 2001;69:7950–7954. doi: 10.1128/IAI.69.12.7950-7954.2001. [DOI] [PMC free article] [PubMed] [Google Scholar]
- Dueger EL, House JK, Heithoff DM, Mahan MJ. Salmonella DNA adenine methylase mutants elicit early and late onset protective immune responses in calves. Vaccine. 2003;21:3249–3258. doi: 10.1016/s0264-410x(03)00252-4. [DOI] [PubMed] [Google Scholar]
- Erova TE, Fadl AA, Sha J, Khajanchi BK, Pillai LL, Kozlova EV, et al. Mutations within the catalytic motif of DNA adenine methyltransferase (Dam) of Aeromonas hydrophila cause the virulence of the Dam-overproducing strain to revert to that of the wild-type phenotype. Infect Immun. 2006;74:5763–5772. doi: 10.1128/IAI.00994-06. [DOI] [PMC free article] [PubMed] [Google Scholar]
- Fälker S, Schmidt MA, Heusipp G. DNA methylation in Yersinia enterocolitica: role of the DNA adenine methyltransferase in mismatch repair and regulation of virulence factors. Microbiology. 2005;151:2291–2299. doi: 10.1099/mic.0.27946-0. [DOI] [PubMed] [Google Scholar]
- Fälker S, Schmidt MA, Heusipp G. Altered Ca(2+) regulation of Yop secretion in Yersinia enterocolitica after DNA adenine methyltransferase overproduction is mediated by Clp-dependent degradation of LcrG. J Bacteriol. 2006;188:7072–7081. doi: 10.1128/JB.00583-06. [DOI] [PMC free article] [PubMed] [Google Scholar]
- Fälker S, Schilling J, Schmidt MA, Heusipp G. Overproduction of DNA adenine methyltransferase alters motility, invasion, and the lipopolysaccharide O-antigen composition of Yersinia enterocolitica. Infect Immun. 2007;75:4990–4997. doi: 10.1128/IAI.00457-07. [DOI] [PMC free article] [PubMed] [Google Scholar]
- Fetherston JD, Kirillina O, Bobrov AG, Paulley JT, Perry RD. The Yersiniabactin transport system is critical for the pathogenesis of bubonic and pneumonic plague. Infect Immun. 2010;78:2045–2052. doi: 10.1128/IAI.01236-09. [DOI] [PMC free article] [PubMed] [Google Scholar]
- Galimand M, Guiyoule A, Gerbaud G, Rasoamanana B, Chanteau S, Carniel E, et al. Multidrug resistance in Yersinia pestis mediated by a transferable plasmid. N Engl J Med. 1997;337:677–681. doi: 10.1056/NEJM199709043371004. [DOI] [PubMed] [Google Scholar]
- Gao H, Zhou D, Li Y, Guo Z, Han Y, Song Y, et al. The iron-responsive Fur regulon in Yersinia pestis. J Bacteriol. 2008;190:3063–3075. doi: 10.1128/JB.01910-07. [DOI] [PMC free article] [PubMed] [Google Scholar]
- Garcia-del Portillo F, Pucciarelli MG, Casadesus J. DNA adenine methylase mutants of Salmonella typhimurium show defects in protein secretion, cell invasion, and M cell cytotoxicity. Proc Natl Acad Sci U S A. 1999;96:11578–11583. doi: 10.1073/pnas.96.20.11578. [DOI] [PMC free article] [PubMed] [Google Scholar]
- Geier GE, Modrich P. Recognition sequence of the Dam methylase of Escherichia coli K12 and mode of cleavage of Dpn I endonuclease. J Biol Chem. 1979;254:1408–1413. [PubMed] [Google Scholar]
- Giacomodonato MnN, Sarnacki SH, Llana MN, García Cattaneo AS, Uzzau S, Rubino S, et al. Impaired synthesis and secretion of SopA in Salmonella Typhimurium dam mutants. FEMS Microbiol Lett. 2009;292:71–77. doi: 10.1111/j.1574-6968.2008.01473.x. [DOI] [PubMed] [Google Scholar]
- Guiyoule A, Gerbaud G, Buchrieser C, Galimand M, Rahalison L, Chanteau S, et al. Transferable plasmid-mediated resistance to streptomycin in a clinical isolate of Yersinia pestis. Emerg Infect Dis. 2001;7:43–48. doi: 10.3201/eid0701.010106. [DOI] [PMC free article] [PubMed] [Google Scholar]
- Haagmans W, van der Woude M. Phase variation of Ag43 in Escherichia coli: dam-dependent methylation abrogates OxyR binding and OxyR-mediated repression of transcription. Mol Microbiol. 2000;35:877–887. doi: 10.1046/j.1365-2958.2000.01762.x. [DOI] [PubMed] [Google Scholar]
- Heithoff DM, Sinsheimer RL, Low DA, Mahan MJ. An essential role for DNA adenine methylation in bacterial virulence. Science. 1999;284:967–970. doi: 10.1126/science.284.5416.967. [DOI] [PubMed] [Google Scholar]
- Horton JR, Liebert K, Bekes M, Jeltsch A, Cheng X. Structure and substrate recognition of the Escherichia coli DNA adenine methyltransferase. J Mol Biol. 2006;358:559–570. doi: 10.1016/j.jmb.2006.02.028. [DOI] [PMC free article] [PubMed] [Google Scholar]
- Inglesby TV, Dennis DT, Henderson DA, Bartlett JG, Ascher MS, Eitzen E, et al. Plague as a biological weapon – medical and public health management. JAMA. 2000;283:2281–2290. doi: 10.1001/jama.283.17.2281. [DOI] [PubMed] [Google Scholar]
- Julio SM, Heithoff DM, Provenzano D, Klose KE, Sinsheimer RL, Low DA, et al. DNA adenine methylase is essential for viability and plays a role in the pathogenesis of Yersinia pseudotuberculosis and Vibrio cholerae. Infect Immun. 2001;69:7610–7615. doi: 10.1128/IAI.69.12.7610-7615.2001. [DOI] [PMC free article] [PubMed] [Google Scholar]
- Julio SM, Heithoff DM, Sinsheimer RL, Low DA, Mahan MJ. DNA adenine methylase overproduction in Yersinia pseudotuberculosis alters YopE expression and secretion and host immune responses to infection. Infect Immun. 2002;70:1006–1009. doi: 10.1128/IAI.70.2.1006-1009.2002. [DOI] [PMC free article] [PubMed] [Google Scholar]
- Kenakin TP. Pharmalogic Analysis of Drug-Receptor Interactions. Raven: New York; 1987. [Google Scholar]
- Kim H, Cardellina JH, II, Akee R, Champoux JJ, Stivers JT. Arylstibonic acids: novel inhibitors and activators of human topoisomerase IB. Bioorg Chem. 2008;36:190–197. doi: 10.1016/j.bioorg.2008.04.001. [DOI] [PMC free article] [PubMed] [Google Scholar]
- Krissinel E, Henrick K. Inference of macromolecular assemblies from crystalline state. J Mol Biol. 2007;372:774–797. doi: 10.1016/j.jmb.2007.05.022. [DOI] [PubMed] [Google Scholar]
- Lacks S, Greenberg B. A deoxyribonuclease of Diplococcus pneumoniae specific for methylated DNA. J Biol Chem. 1975;250:4060–4066. [PubMed] [Google Scholar]
- Lopez-Garrido J, Casadesus J. Regulation of Salmonella enterica Pathogenicity Island 1 by DNA adenine methylation. Genetics. 2010;184:637–649. doi: 10.1534/genetics.109.108985. [DOI] [PMC free article] [PubMed] [Google Scholar]
- Low DA, Casadesús J. Clocks and switches: bacterial gene regulation by DNA adenine methylation. Curr Opin Microbiol. 2008;11:106–112. doi: 10.1016/j.mib.2008.02.012. [DOI] [PubMed] [Google Scholar]
- Mashhoon N, Carroll M, Pruss C, Eberhard J, Ishikawa S, Estabrook RA, et al. Functional characterization of Escherichia coli DNA adenine methyltransferase, a novel target for antibiotics. J Biol Chem. 2004;279:52075–52081. doi: 10.1074/jbc.M408182200. [DOI] [PubMed] [Google Scholar]
- Parkhill J, Wren BW, Thomson NR, Titball RW, Holden MTG, Prentice MB, et al. Genome sequence of Yersinia pestis, the causative agent of plague. Nature. 2001;413:523–527. doi: 10.1038/35097083. [DOI] [PubMed] [Google Scholar]
- Prentice MB. Plague: Yersinia pestis. In: Warrell DA, Cox TM, Firth JD, editors. Oxford Textbook of Medicine. Oxford: Oxford University Press; 2010. pp. 772–775. [Google Scholar]
- Rishi V, Oh WJ, Heyerdahl SL, Zhao J, Scudiero D, Shoemaker RH, et al. 12 arylstibonic acids that inhibit the DNA binding of five B-ZIP dimers. J Struct Biol. 2010;170:216–225. doi: 10.1016/j.jsb.2010.02.013. [DOI] [PMC free article] [PubMed] [Google Scholar]
- Robinson VL, Oyston PCF, Titball RW. A dam mutant of Yersinia pestis is attenuated and induces protection against plague. FEMS Microbiol Lett. 2005;252:251–256. doi: 10.1016/j.femsle.2005.09.001. [DOI] [PubMed] [Google Scholar]
- Roehrl MHA, Wang JY, Wagner G. A general framework for development and data analysis of competitive high-throughput screens for small-molecule inhibitors of protein-protein interactions by fluorescence polarization. Biochemistry. 2004;43:16056–16066. doi: 10.1021/bi048233g. [DOI] [PubMed] [Google Scholar]
- Sarnacki SH, Marolda CL, Llana MN, Giacomodonato MN, Valvano MA, Cerquetti MC. Dam methylation controls O-antigen chain length in Salmonella enterica serovar Enteritidis by regulating the expression of Wzz protein. J Bacteriol. 2009;191:6694–6700. doi: 10.1128/JB.00839-09. [DOI] [PMC free article] [PubMed] [Google Scholar]
- Seiple LA, Cardellina JH, Akee R, Stivers JT. Potent inhibition of human apurinic/apyrimidinic endonuclease 1 by arylstibonic acids. Mol Pharmacol. 2008;73:669–677. doi: 10.1124/mol.107.042622. [DOI] [PMC free article] [PubMed] [Google Scholar]
- Simmons KJ, Chopra I, Fishwick CWG. Structure-based discovery of antibacterial drugs. Nat Rev Microbiol. 2010;8:501–510. doi: 10.1038/nrmicro2349. [DOI] [PubMed] [Google Scholar]
- Stefanidou M, Maravelias C, Dona A, Spiliopoulou C. Zinc: a multipurpose trace element. Arch Toxicol. 2006;80:1–9. doi: 10.1007/s00204-005-0009-5. [DOI] [PubMed] [Google Scholar]
- Taylor VL, Titball RW, Oyston PCF. Oral immunization with a dam mutant of Yersinia pseudotuberculosis protects against plague. Microbiology. 2005;151:1919–1926. doi: 10.1099/mic.0.27959-0. [DOI] [PubMed] [Google Scholar]
- Watson ME, Jarisch J, Smith AL. Inactivation of deoxyadenosine methyltransferase (dam) attenuates Haemophilus influenzae virulence. Mol Microbiol. 2004;53:651–664. doi: 10.1111/j.1365-2958.2004.04140.x. [DOI] [PubMed] [Google Scholar]
- Weislow OS, Kiser R, Fine DL, Bader J, Shoemaker RH, Boyd MR. New soluble-formazan assay for HIV-1 cytopathic effects: application to high-flux screening of synthetic and natural products for AIDS-antiviral activity. J Natl Cancer Inst. 1989;81:577–586. doi: 10.1093/jnci/81.8.577. [DOI] [PubMed] [Google Scholar]
- Wion D, Casadesús J. N6-methyl-adenine: an epigenetic signal for DNA-protein interactions. Nat Rev Micro. 2006;4:183–192. doi: 10.1038/nrmicro1350. [DOI] [PMC free article] [PubMed] [Google Scholar]
- Wood RJ, Maynard-Smith MD, Robinson VL, Oyston PCF, Titball RW, Roach PL. Kinetic analysis of Yersinia pestis DNA adenine methyltransferase activity using a hemimethylated molecular break light oligonucleotide. Plos ONE. 2007;2:e801. doi: 10.1371/journal.pone.0000801. [DOI] [PMC free article] [PubMed] [Google Scholar]
- Zhang JH, Chung TDY, Oldenburg KR. A simple statistical parameter for use in evaluation and validation of high throughput screening assays. J Biomol Screen. 1999;4:67–73. doi: 10.1177/108705719900400206. [DOI] [PubMed] [Google Scholar]
Associated Data
This section collects any data citations, data availability statements, or supplementary materials included in this article.