Abstract
Glyceryl prostaglandins (PG-Gs) are generated by the oxygenation of the endocannabinoid, 2-arachidonylglycerol, by cyclooxygenase 2. The biological consequences of this selective oxygenation are uncertain because the cellular activities of PG-Gs have yet to be defined. We report that the glyceryl ester of PGE2, PGE2-G, triggers rapid, concentration-dependent Ca2+ accumulation in a murine macrophage-like cell line, RAW264.7. Ca2+ mobilization is not observed after addition of PGE2, PGD2-G, or PGF2α-G but is observed after addition of PGF2α. Moreover, PGE2-G, but not PGE2, stimulates a rapid but transient increase in the levels of inositol 1,4,5-trisphosphate (IP3) as well as the membrane association and activation of PKC. PGE2-G induces a concentration-dependent increase in the levels of phosphorylated extracellular signal regulated kinases 1 and 2 through a pathway that requires the activities of PKC, IP3 receptor, and phospholipase C β. The results indicate that PGE2-G triggers Ca2+ mobilization, IP3 synthesis, and activation of PKC in RAW264.7 macrophage cells at low concentrations. These responses are independent of the hydrolysis of PGE2-G to PGE2.
Prostaglandin (PG) synthesis involves the oxygenation of arachidonic acid by the constitutive enzyme, cyclooxygenase 1 (COX-1), or the inducible enzyme, COX-2, to generate the hydroxy-endoperoxide, PGH2. PGH2 is converted to PGE2, PGD2, PGF2α, thromboxane A2 (TxA2), and prostacyclin (PGI2) (1). It was demonstrated recently that neutral arachidonate derivatives [e.g., arachidonylethanolamide, 2-arachidonylglycerol (2-AG), and N-arachidonylglycine] are selective substrates for COX-2 (2). Kinetic analyses suggest that 2-AG is the best of these substrates for COX-2 and is equivalent to arachidonic acid in kcat/Km (3). 2-AG is oxygenated to the glyceryl ester of PGH2, PGH2-G, which is converted enzymatically to PGE2-G, PGD2-G, PGF2α-G, or PGI2-G (4).
The biological consequences of this function of COX-2 are not known. The possibility that PG-Gs exert a range of effects independent of their conversion to classical PGs is attractive but untested. We report here that PGE2-G mobilizes Ca2+ in a concentration-dependent manner and triggers downstream signaling by activating PKC in RAW264.7 cells. Under comparable conditions, PGE2 exerts neither Ca2+ mobilization nor PKC activation. PGE2-G does not compete effectively for binding to ectopically expressed prostanoid receptors and is not hydrolyzed to PGE2. Thus, its effects are independent of conversion to PGE2 and do not appear to be mediated by PGE2 receptors present on RAW cells.
Experimental Procedures
Cell Culture. RAW264.7 murine macrophage-like cells, passages 6–14, were grown in high-glucose DMEM (Invitrogen) and 10% heat-inactivated FBS. Stock cultures were maintained at no more than 60% confluency.
Assessment of PGE2-G Stability. RAW264.7 cells (2 × 10⁵ cells) were treated in serum-free medium with vehicle or indicated concentrations of PGE2-G or PGE2. Medium was assayed for PGE2 by gas chromatography/negative ion chemical ionization MS as described (5). All PGs were purchased from Cayman Chemical (Ann Arbor, MI). PG-Gs were synthesized as described (3).
Affinity of PGE2-G for PG Receptors. Membrane fractions from HEK 293 cells stably overexpressing EP1–4, DP, FP, TP, and IP prostanoid receptors were analyzed in the presence or absence of cold PGE2-G for 3H-PGE2 binding, as described (6). Binding constants were determined based on displacement curves obtained with the various ligands and the competitor, PGE2-G.
Measurement of PKC Activity. RAW264.7 cells (5 × 10⁶ cells) were treated in serum-free medium with vehicle, ionomycin in the presence of phorbol 12-myristate 13-acetate (PMA), various concentrations of PGE2-G or PGF2α, thapsigargin, or PGE2 for 5 min. In cases where the PKC inhibitor, calphostin (Calbiochem), was used, a 15-min preincubation with the inhibitor preceded PG or PG-G treatment. Cells were scraped in PBS (GIBCO/BRL), pelleted, resuspended, and homogenized with 10 strokes of a Teflon-coated Dounce homogenizer in 1 ml of buffer A [20 mM Hepes/250 mM sucrose/150 mM NaCl/0.5 mM EGTA/0.5 mM EDTA/1 mM DTT/1 mM PMSF/200 μM sodium orthovanadate/10 mM sodium fluoride (pH 7.4)]. Homogenates were centrifuged at 55,000 × g. Activity of PKC was measured in the pelleted membrane fraction by using a PKC assay kit (Calbiochem) according to the manufacturer's instructions. Specific activity of PKC in membranes was calculated as pmol of phosphate per minute per sample amount. Fold increases were calculated by using the value obtained from vehicle-treated samples.
Western Blot Assay. RAW264.7 cells were treated for 15 min with vehicle, ionomycin/PMA, or various concentrations of PGE2-G or 50 nM PGF2α. In cases where kinase inhibitors (Calbiochem) were used, cells were preincubated with the inhibitor for 15 min before PG treatment. After treatment, cells were lysed in 20 mM Tris·Cl, 150 mM NaCl, 0.2 mM EDTA, 1% Nonidet P-40, 0.5% SDS, 0.5% sodium deoxycholate, 1 mM DTT, and 0.1 mM PMSF (pH 7.4). Equal amounts (30 μg of protein) of lysate were electrophoresed on 8% SDS-polyacrylamide gels and transferred to poly(vinylidene difluoride) membranes. Membranes were blocked with 5% Blotto (Santa Cruz Biotechnology), probed with anti-phospho-p42/phospho-p44-antibody (Cell Signaling Technology, Beverly, MA), diluted 1:1,000 times in 1% BSA, and stained with anti-rabbit secondary antibody. Blots were washed, treated with chemiluminescence detection reagent (ECL, Amersham Biosciences) according to the manufacturer's protocol, and exposed to film. Blots were stripped with 62.5 mM Tris·Cl (pH 6.8), 2% SDS, and 100 mM 2-mercaptoethanol for 30 min at 50°C, washed twice for 15 min in PBS (pH 7.4), blocked for 1 h in 5% Blotto, and reprobed with anti-p42 antibody (Cell Signaling Technology) diluted 1:2,000 in 5% BSA.
Fluorescence Imaging by Fluo-4-AM. RAW264.7 cells were plated on 35-mm poly(D)-lysine-coated MatTek dishes (MatTek, Ash-land, MA). Cells were loaded with 0.5 μM Fluo-4-AM, 0.01% Pluronic F127 (Molecular Probes), and 2.5 mM probenecid (Sigma-Aldrich) in serum-free DMEM for 40 min at 37°C, washed three times, and incubated in modified Tyrode's solution [150 mM NaCl/6 mM KCl/1.5 mM CaCl2/1 mM MgCl2/10 mM glucose/10 mM Hepes (pH 7.4)] containing 2.5 mM probenecid for 30 min. Cells received 1.75 ml of Tyrode's solution containing 2.5 mM probenecid, followed by addition of the test compound dissolved in 0.25 ml of Tyrode's solution. The addition of 2.5 mM probenecid during loading prevented rapid excretion of the fluorophore into the extracellular medium (7). The final concentration of DMSO in the experiment was 0.1%. Fluorescence microscopy was performed on a Leica DM-IRB inverted microscope (Wetzlar, Germany) by using an Omega bandpass XF100 filter suited for Fluo-4 and a 40×/0.55 N Plan objective. Multiple exposures (0.53 s, 04 gain) of the field were captured manually as a time course with a charge-coupled device camera (C5810, Hamamatsu, Hamamatsu City, Japan).
Fluorescence Measurement by FlexStation. RAW264.7 cells, seeded overnight in a 96-well assay plate, were loaded for 60 min at 37°C in 200 μl of Calcium 3 Reagent (Explorer Kit, Molecular Devices) dissolved in Tyrode's solution with 2.5 mM probenecid. Solutions of PGE2-G (100×), prepared in DMSO, were diluted 1:20 in 96-well compound plates containing HBSS. Programmed transfer of 50 μl of test compound to the assay plate occurred at 20 s in the FlexStation II instrument (Molecular Devices). Samples were excited at 488 nm, and emission spectra were recorded at 525 nm by using softmax pro v.2 software (Molecular Devices). Data were analyzed, and EC50 values were calculated by using prism v.3 software (GraphPad, San Diego).
Measurement of Intracellular IP3. RAW264.7 cells at 50% confluency were transferred to serum-free DMEM for 2 h before addition of DMSO or ligand (in DMSO) for 30 s or various time-points of PGE2-G treatment. The final concentration of DMSO was 0.1%. Cell extracts were prepared, and IP3 concentrations were measured with a commercially available IP3 assay kit (Biotrak TRK 1000, Amersham Pharmacia) according to the recommended protocol.
Reporter Gene Assays. RAW264.7 cells (2 × 10⁵) were cotransfected overnight with 0.4 μg per well of an serum response element (SRE)-driven luciferase reporter construct and a cytomegalovirus (CMV) promoter-driven Renilla luciferase construct (Clontech). Cells were grown in serum-free medium 24 h before a 6-h treatment with either vehicle or PGE2-G. Cell lysates were processed by using the Dual Luciferase Assay kit (Promega) according to the manufacturer's protocol. Relative light unit (RLU) values from SRE-driven luciferase expression were normalized to those obtained from CMV-driven Renilla luciferase expression. Fold induction was calculated as the increase of RLU over vehicle control.
Results
The RAW264.7 murine macrophage-like cell line is an attractive choice as a model system to examine the biological activities of PG-Gs because it has been widely used to evaluate PG biochemistry and metabolism and because unstimulated RAW264.7 cells generate very low basal levels of PGs (8). Thus, it is convenient to assay biological activities of exogenously added PGs.
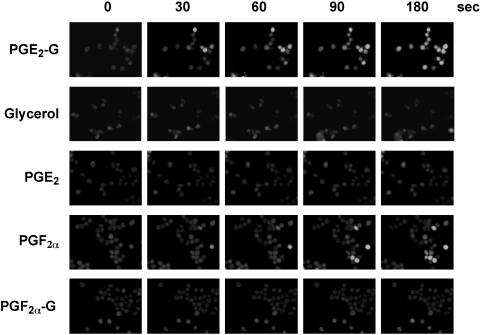
PGE2-G Increases Cytosolic Ca2+ Levels in RAW264.7 Cells. As a first step toward elucidating potential biological roles for glyceryl PGs, we examined whether PGE2-G had any effect on the cytosolic levels of the second messenger, Ca2+. To detect changes in intracellular Ca2+ levels, the indicator of choice was Fluo-4, which has high fluorescence excitation at 488 nm, high signal levels for cell imaging, and high affinity for Ca2+, making it suitable for detecting intracellular Ca2+ levels in the 250 nM to 1.4 μM range. RAW264.7 cells were loaded with Fluo-4-AM in the presence of 2.5 mM probenecid. This concentration of probenecid was essential for optimum retention of Fluo-4, as well as low variability in load and high signal-to-noise ratios. Cells were treated with vehicle, glycerol, or various PGs and PG-Gs, and images were captured on a Leica DM-IRB microscope at different time points over 3 min. A representative panel of images from three independent experiments is presented in Fig. 1. The change in fluorescence intensity with PGE2-G treatment was discernible as early as 30 s, peaked at 90 s, and persisted for 3 min. Similar results were obtained with the physiological ligand, PGF2α, which is known to bind the FP receptor and mobilize Ca2+ from intracellular stores (9–11). The two potential hydrolysis products of PGE2-G, glycerol and PGE2, did not elevate Ca2+ levels at concentrations up to 1 μM. Likewise, two other glycerol esters, PGD2-G (not shown) and PGF2α-G, had no effect on Ca2+ levels. The inability of PGE2 to elevate Ca2+ is consistent with findings from several groups that RAW264.7 cells contain EP2 and EP4 receptors (which elevate cAMP) but not EP1 or EP3 (which elevate Ca2+ and decrease cAMP, respectively) (12–14).
Fig. 1.
PGE2-G induces Ca2+ mobilization in RAW264.7 cells. RAW264.7 cells were loaded with 0.5 μM Fluo-4-AM and transferred to Tyrode's solution containing 2.5 mM probenecid, as described in Experimental Procedures. The cells were then treated with 50 nM glycerol, PGE2-G, PGE2, PGF2α, or PGF2α-G, and images were acquired at the indicated times. The experiment was performed three times in duplicate. The data presented are from a typical experiment.
PGE2-G Triggers Ca2+ Release in a Concentration-Dependent Manner. The kinetics of calcium release in response to a wide concentration range of PGE2-G was measured by using the FlexStation II instrument. To validate the experiment, we tested the effect of PGF2α on A7r5 rat aorta cells, which contain FP receptors specific to PGF2α. The EC50 value for PGF2α-induced Ca2+ release was 15.5 nM (SEM = 1.4 nM, n = 8; Fig. 8, which is published as supporting information on the PNAS web site), a nearly identical value to that obtained by Kelly et al. (15). PGE2-G had no effect on cytosolic levels of Ca2+ in A7r5 cells.
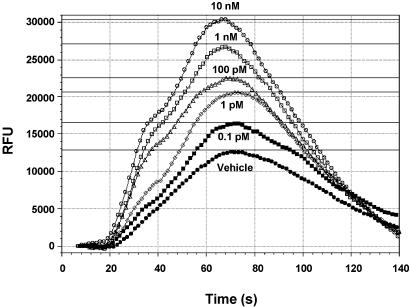
RAW264.7 cells were loaded with the Calcium 3 reagent in the presence of 2.5 mM probenecid. PGE2-G in the concentration range of 0.1 pM to 10 μM was applied robotically at 20 s, and fluorescence was measured at 1.52-s intervals over a 3-min period. A typical experiment presented in Fig. 2 shows that PGE2-G induced a robust concentration-dependent increase in cytosolic Ca2+. The cytosolic levels of Ca2+ peaked at 40–50 s of PGE2-G application and returned to basal levels by 120 s. The EC50 of PGE2-G induced calcium release was 1.0 pM (SEM = 0.1 pM, n = 8). PGF2α induced a concentration-dependent increase in cytosolic Ca2+ in RAW264.7 cells with a similar EC50 value in the pM range (data not shown).
Fig. 2.
PGE2-G induces a concentration-dependent release of Ca2+. RAW264.7 cells were loaded with Calcium 3 reagent in the presence of 2.5 mM probenecid, as described in Experimental Procedures. PGE2-G in the concentration range of 0.1 pM to 10 μM was applied robotically at 20 s, and fluorescence was measured at 1.52-s intervals over a 3-min period. Samples were excited at 488 nm, and emission spectra were recorded at 525 nm by using softmax pro v.2. The experiment was performed at least three times with multiple replicates. The data shown are from a typical experiment. RFU, relative fluorescence units.
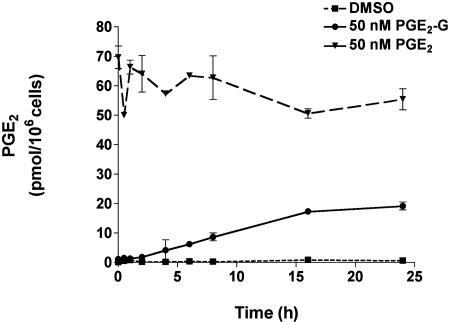
PGE2-G Stability in the RAW264.7 Macrophage Cell Line. The stability of PGE2 and PGE2-G in the presence of RAW264.7 cells was evaluated. RAW264.7 cells were treated with vehicle, 50 nM PGE2, or 50 nM PGE2-G, and the rate of conversion of PGE2-G to PGE2 was assessed by measuring the amount of free-acid generated in the medium at various time-points during a 24-h period. Media from cells treated with vehicle alone had low basal levels of PGE2 (Fig. 3). In PGE2-treated cells, levels of PGE2 in the medium remained relatively unchanged over the duration of the experiment. In PGE2-G-treated samples, levels of PGE2 were barely detectable at time points within the first 2 h of PGE2-G treatment. Furthermore, medium recovered at8hafterPGE2-G treatment contained only 7 pmol of PGE2. The data indicate that PGE2-G is stable to hydrolysis in the presence of RAW264.7 cells and that hydrolytic processes are unlikely to generate significant levels of PGE2 in the 3-min time frame of the Ca2+ mobilization experiments.
Fig. 3.
PGE2-G is not converted to PGE2 in cultures of RAW264.7 cells. RAW264.7 cells were treated with DMSO (dashed line), 50 nM PGE2-G (solid line), or 50 nM PGE2 (broken line). Medium was withdrawn at different time points, and PGE2 in the medium was quantified by GC/MS as described (5). Values obtained with vehicle control represented basal PGE2 levels. Sample treatments from a single experiment performed in triplicate are plotted as pmol of PGE2 per 106 cells vs. time. Error bars represent standard deviation in samples from a single experiment performed in triplicate. The experiment was performed twice with similar results.
PGE2-G Does Not Bind Prostanoid Receptors. The structural similarity of PGE2 and PGE2-G raises the possibility that PGE2-G may bind EP receptors. We examined whether PGE2-G competed with the binding of free-acid PGs to the EP, DP, FP, IP, and TP receptors. Membrane fractions from HEK 293 cells overexpressing the individual prostanoid receptors were analyzed for 3H-radioligand binding in the presence or absence of cold PGE2-G. The results are summarized in Table 1. PGE2-G exhibited no binding to TP, IP, DP, or FP receptor and bound the EP1 and EP3 receptors with an affinity that was two orders of magnitude lower than that of PGE2. The affinity of PGE2-G for the EP4 receptor was still lower and no binding to the EP2 receptor was detectable. The data indicate that PGE2-G does not exhibit appreciable binding to any of the known prostanoid receptors—in particular, to those known to mobilize intracellular Ca2+ (EP1, EP3, and FP).
Table 1. Binding of PGE2 and PGE2-G to prostanoid receptors.
| EP1 | EP2 | EP3 | EP4 | DP | TP | FP | IP | |
|---|---|---|---|---|---|---|---|---|
| PGE2-G | 979 | >19,800 | 378 | 737 | 13,300 | >22,300 | 16,700 | >20,600 |
| PGE2 | 10.1 | 0.82 | 0.7 | 0.7 | (307) | (29,000) | (119) | (>100,000) |
Membrane fractions from HEK 293 cells stably overexpressing EP1-4, DP, FP, TP, and IP receptors were analyzed for 3H-PGE2 binding in the presence or absence of cold PGE2-G. The values in parentheses are for comparison and are taken from an identical assay performed by Abramovitz et al. (6).
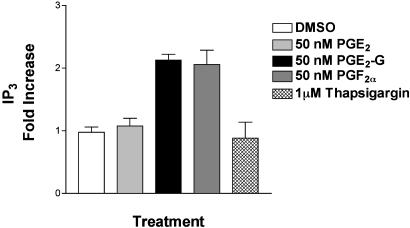
PGE2-G Induces Increases in IP3 Levels in RAW264.7 Cells. The release of Ca2+ from intracellular stores is mediated by several mechanisms. One of these involves the binding of IP3 to IP3 receptors in the endoplasmic reticulum of stimulated cells (16, 17). Therefore, RAW264.7 cells were treated with 50 nM PGE2-G and at various time points, lysed, and processed for measurement of IP3 (Fig. 9, which is published as supporting information on the PNAS web site). IP3 levels rose 2.2-fold in 30–60 s, then returned to basal levels by 90 s. TMB-8, an inhibitor of IP3 receptor, blocked PGE2-G-induced calcium accumulation (Fig. 10, which is published as supporting information on the PNAS web site). Neither PGE2 nor thapsigargin had any effect on IP3 levels, but an increase of ≈2-fold was observed 30 s after treatment with PGF2a (Fig. 4). The inability of PGE2 to elevate IP3 or Ca2+ levels is consistent with reports that RAW264.7 cells lack the calcium-coupled EP1 and EP3 receptors (12–14). The lack of an effect with thapsigargin is consistent with reports that it increases cytosolic Ca2+ levels in a phospholipase C- and IP3-independent fashion, primarily by inhibiting SERCA (sarcoendoplasmic reticulum Ca2+ re-uptake) pumps (18, 19). Because of the low dynamic range of this assay, it was not possible to assess the concentration dependence of the PGE2-G effect.
Fig. 4.
PGE2-G increases the levels of inositol 1,4,5-trisphosphate (IP3). IP3 levels in lysates of cells treated with 50 nM PGE2-G, 50 nM PGE2, 50 nM PGF2α, or 1 μM thapsigargin were measured. Results from a typical experiment are shown. Error bars represent standard deviation in triplicate samples of a single experiment.
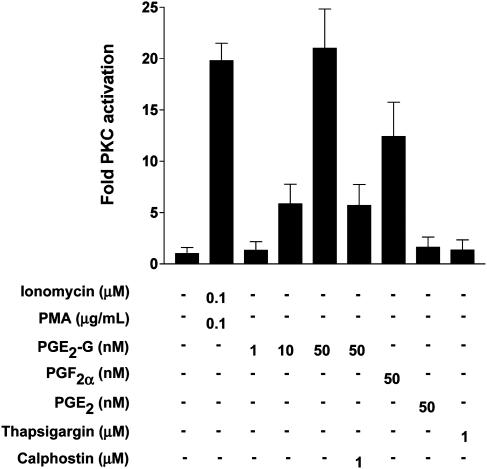
PGE2-G Induces Increases in PKC Activity in RAW264.7 Cells. In addition to IP3, the other byproduct of PIP2 hydrolysis is diacylglycerol (DAG). One of the targets activated by DAG is PKC, which on activation by Ca2+ and DAG translocates to the plasma membrane. Because PGE2-G induced IP3 and cytosolic Ca2+ levels, we considered the possibility that PGE2-G might activate PKC. RAW264.7 cells were treated for 5 min with vehicle, PGE2-G, PGF2α, or ionomycin in the presence of the PKC activator, PMA. After treatment, cells were harvested and lysed, and PKC activity in the membrane fraction was measured as described in Experimental Procedures. PGE2-G induced a concentration-dependent increase in PKC activity up to 21-fold at 50 nM (Fig. 5). This was comparable to the extent of the activation observed with ionomycin and PMA and was completely blocked by the PKC inhibitor, calphostin. Neither PGE2 (50 nM) nor thapsigargin (1 μM) increased PKC activity. However, treatment with 50 nM PGF2a led to a 12-fold increase in PKC activity.
Fig. 5.
PGE2-G induces the activity of PKC in RAW264.7 membrane fractions. RAW264.7 cells were treated for 5 min with vehicle, 0.1 μM ionomycin/0.1 μg/ml PMA, 1, 10, or 50 nM PGE2-G, 50 nM PGF2α, 50 nM PGE2, or 1 μM thapsigargin. Cells were lysed, and PKC activity in membrane fractions was measured as described in Experimental Procedures. The experiment was performed at least five times in duplicate. Results shown are from a typical experiment. Error bars represent the range in duplicate samples of a single experiment.
PGE2-G Induces Increases in Extracellular-Signal-Regulated Kinase (ERK) Phosphorylation in a PKC-Dependent Manner. One of the pathways that is sensitive to changes in intracellular Ca2+ levels is the ERK/mitogen-activated protein kinase (MAPK) signaling pathway (20–22).
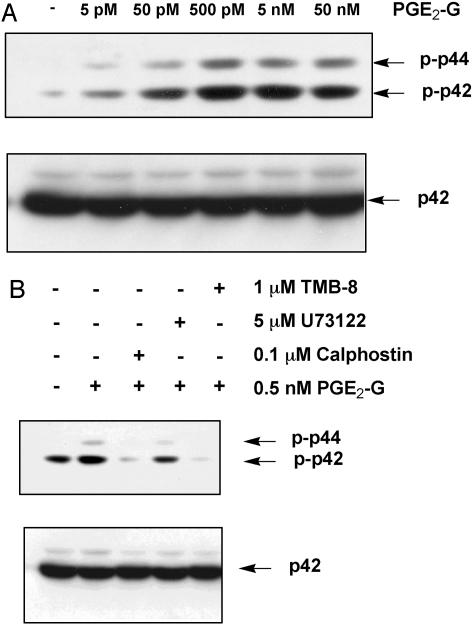
RAW264.7 cells were treated for 15 min with either vehicle or various concentrations of PGE2-G. Cell lysates were processed for Western blot analysis by using an antibody that recognizes the phosphorylated, activated forms of ERK1 and ERK2. Results of a typical experiment are shown in Fig. 6A. Treatment with PGE2-G induced a concentration-dependent increase in the levels of phosphorylated p42 and p44. To determine whether PGE2-G-induced ERK phosphorylation required activities of PLCβ and IP3 as well as PKC, RAW264.7 cells were pretreated for 15 min in the presence or absence of a PLCβ inhibitor, U73122, an inhibitor of IP3-mediated Ca2+ release, TMB-8, or a PKC inhibitor, calphostin, followed by treatment with 0.5 nM PGE2-G for a further 15 min. Results in Fig. 6B show that the PGE2-G-mediated induction of ERK1/2 phosphorylation was abrogated by all three inhibitors, underscoring the requirement of PKC and IP3, as well as PLCβ, for ERK activation.
Fig. 6.
PGE2-G induces the activity of ERK in a PKC-dependent manner. RAW264.7 cells were treated for 15 min with vehicle or the indicated concentrations of PGE2-G. Equal amounts (30 μg) of lysate were resolved by SDS/PAGE on 8% gels, and the protein was transferred to poly(vinylidene difluoride) membranes. Membranes were processed for Western blot analysis with an antibody that recognized the phosphorylated forms of p44 (ERK1) and p42 (ERK2) (Upper). Membranes were stripped and reprobed with an antibody that bound modified and unmodified forms of p42. Arrows indicate relative mobility of phospho-p42 and phospho-p44 or p42. (A) Cells received PGE2-G within a concentration range of 5 pM to 50 nM. (B) Cells were pretreated for 15 min with 0.1 μM calphostin, 5 μM U73122, or 1 μM TMB-8 before a 15-min incubation with 0.5 nM PGE2-G. The results shown are from a typical experiment.
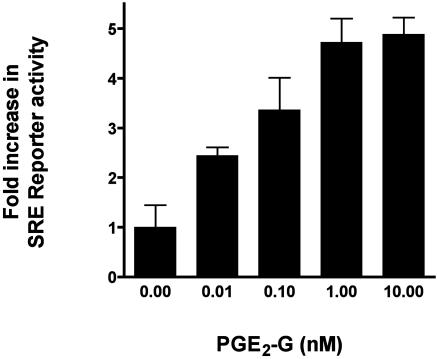
Phosphorylated ERK positively regulates the transcription factor Elk-1, a member of the Ets family of transcriptional regulators. Elk-1 associates with the serum responsive factor, SRF, and activates transcription through the SRE. Because PGE2-G induced the levels of phosphorylated ERK, the effect of PGE2-G on the expression of a SRE-driven luciferase reporter gene was examined. RAW264.7 cells were transfected with luciferase reporter constructs under the control of the SRE and then treated with 10 pM to 10 nM of PGE2-G. Lysates were assayed for luciferase activity. Results of a representative experiment are shown in Fig. 7. PGE2-G induced up to a 4.4-fold induction of SRE reporter activity in a concentration-dependent manner with an EC50 value of ≈30 pM.
Fig. 7.
PGE2-G induces SRE.Luciferase reporter expression in a concentration-dependent manner. RAW264.7 cells were transfected with 0.2 μg each of SRE.Luciferase and CMV.Renilla luciferase constructs, grown for 48 h in serum-free medium, and treated with indicated concentrations of PGE2-G for 5 h. Relative luciferase activity from lysates was measured and plotted as a function of agonist concentration. Shown is a representative of three independent experiments performed in triplicate. Error bars represent standard deviations obtained from triplicate values from a single experiment.
Discussion
Glyceryl PGs represent a structurally distinct class of PGs that are derived from COX-2-selective oxygenation of the endocannabinoid, 2-AG. The data presented here provide evidence that PGE2-G, at low nM concentrations, induces a striking increase in the intracellular levels of free Ca2+ in RAW264.7 cells with kinetics typical of a physiological ligand. Neither of the two potential byproducts of PGE2-G hydrolysis, glycerol or PGE2, elicits such a response in RAW264.7 cells. Among the glyceryl PGs tested, PGE2-G was unique in inducing Ca2+ mobilization. PGF2α-G (Fig. 1) and PGD2-G (data not shown) failed to mobilize Ca2+ in RAW264.7 cells. Moreover, PGF2α induced intracellular Ca2+ levels as efficiently as PGE2-G (Fig. 1), although PGE2-G did not bind to the FP receptors (Table 1).
The release of Ca2+ from intracellular stores is controlled by various channels, of which the IP3 receptor class has been extensively studied. IP3 is generated by ligand-stimulated activation of PLC, which hydrolyzes PIP2 into two bioactive metabolites, IP3 and diacylglycerol. The data indicate that PGE2-G induces a statistically significant (P < 0.001) 2-fold increase in IP3 levels. The magnitude of IP3 induction is similar to that obtained with PGF2α (Fig. 4).
PKC is one of several downstream targets of Ca2+ mobilization; PGE2-G induces PKC activation in a concentration-dependent manner (Fig. 5). The magnitude of the increase is similar to that exhibited by the classical activators of PKC, ionomycin and PMA, or the physiological ligand, PGF2α. PKC activation is known to target a plethora of signaling cascades, one of which is the ERK/MAPK pathway. The data indicate that PGE2-G stimulates phosphorylation of ERK1/2 in a concentration-dependent manner through a process that requires PLCβ, the IP3 receptor, and PKC. PGE2-G also induces the transcriptional activity of the ERK-responsive SRE reporter in a concentration-dependent manner.
The results suggest the possibility that PGE2-G mediates Ca2+ mobilization through interaction with a unique, specific receptor. However, there are two possible alternative mechanisms by which PGE2-G may induce a Ca2+ mobilization event in RAW264.7 cells: (i) PGE2-G may signal by binding to Ca2+-coupled prostanoid receptors such as EP1, EP3, or FP receptors; (ii) PGE2-G may undergo hydrolysis to PGE2 that could trigger Ca2+ release via the EP1 or EP3 receptors. Work from other laboratories indicates that RAW264.7 cells contain only the EP2 and EP4 receptors, and we show that PGE2-G does not bind to the EP, DP, FP, TP, or IP receptors (Table 1). In addition, preliminary results from competition studies with untransfected RAW264.7 cell membranes bearing the native complement of EP receptors show that PGE2-G concentrations as high as 10 μM fail to displace bound 3H-labeled PGE2 (data not shown). At concentrations used in this study (1–50 nM), binding of PGE2-G to any of these receptors would be negligible. Therefore, the contribution of EP receptors in RAW264.7 cells to PGE2-G-mediated signaling is unlikely.
The data also show that PGE2-G does not undergo appreciable hydrolysis to PGE2 when exposed to RAW264.7 cells during the 3-min time course of our experiments (Fig. 3). Moreover, direct measurement of PGE2-G in media and cytosol of PGE2-G-treated cells by electrospray MS/MS reveals that at least 95% of PGE2-G remains intact within the first 2 h after PGE2-G treatment and is not depleted by further metabolic activity (data not shown). In addition, results from Fig. 1 show that the potential byproducts of PGE2-G hydrolysis, glycerol and PGE2, have no effect on Ca2+ mobilization in RAW264.7 cells. These data rule out the possibility that increases in Ca2+ levels observed with PGE2-G are a consequence of its hydrolysis to PGE2.
Among the glyceryl PGs tested, PGE2-G is unique in inducing a Ca2+ mobilization event in RAW264.7 cells. The evidence presented in this study suggests that PGE2-G may act through a novel receptor that can potentially discriminate between the cyclopentane rings of PGs on the one hand and the presence or absence of the glycerol moiety at the C1 position on the other.
Because 2-AG is oxygenated by COX-2, but not COX-1, the present observations raise the possibility of the existence of a COX-2-selective signal transduction pathway mediated by PG-Gs.
Supplementary Material
Acknowledgments
We thank G. O'Neill, G. Greig, A. Chateauneuf, and D. Denis for measuring the binding of PGE2-G to prostanoid receptors, and J. Putney and G. Bird for helpful suggestions and critical reading of the manuscript. We thank Dr. Jeffery Conn for assistance in FlexStation experiments. Cell imaging experiments were conducted at the Vanderbilt University Medical Center Cell Imaging Core Resource, which is supported by National Institutes of Health Grants CA 68485, DK 20593, and DK 58404. This work was supported by National Institutes of Health Research Grant CA89450 and Center Grant GM15431.
This paper was submitted directly (Track II) to the PNAS office.
Abbreviations: 2-AG, 2-arachidonylglycerol; COX, cyclooxygenase; ERK, extracellular signal-regulated kinase; IP3, inositol 1,4,5-trisphosphate; PG, prostaglandin; PG-G, PG glycerol ester or glyceryl PG; PLC, phospholipase C; PMA, phorbol 12-myristate 13-acetate; SRE, serum response element; TxA2, thromboxane A2.
References
- 1.Smith, W. L. (1992) Am. J. Physiol. 263, F181–F191. [DOI] [PubMed] [Google Scholar]
- 2.Yu, M., Ives, D. & Ramesha, C. S. (1997) J. Biol. Chem. 272, 21181–21186. [DOI] [PubMed] [Google Scholar]
- 3.Kozak, K. R., Rowlinson, S. W. & Marnett, L. J. (2000) J. Biol. Chem. 275, 33744–33749. [DOI] [PubMed] [Google Scholar]
- 4.Kozak, K. R., Crews, B. C., Morrow, J. D., Wang, L. H., Ma, Y. H., Weinander, R., Jakobsson, P. J. & Marnett, L. J. (2002) J. Biol. Chem. 277, 44877–44885. [DOI] [PubMed] [Google Scholar]
- 5.Coffey, R. J., Hawkey, C. J., Damstrup, L., Graves-Deal, R., Daniel, V. C., Dempsey, P. J., Chinery, R., Kirkland, S. C., DuBois, R. N., Jetton, T. L. & Morrow, J. D. (1997) Proc. Natl. Acad. Sci. USA 94, 657–662. [DOI] [PMC free article] [PubMed] [Google Scholar]
- 6.Abramovitz, M., Adam, M., Boie, Y., Carriere, M., Denis, D., Godbout, C., Lamontagne, S., Rochette, C., Sawyer, N., Tremblay, N. M., et al. (2000) Biochim. Biophys. Acta 1483, 285–293. [DOI] [PubMed] [Google Scholar]
- 7.Di Virgilio, F., Steinberg, T. H., Swanson, J. A. & Silverstein, S. C. (1988) J. Immunol. 140, 915–920. [PubMed] [Google Scholar]
- 8.Landino, L. M., Crews, B. C., Timmons, M. D., Morrow, J. D. & Marnett, L. J. (1996) Proc. Natl. Acad. Sci. USA 93, 15069–15074. [DOI] [PMC free article] [PubMed] [Google Scholar]
- 9.Woodward, D. F., Fairbairn, C. E., Goodrum, D. D., Krauss, A. H., Ralston, T. L. & Williams, L. S. (1991) Adv. Prostaglandin Thromboxane Leukotriene Res. 21A, 367–370. [PubMed] [Google Scholar]
- 10.Anthony, T. L., Fujino, H., Pierce, K. L., Yool, A. J. & Regan, J. W. (2002) Biochem. Pharmacol. 63, 1797–1806. [DOI] [PubMed] [Google Scholar]
- 11.Davis, J. S. (1987) Adv. Exp. Med. Biol. 219, 671–675. [DOI] [PubMed] [Google Scholar]
- 12.Hinz, B., Brune, K. & Pahl, A. (2000) Biochem. Biophys. Res. Commun. 272, 744–748. [DOI] [PubMed] [Google Scholar]
- 13.Hubbard, N. E., Lee, S., Lim, D. & Erickson, K. L. (2001) Prostaglandins Leukotriene Essent. Fatty Acids 65, 287–294. [DOI] [PubMed] [Google Scholar]
- 14.Arakawa, T., Laneuville, O., Miller, C. A., Lakkides, K. M., Wingerd, B. A., DeWitt, D. L. & Smith, W. L. (1996) J. Biol. Chem. 271, 29569–29575. [DOI] [PubMed] [Google Scholar]
- 15.Kelly, C. R., Williams, G. W. & Sharif, N. A. (2003) J. Pharmacol. Exp. Ther. 304, 238–245. [DOI] [PubMed] [Google Scholar]
- 16.Dawson, A. P. (1997) Curr. Biol. 7, R544–R547. [DOI] [PubMed] [Google Scholar]
- 17.Marchant, J. S. & Taylor, C. W. (1997) Curr. Biol. 7, 510–518. [DOI] [PubMed] [Google Scholar]
- 18.Shoback, D., Chen, T. H., Pratt, S. & Lattyak, B. (1995) J. Bone Miner. Res. 10, 743–750. [DOI] [PubMed] [Google Scholar]
- 19.Thastrup, O., Dawson, A. P., Scharff, O., Foder, B., Cullen, P. J., Drobak, B. K., Bjerrum, P. J., Christensen, S. B. & Hanley, M. R. (1994) Agents Actions 43, 187–193. [DOI] [PubMed] [Google Scholar]
- 20.Izquierdo, M., Leevers, S. J., Williams, D. H., Marshall, C. J., Weiss, A. & Cantrell, D. (1994) Eur. J. Immunol. 24, 2462–2468. [DOI] [PubMed] [Google Scholar]
- 21.Zhuang, S., Hirai, S., Mizuno, K., Suzuki, A., Akimoto, K., Izumi, Y., Yamashita, A. & Ohno, S. (1997) Biochem. Biophys. Res. Commun. 240, 273–278. [DOI] [PubMed] [Google Scholar]
- 22.Caverzasio, J., Palmer, G., Suzuki, A. & Bonjour, J. P. (2000) J. Bone Miner. Res. 15, 1697–1706. [DOI] [PubMed] [Google Scholar]
- 23.Sharif, N. A., Kelly, C. R. & Crider, J. Y. (2003) Invest. Ophthalmol. Vis. Sci. 44, 715–721. [DOI] [PubMed] [Google Scholar]
Associated Data
This section collects any data citations, data availability statements, or supplementary materials included in this article.


