

Abstract
Biological redox machines require efficient transfer of electrons and holes for function. Reactions involving multiple tunneling steps, termed “hopping,” often promote charge separation within and between proteins that is essential for energy storage and conversion. Here we show how semiclassical electron transfer theory can be extended to include hopping reactions: graphical representations (called hopping maps) of the dependence of calculated two-step reaction rate constants on driving force are employed to account for flow in a rhenium-labeled azurin mutant as well as in two structurally characterized redox enzymes, DNA photolyase and MauG. Analysis of the 35 Å radical propagation in ribonucleotide reductases using hopping maps shows that all tyrosines and tryptophans on the radical pathway likely are involved in function. We suggest that hopping maps can facilitate the design and construction of artificial photosynthetic systems for the production of fuels and other chemicals.
Keywords: Electron transfer, Multistep tunneling, Hopping maps, Redox proteins azurin, Ribonucleotide reductase, DNA photolyase, MauG
1. Introduction
Many biological redox reactions rely on charge transport over long distances. Examples include the photosynthetic systems of plants [1] and the respiratory machinery in bacteria, yeast and higher eukaryotic cells [2]. The emergence of macromolecular X-ray crystallography and ultrafast spectroscopic techniques as key biochemical tools has opened the way for investigation of ET pathways in the biomolecules that function in photosynthesis and respiration. Examination of the X-ray structures of complexes I–IV [3] and ATP synthase [4] in the mitochondrial respiratory chain [5] illustrates the complexity of the multi-step electron transfer (ET) cascade that couples O2 reduction and ATP synthesis. In both redox machines, more than 10 single ET steps take place during their catalytic cycles. Understanding the factors that control the flow of electrons and holes in these and other biomolecular systems is one of the holy grails of 21st century chemistry [6].
Electron/hole separation in biological redox machines often is achieved through multiple ET steps (hopping) with minimal losses in free energy. Hopping is especially important in the function of light harvesting biomolecules, which efficiently separate electrons/holes on millisecond or longer timescales. Our research employing protein scaffolds modified with metal-based photooxidants or photoreductants has greatly enhanced the understanding of single-step ET in proteins [7,8]. We have recently extended our work on single-step ET to protein systems where charges are transferred via two tunneling steps [9]. Herein, we present a detailed description of our two-step hopping model, and its application to natural systems.
2. Hopping maps
Semiclassical theory is the starting point for understanding single-step ET reactions in chemistry and biology [10]. The specific rate of ET (kET) between a donor (D) and an acceptor (A) (Eq. (1), kB, T and h have their usual meanings) depends on the driving force (−ΔG°), the reorganization energy (λ), the distance (r), and composition of the intervening medium between electron/hole donor and acceptor. HAB is the electronic coupling between reactant (D−|A) and product (D|A−) at the transition state. HAB is related to the distance between D and A by Eq. (2), where β is the decay constant for tunneling, r0 is the limit of contact (taken as the sum of van der Waals radii), and r is as given above. HAB(r0) is the electronic coupling matrix element at r = r0. In general, ΔG° and λ depend on D and A molecular composition and local environment, while HAB is a function of D–A distance and the structure of the intervening medium.
| (1) |
| (2) |
Eq. (1) has been extensively used to calculate single-step ET rate constants [11]. If there is an additional site between D and A that can accommodate an electron/hole as an intermediate, the overall transfer from D to A can occur in two shorter-distance (and potentially faster) tunneling steps. This two-step tunneling is referred to as “hopping”. Since each of the hopping steps obeys the ET rate dependence based on its individual values of ΔG°, λ, and r, we can calculate the two-step reaction rate and compare it to that for single-step tunneling, to see if there is a “hopping advantage.”
Two-step hopping requires three sites: the initial electron/hole donor (D), a relay station to which this electron/hole is temporarily transferred (I), and the final electron/hole acceptor (A). Oxidized or reduced I is a real intermediate that, in principle, can be detected spectroscopically. Note that our notation throughout the discussion assumes that the reaction starts from the electron/hole donor, D. It is helpful to think of these three sites together as a single system that can be described by the location of the electron/hole, as in Eqs. (3a)–(3c).
| (3a) |
| (3b) |
| (3c) |
We write the hopping reactions as follows:
| (4) |
The corresponding rate equations are given in Eqs. (4a)–(4c):
| (4a) |
| (4b) |
| (4c) |
By solving this set of differential equations, we obtain expressions for each of the concentrations as functions of time (i.e. [X](t), [Y](t), [Z](t)). To simplify the problem we assume that the initial concentrations of Y and Z are zero and use Mathematica software [12] to solve the equations. We are interested in the overall ET rate constant from D to A, therefore, the function [Z](t) is particularly useful. The expression for [Z](t) can be simplified to the following form:
| (5) |
where a, b, and c are defined as:
| (6a) |
| (6b) |
| (6c) |
Eventually we will want to compare the rates of single-step and two-step ET reactions; therefore, we write an analogous expression for [Z](t) using a single-step mechanism.
| (7a) |
| (7b) |
Solving the differential equations in the same manner as above, we arrive at the single-step expression (Eq. (8)), again assuming that [Z]0 = 0.
| (8) |
Comparison of [Z](t) functions for both mechanisms (Eqs. (5) and (8), respectively) shows that hopping is a biexponential process, while single-step tunneling is monoexponential. In order to compare these two mechanisms directly (and determine the rate advantage for hopping), we define an average ET time (τ) with units of seconds:
| (9) |
| (10) |
Substitution with [Z](t)hopping and [Z](t)tunneling functions from Eqs. (5) and (8) gives:
| (11) |
| (12) |
Hopping maps express the average ET time (τ) as a function of the driving force (–ΔG°) for the first hopping step and for the overall reaction at given values of HAB(r0), λ, β, and r. The expressions for τ in terms of rate constants (k1 through k6) can be converted to expressions in terms of ΔG° and the other ET parameters (β, λ, HAB, r). Substitution of Eq. (2) into Eq. (1) and collection of constants yield a general equation for single-step ET:
| (13) |
| (14) |
We also define expressions for the reverse rate constants (k2, k4) in terms of forward rate constants (k1, k3) by using the relationship between ΔG° and the equilibrium constant:
| (15) |
| (16) |
| (17) |
where ΔG°DI and ΔG°IA are the standard free energy changes for the first and second hopping steps, respectively, and ΔG°DA is the overall reaction free energy change. Again, this can be either an electron donor or a hole donor depending on the particular system. Substitution of Eqs. (13)–(16) into Eqs. (11) and (12) and subsequent simplification yields τ in terms of ET parameters (Eqs. (18) and (19)). These expressions have been simplified by assuming the same β, λ and HAB(r0) values for all ET reactions in the system. Substitution of ΔG°IA in Eq. (18), using Eq. (17), gives τhopping in terms of ΔG°DI and ΔG°DA.
| (18) |
| (19) |
The distances r1, r2 and rT are those between the donor and intermediate, the intermediate and acceptor and the donor and acceptor, respectively.
The dependence of τhopping on ΔG°DA and ΔG°DI can be represented graphically on a hopping map: we construct contour plots of −log10(τhopping) with −ΔG°DA as the x-axis, −ΔG°DI as the y-axis [13]. In using hopping maps, keep in mind that the ET distances are from X-ray structures and do not account for specific ET pathways [14,15]. Another issue is the paucity of reliable reduction potentials for redox cofactors in different protein environments. Our treatment of MauG in Section 4.2 shows that a hopping map defines the driving forces necessary for efficient hopping, but that rate constants cannot be predicted without knowledge of cofactor reduction potentials.
3. A two-step hopping model: ReI(His124)(Trp122)AzCuI
We constructed a hopping map to account for our observation that situating a Trp residue between a histidine-ligated rhenium(I) photosensitizer and copper(I) in Pseudomonas aeruginosa azurin, ReI(His124)(Trp122)AzCuI, accelerated ET by >102-fold over the single-step reaction [9,16]. In this model hopping system it was possible experimentally to determine all the elementary rate constants (Fig. 1).
Fig. 1.

Optical excitation of ReI(His124)(Trp122)AzCuI produces a singlet charge transfer excited state (1CT) that undergoes ~100 fs conversion to a hot triplet that relaxes on the ps timescale. The relaxed 3CT state is in equilibrium with a charge-separated state 3CS (the hopping intermediate) that undergoes CuI →Trp122•+ ET in 31 ns. Single-step back ET regenerates the ground state (3.1 μs time constant). Shown also are low-yield ultrafast forward ET steps from hot states and charge recombination from the 3CS state.
Adapted from [9].
Oxidation of CuI by electronically excited ReI (*Re) occurs in less than 50 ns in ReI(His124)(Trp122)AzCuI azurin, but CuII production was not observed in the phenylalanine-substituted variant, ReI(His124)(Phe122)AzCuI. Values of the forward and back rate constants of ET from Trp122 to *Re show that it is exergonic by 28 meV [9]. Photoreduction of the ReI chromophore also was observed by time-resolved IR spectroscopy in ReI(His124)(Trp122)AzMII azurins (M = CuII, ZnII), an observation consistent with a mechanism in which Trp122 → *Re ET is the first step in the hopping reaction [9b]. A key conclusion from this work was that hopping facilitates long-range photoinduced ET that otherwise would not compete with the decay of the *Re photoxidant. However, for exergonic intermediate formation (3CS in Fig. 1), the overall yield could be limited by competition between the second ET step and charge recombination. Finally, our analysis indicates that hopping can substantially accelerate ET provided that the intervening step is no more than ~200 meV endergonic.
The hopping map for ReI(His124)(Trp122)AzCuI (Fig. 2) shows the calculated time constant for production of Re0(His124)(Trp122)AzCuII from *ReI(His124)(Trp122)AzCuI. ET distances (r1 = 8.1 Å, r2 = 12.8 Å, rT = 19.4 Å) were taken from the crystal structure of ReI labeled azurin [9]: r1 (or r2) is the average distance from Re (or Cu) to the 9 atoms in the Trp indole ring; rT is the net Re–Cu distance [17]. The decay constant (β) is 1.1 Å−1, the reorganization energy (λ) is 0.8 eV and HAB(r0) = 190 cm−1 (24 meV); these values are from our work on ET through proteins [7,8]. The driving force for the first step (Trp122 → *Re), −ΔG°DI, is 28 meV and ΔG°DA (the difference in *Re/Re0 and AzCuII/I reduction potentials) is ~1 eV [18]. The time constant for CuII production from the hopping map (51 ns) is in excellent agreement with the experimental value (31 ns).
Fig. 2.

Hopping map for ReI(His124)(Trp122)AzCuI azurin (*Re = His124*Re(4,7-Me2 -phenanthroline)(CO)3+). The parameters used to generate the map are given in the text. The contour lines are plotted at 0.2 log unit intervals of τhopping. The black dot represents the predicted time constant based on experimental reduction potentials.
Two portions of the hopping map are shown in white; these are regions where hopping is not observed. The upper right hand corner is the region where τhopping/τtunneling > 1, in other words where hopping is predicted to be slower than single-step tunneling. The bottom left hand corner, to the left of the solid black line, is the region in which the second hopping step is endergonic, so the intermediate is an electron/hole sink. This line corresponds to −ΔG°DI = −ΔG°DA, and is the same in all maps. All non-white regions of the hopping map indicate combinations of ΔG°DA and ΔG°DI that favor hopping, and the ET time constant can be extracted from the contours. For example, the area between the two innermost contour lines corresponds to a −log(τhopping) interval of 8.0–8.2, or τhopping = 6–10 ns.
We have reported detailed investigations of hopping through position 122 (Trp, Lys, Phe, Tyr) in ReI-modified azurins [9b]. A key conclusion from that study was that π–π interaction between Re(4,7-Me2phen)(CO)3(His124) and Trp122, as well as good over-lap of energy levels of Trp and *Re, greatly contributes to the efficiency of hopping. Indeed, DFT calculations indicate that electron density propagates from Trp122 directly to *Re, as shown in Fig. 3. Such ET-promoting specific interactions can, in principle, be included in the hopping maps by increasing HDI(r0) or using a shorter effective rDI distance. Time-resolved IR spectra of the excited Re chromophore also have revealed that ET from Trp122 occurs on a timescale similar to that of the structural and solvation dynamics of Re(4,7-Me2phen)(CO)3(His124) at the protein surface. Such medium dynamics could further facilitate ET [19].
Fig. 3.

Top: electron density redistribution (relative to the ground state) in the 3CT and 3CS states of ReI(His124)(Trp122) fragment. Regions of decreased and increased electron density are shown in blue and red, respectively. Bottom: spin density distributions.
Adapted from [9b].
Although tyrosine-mediated hopping occurs in ribonucleotide reductase (RNR, see below) and other biological redox machines, the process is not observed in ReI(His124)(Tyr122)AzCuI, even though H+/e− oxidation of Tyr at pH 7 is more favorable (by 150 meV) than that for 1e− oxidation of Trp. The lack of activity in the Tyr122 protein likely is due the absence of a suitable proton acceptor near the phenolic proton [20]. Hopping also does not occur if lysine or phenylalanine is at position 122.
3.1. Effects of ET distances
Defining ET distances is problematic when aromatic amino acids are involved, because upon oxidation the electron does not necessarily come from a single atom. Also, a specific ET pathway may be operative with an “effective” ET distance [14,15]. In our treatment of ReI-labeled azurin, we used the average distance between the 9 atoms in the Trp indole and ReI or CuI in the X-ray structure (r1 = 8.1 Å, r2 = 12.8 Å, rT = 19.4 Å). As an alternative formulation, edge-to-edge or “closest” distances could be used. In this case r1 = 6.3 Å, r2 = 10.8 Å and rT = 19.4 Å (the hopping map for these distances is shown in Fig. 4). The calculated time constant for CuII formation in the modified azurin is 5 ns, which is near the observed value (31 ns) and a factor of 10 smaller than that from the original map (Fig. 2).
Fig. 4.

Hopping map for ReI(His124)(Trp122)CuI azurin (*Re = His124*Re(4,7-Me2 -phenanthroline)(CO)3+) assuming r1 = 6.3 Å, r2 = 10.8 Å and rT = 19.4 Å. The other ET parameters are the same as before (Fig. 2). The contour lines are plotted at 0.2 log unit intervals of τhopping. The black dot represents the predicted time constant based on experimental reduction potentials.
Formulations of ET distances different from the above example also can be tested. We could take the 6 indole atoms closest to ReI to calculate r1, and the 5 indole atoms closest to CuI for r2, such that r1 = 7.4 Å, r2 = 11.8 Å and rT = 19.4 Å. These distances would be consistent with the calculated HOMO of indole, as well as calculated and experimental values for the spin density on the Trp cation radical [21], and with the proposed Re-Trp122 coupling (Fig. 3) [9b]. In this case the calculated time constant for CuII production is 24 ns. Instead, picking a single atom like C3 (the carbon that attaches indole to the peptide backbone) gives a time constant of 54 ns [9], not far from that using average distances. We have found that changes of less than ±1 Å in ET distance give hopping time constants that vary at most by a factor of 10. The basic shape of the hopping region in the map changes very little with such small changes in ET distance.
4. Hopping in natural systems
ET reactions in two proteins, DNA photolyase and MauG, have been thoroughly investigated. Both proteins have also been structurally characterized. In the case of DNA photolyase, reaction driving forces are known, which will allow us to construct hopping maps. For MauG, site-directed mutagenesis studies indicate that hopping is critical to function, but ET driving forces are not known. Our hopping maps for this protein place limits on driving forces that are relevant to redox function. We also have made a hopping map for a section of the >35 Å radical chain in ribonucleotide reductase (RNR). Our hopping map predicts ET steps that likely are critical for function of this very complex molecular machine.
4.1. DNA photolyase
Cyclobutane pyrimidine dimer (CPD) DNA photolyases carry out repair of cyclobutane pyrimidine dimers in bacteria [22]. CPDs are typically thymine–thymine dimers, which have long been known to be common UV-induced DNA lesions, and are contributors to cancer in humans [23]. DNA photolyases exhibit rich ET chemistry; photogeneration of the reduced FADH− cofactor could be accomplished via long-range ET (Fig. 5), and CPD dimers are broken by reductive ET from photoexcited FADH− (Fig. 6).
Fig. 5.
Structure of A. nidulans DNA photolyase highlighting the three-Trp “wire” that may be responsible for enzyme activation (PDB ID 1TEZ [30]).
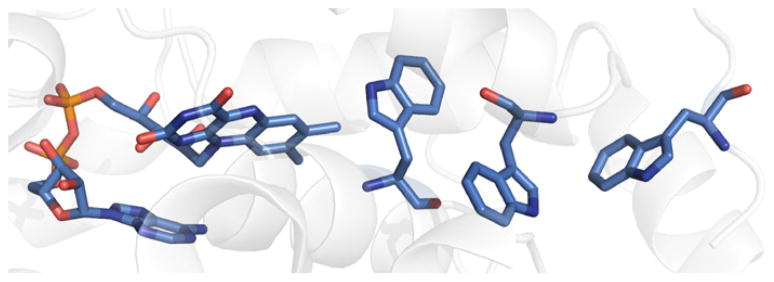
Fig. 6.

Structure of A. nidulans DNA photolyase complexed with DNA (PDB ID 1TEZ [30]). Only the thymine–thymine containing portion of the DNA is highlighted. The electron donor, intermediate and electron acceptor are denoted D, I and A. Distances are discussed in the text.
It was first recognized that ET from a Trp residue might be involved in reduction of the FAD cofactor to catalytically active FADH− [24], an observation that was supported when enzyme X-ray structures became available [25]. However, increasingly detailed studies employing time-resolved spectroscopic techniques showed that a “molecular wire” with three Trp residues can reduce bound, oxidized flavin, resulting in an active enzyme (Fig. 5) [26]. Studies of site-directed mutants using polarization spectroscopy [27], as well as independent theoretical work [28], confirm that all three Trp residues in the chain are necessary for net hole transfer function. It should be noted that this pathway might not be physiologically relevant since the flavin could be fully reduced within the cell.
Trp residues in the photolyase “wire” do not have any potential proton accepting groups within 3 Å of the TrpNH. For photolyase, experimental work suggests that hole transfer is rapid enough (~30 ps [32]) to compete with deprotonation of the transient TrpNH•+ radical(s). An integral aspect of the ET pathway seems to be that no protons are lost from transiently generated TrpNH•+ prior to oxidation of the final Trp in the chain. Based on solution values, the reduction potential of the neutral TrpN• radical (E°(TrpN•/−) = 0.43 V vs. NHE) is not high enough to oxidize TrpNH (E°(TrpNH•+/TrpNH) = 1.15 V), which is dominant at biological pH [29]. Thus, if the TrpNH•+ generated in DNA photolyase were deprotonated prior to the next ET step, it is likely that the “wire” would be interrupted.
Two studies of the mechanism and dynamics of T–T repair have appeared recently [31,32]. The ET steps are very rapid and scission of the T–T dimer is thought to occur in less than 100 ps. Interestingly, the latter report [32] indicates that the adenine moiety of FADH− could be involved in the first ET step in T–T dimer repair. One interpretation is that the electron is effectively hopping from the FADH− excited state to adenine, then to the distal (5′) side of the T–T dimer (Fig. 6). This pathway is suggested by substitution of a T–T CPD dimer with U–T, T–U and U–U CPD dimers. Substitution of uracil, which has a higher (more positive) reduction potential than thymine [33], at the 5′ end of the CPD dimer results in faster ET, consistent with initial reduction of the 5′ base.
Computational work does not favor a hopping pathway. Density functional calculations suggest that adenine plays a role in modulating the electronic coupling of the forward ET reaction, but ET actually proceeds through the 3′ base [34]. Ab initio calculations also favor direct ET from the proximal side of the excited flavin, where the radical is localized, to the 3′ end of the CPD dimer [35]. However, based on experimental and theoretical investigations of reduced flavin excited states, it was suggested that DFT calculations do not fully account for the observed photochemistry [36]. Thus there is still room for discussion of candidate ET mechanisms, and we consider two scenarios in the following analysis.
Data are available that can be used to construct a modified Latimer diagram for flavin (Fig. 7). On the basis of the fluorescence spectrum of DNA photolyase, the excited-state energy can be estimated to be 2.6 eV [37]. This is corroborated by the analogous spectrum of reduced flavin anion in ethanol [38]. The one-electron reduction potential of the neutral flavin semiquinone radical FADH• in DNA photolyase has been determined in the presence of substrate to be +0.08 V vs. NHE [39]. Thus, the reduction potential of the excited state of the reduced flavin anion is estimated to be −2.5 V, comparable to that of adenine [33]. The one-electron reduction potentials of T–T dimers and related thymine model complexes in aprotic solvents also have been reported, and the reduction potential of the T–T dimer is ca. −2 V [40]. Using these values, the first hopping step (*FADH− → A−) has −ΔG°DI = 0 eV and the second step (A− → T–T) has −ΔG°IA = 0.5 eV with relatively large associated uncertainties (±0.1 eV).
Fig. 7.
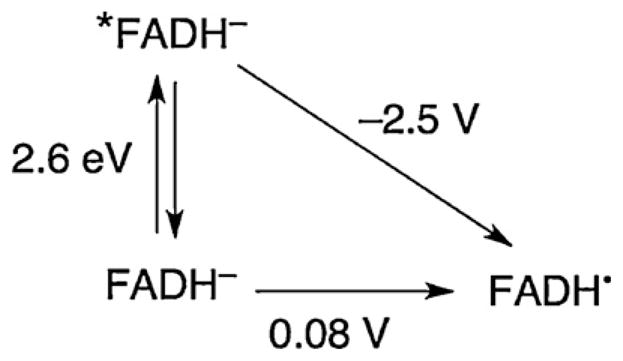
Modified Latimer diagram for FADH− from solution reduction potential and fluorescence measurements. Potentials are vs. NHE.
We now consider which distances best describe the ET reaction. Results from Stark spectroscopy suggest that the unpaired spins in flavin excited states are localized on the central and pyrimidine rings [36]. EPR studies of adenine radicals show that spin density is on N3, C6 and C8 [41]. If we take the adenine N3 and C6 as the primary acceptor sites of the electron from *FADH−, then the distance is 6.2 Å. The average distance from N3 and C6 to the 6 atoms in the 5′ T in the T–T dimer is 7.6 Å, and the average distance from the 10 atoms in the flavin (excluding the o-xylyl ring) to the 6 atoms in the 5′ T is 11.7 Å [42]. Taking 0.8 eV for the reorganization energy and 1.1 Å−1 for the distance decay constant, we construct the hopping map shown in Fig. 8. From the aforementioned driving forces, ET in DNA photolyase lies very near the boundary between the hopping region and the single-step ET region. The system could function in either limit (one- vs. two-step tunneling) with ±0.1 eV uncertainties in the driving forces. For reference, the point in the hopping map closest to the black dot predicts a time constant of ~4 ns, a factor of 16 slower than the observed time constant of 250 ps [32].
Fig. 8.

Hopping map for DNA photolyase. λ = 0.8 eV and β = 1.1 Å−1 with distances r1 = 6.2 Å, r2 = 7.6 Å, rT = 11.7 Å were used to generate the map. The contour lines are plotted at 0.2 log unit intervals of τhopping. The black dot represents the predicted time constant with −ΔG°DI = 0 eV and −ΔG°DA = 0.5 eV (see text).
Eqs. (1) and (2) can be used to predict single-step ET time constants for the pathways suggested from the above work. Taking values for the reorganization energy, decay constant, and single-step distance from FADH− to the 5′ T as before, single-step ET is predicted to have a time constant of 100 ns, much larger than observed experimentally.
In the foregoing discussion of ET distances in azurin, we noted that variations in r1, r2 or rT do not qualitatively perturb a hopping map; importantly the basic shape (or area where hopping is predicted) does not change with <1 Å variations in distances. The same is true for the DNA photolyase hopping map. Small variations in ET distances produce maps similar to Fig. 8 where DNA photolyase is predicted to function at the border between single-step and two-step tunneling. Furthermore, if single-step tunneling were operative, the distance would need to be about 6.5 Å to reproduce the experimental value; this distance is much shorter than in the X-ray structure if ET proceeds via the 5′ T.
We suspect that the problem is our assumption of λ = 0.8 eV for the ET steps. Roth and Klinman have shown that ET in the flavoprotein glucose oxidase has λ between 0.6 and 1.4 eV for reduction of O2 by FADH− [43]. Unfortunately, data are not available that would allow us to estimate λ for self-exchange reactions for O2−/0 and FADH−/0 within the enzyme. However, since O2−/0 has a large λ in solution (2 eV [43]), it is likely that λ for FADH−/• within a protein is below 1 eV. Taking λ = 0.5 eV for net ET in DNA photolyase changes the shape of the map such that hopping is preferred with the same driving forces as before (Fig. 9). The revised map, with λ = 0.5 eV, accounts for the observed 250 ps time constant (τcalc = 370 ps), in support of a hopping mechanism for DNA photolyase.
Fig. 9.

Hopping map for DNA photolyase. λ = 0.5 eV (all other ET parameters are the same as in Fig. 8). The contour lines are plotted at 0.2 log unit intervals of τhopping. The black dot represents the predicted time constant with −ΔG°DI = 0 eV and −ΔG°DA = 0.5 eV (see text).
Another possibility is that the FADH− electron is partially delocalized on adenine, which would enhance electronic coupling. Moreover, factors other than λ and r can be decisive in cases where the predicted time constant occurs close to the hopping/single-step boundary, as in Fig. 8. Protein dynamics can produce transient conformations in which reduction potentials or electronic coupling are considerably altered from their equilibrium values [15,19]. These dynamic effects can have an impact on ET rates that is not accounted for in calculations of hopping maps. We conclude that either hopping or single-step tunneling could account for DNA photolyase function.
We emphasize that variations in λ have a pronounced effect on contour shapes of hopping maps, as documented in Figs. 8 and 9. Thus, D–I–A hopping maps where λ values are not well established can at best only provide estimates for ranges on ET rates. As noted above, in contrast, ET distance variations less than 1 Å do not strongly affect the contour shape (although the calculated rate constants can vary by as much as a factor of 10).
4.2. MauG
MauG is a diheme enzyme responsible for oxidative synthesis of the tryptophan-tryptophanyl quinone (TTQ) cofactor found in methylamine dehydrogenase (MADH) [44]. MADH enzymes catalyze the oxidative degradation of alkylamines to ammonia and aldehydes. The biosynthesis of TTQ by MauG + preMADH (MADH with one Trp (57) and one hydroxylated Trp (108) before formation of TTQ) was reviewed recently [45]. The generation of the TTQ cofactor is interesting because it involves long-range interfacial oxidation and coupling of two Trp residues in MADH by MauG. Whereas many heme proteins carry out oxidative chemistry via an FeIV = O porphyrin radical species (Cpd I, which is oxidized by 2 electrons above the ferric state), MauG places an oxidizing equivalent on each of the two hemes in the enzyme, producing two FeIV centers in the active complex. The resting diferric enzyme contains one low-spin (LS) and one high-spin (HS) heme, and the LS heme shows an unusual His-Tyr coordination. The coordinated tyrosine (Tyr294) is necessary for catalysis; the Y294H variant is able to complex with MADH and tolerates 2-electron oxidation, but both oxidizing equivalents localize on the 5-coordinate HS heme and the enzyme loses catalytic activity [46].
A crystal structure of the MauG/preMADH complex shows the arrangement of cofactors for interprotein ET (Fig. 10) [47]. Interestingly, pre-TTQ intermediates also were observed in the structure. In terms of the redox chemistry of MauG, the Trp between the two hemes and the interfacial Trp between MauG and preMADH are the most noteworthy features. Although the role of the tryptophan situated between the hemes (Trp93) is not known, it should be noted that cytochrome c peroxidase (CcP) from Rhodobacter capsulatus has a very similar 5-coordinate heme/Trp/6-coordinate heme arrangement (PDB ID 1ZZH [48]). Replacement of this Trp with Ala or Phe in R. capsulatus CcP results in a catalytically inactive enzyme, raising the possibility that Trp mediates ET between the two hemes [48]. Indeed, assuming r1 = 11.4 Å, r2 = 10.9 Å and rT = 21.0 Å in the HS heme-Trp93-LS heme in MauG, we calculate that hopping will be faster than single-step ET by more than 3 orders of magnitude at driving forces less than ~200 meV endergonic (data not shown).
Fig. 10.
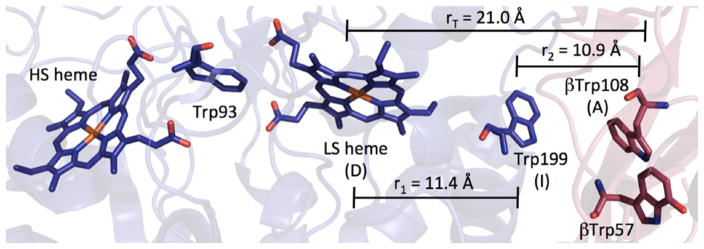
Redox cofactors in the MauG/preMADH complex include two MauG hemes, the interfacial MauG Trp and the two TTQ precursor residues (denoted with β) in preMADH (PDB ID 3L4 M [46]). The hole donor, intermediate and hole acceptor are denoted D, I and A. Distances are discussed in the text.
The case for hopping through Trp199 in the MauG/preMADH complex is compelling, as shown by site-directed mutagenesis studies by Davidson and Wilmot [49]. Replacement of Trp199 with Lys or Phe results in a MauG enzyme that can complex with preMADH, but cannot support TTQ synthesis. Furthermore, heme(FeIII/II) reduction potentials of the Lys199 and Phe199 mutants are essentially unchanged from WT, and treatment of either variant with H2O2 results in production of the di-FeIV species necessary for catalysis. Thus, it is concluded the Trp199 supports hole transfer from MauG to preMADH.
In the hopping map shown in Fig. 11, we have taken distances from the heme to Trp199 (or βTrp108) as the average of those from the heme-iron to the 9 atoms in the Trp indole ring, and that between the two Trps as the average distance between the 9 atoms in each Trp indole [42,50]. Although driving forces for the ET steps in MauG/preMADH are not known, we still can estimate the rate enhancement attributable to hopping. Single-step ET is predicted (Eqs. (1) and (2)) to have a time constant of ~40 ms with −ΔG°DA = 250 meV, which is slower than hopping by at least a factor of 102 if the first step has −ΔG°DI > −100 meV. In other words, hopping in MauG is predicted to be faster than single-step ET even if the first hopping step is uphill by 100 meV, provided the second step is not exergonic by more than 400 meV. While these driving forces are only rough estimates, they still allow us to conclude that hopping is the most likely ET mechanism, in accord with the observations of Wilmot and Davidson [49].
Fig. 11.

Hopping map for MauG/preMADH. ET parameters: λ = 0.8 eV; β = 1.1 Å−1; r1 = 13.5 Å; r2 = 9.4 Å; and rT = 21.0 Å. A dashed line at −ΔG°(βTrp108 → heme) = 0.25 eV is drawn as a guide (see text).
As mentioned above, management of protons for amino acid mediated redox reactions is critical for hopping function. In the MauG/preMADH system, Trp199 is hydrogen bonded across the MauG/preMADH interface with Glu101 of the preMADH enzyme, a structural feature that may help align the system for ET, because the proton must remain close to the transiently oxidized amino acid to maintain free energy. Trp93 (between the two hemes) is H-bonded to a nearby backbone carbonyl (a poor base), so we would expect ET to be faster than proton loss. Note that rapid production of the di-FeIV species from H2O2 (k > 300 s−1 [51]) implies that ET between the two hemes is rapid.
4.3. Ribonucleotide reductases
Ribonucleotide reductases (RNRs) are responsible for conversion of nucleotides to deoxynucleotides, the building blocks of DNA. Electron/hole transfer in RNR involves a very complex cross-interface ET pathway that arguably is best understood for the Class I Escherichia coli enzyme [52,53], which consists of two homodimeric subunits, α2 and β2 (or R1 and R2). In all RNRs the key C–H bond breaking step is carried out by a cysteinyl radical in the α subunit. In Class I enzymes the cysteinyl radical is generated by a tyrosyl (or MnIVFeIII [54]) cofactor located over 30 Å away in the β subunit (12).
We will focus on E. coli RNR, but we emphasize that both similarities and differences in ET mechanism have emerged from recent work on activation and catalytic steps associated with the Chlamydia trachomatis enzyme [55]. In the current mechanistic model for E. coli enzyme function [52] (Fig. 12), redox chemistry is initiated by the β-Tyr122 radical (an unusually persistent tyrosyl radical); and in one proposed scheme, oxidation of β-Trp48 is followed by hole transfer to β-Tyr356. The role of β-Trp48 is still unclear, which we will return to below. Oxidation of β-Tyr356 results in proton loss to a nearby base, generating the neutral tyrosyl radical. In subsequent steps, the hole is transferred across the α/β interface, resulting in oxidation of Tyr731 on the α subunit. The next redox steps are thought to occur with net H• transfer from α-TyrOH730 to α-TyrO•731, and finally from α-Cys439 to α-TyrO•730 to generate the catalytically competent α-Cys439-S• radical. The entire process is dependent on the presence of substrate nucleotide and allosteric effectors (deoxynucleotide triphosphates and ATP), and conformational gating also is important for function [56]. Precisely aligned redox cofactors can promote rapid charge transport, which is possibly the reason why a conformational change is required for function of the full RNR catalytic cycle.
Fig. 12.
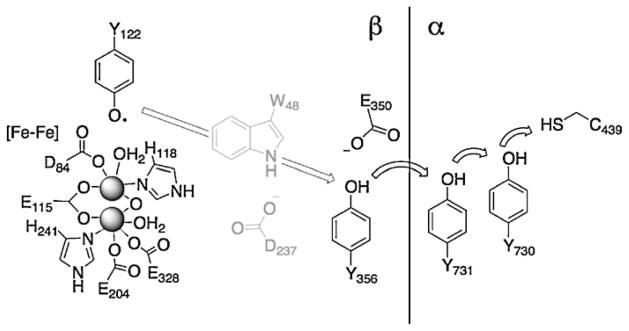
Proposed redox pathways in E. coli ribonucleotide reductases. It is not known whether W48 is involved in the pathway of E. coli RNR. Arrows show proposed hole migration pathways.
Work on RNR demonstrates that the protons of transiently oxidized amino acids must be managed during hopping reactions. Loss of a proton from the vicinity of either a tyrosyl or tryptophanyl radical results in a drastic loss of driving force for subsequent oxidations. Without the ready return of a proton, the relevant redox couples become TrpN•/− (E° = 0.43 V vs. NHE in H2O) and TyrO•/− (E° = 0.71 V in H2O), instead of the more oxidizing proton-coupled potentials, TrpN• + ½H2 → TrpNH (ΔE°′ = 1.0 V, pH 7) and TyrO• + ½H2 → TyrOH (ΔE°′ = 0.99 V, pH 7) [29]. The aqueous H+/e− potential of Cys (Cys-S• + ½H2 → Cys-SH) has ΔE°′ = 0.85 V at pH 7 [29]. For reference, E°(TrpNH•+/TrpNH) = 1.15 V and E°(TyrOH•+/TyrOH) = 1.4 V. These E/pH data often are presented in thermodynamic square schemes or Pourbaix diagrams [29].
Stubbe and coworkers have shown that endergonic ET steps shut down hopping in a series of RNRs where nitrotyrosines have been substituted for tyrosines along the ET pathway (Fig. 12) [56,57]. In these mutants the ET pathway is interrupted wherever nitrotyrosine is introduced, probably because nitrotyrosine is more than 200 mV harder to oxidize than tyrosine at all pH [57a]. Different fluorinated tyrosines, which also can be incorporated, provide both the ability to tune reduction potentials of individual Tyr residues and unique EPR handles [58]. Substitution with unnatural tyrosine derivatives, in concert with EPR and crystallographic studies, has led to identification of different Tyr-conformations that could function in the ET pathway [59].
Recent EPR experiments have shown that tyrosyl radicals at positions 356, 730 and 731 are in equilibrium when β-Tyr122 is replaced with nitrotyrosine, and the relative reduction potentials of these radicals have been estimated [60]. Substitution of nitrotyrosine at position 122 prohibits return of the hole to that position, forcing it to localize elsewhere along the pathway. Based on radical localization at β-Tyr356, it was postulated that the potential of that residue is around 100 mV lower than either α-Tyr730 or α-Tyr731. This proposal is in accord with our observation that hopping is highly inefficient if intervening steps are more than ~200 meV uphill [7,9]. Such tuning of the same amino acid (tyrosine) is possible because the reduction potentials of embedded cofactors are highly sensitive to protein environment.
The role of β-Trp48 in the RNR ET pathway is still unclear. In an attempt to shed some light on this matter, we have constructed hopping maps to estimate the rates of production of tyrosyl radicals for the following hole transfer reactions: (1) β-Tyr356• via β-Tyr122• → β-Trp48 → β-Tyr356; and (2) α-Tyr730• via β-Tyr122• → β-Tyr356 → α-Tyr730. The map constructions employed Stubbe’s driving force estimates [60], distance estimates from a R2/R1 docking model [52a] and λ (0.8 eV) and β (1.1 Å−1) values [8]. The latter two values are a starting point and have not been validated for ET in RNR. The interfacial β-Tyr356 is not resolved in X-ray structures of the β subunit. Assuming that this interfacial tyrosine is halfway between the subunits means that it is roughly 25 Å from β-Tyr122• and 16 Å from the center of β-Trp48. Recent estimates from pulsed electron-electron double resonance (PEL-DOR) experiments place the β-Tyr356 about 30 Å from β-Tyr122• on the opposite pathway [60]. These measurements were possible in the β-NO2-Y122• protein because it is only half-site active, leaving a radical at one of the two β-NO2-Y122• sites in the dimer. The on-pathway distance between β-Tyr122• and β-Tyr356 should be slightly shorter than the cross-pathway value, as we suggest (25 Å). The distance from the phenolic proton of β-Tyr122 to the center of β-Tyr122 is 9 Å, which is well established from structural work [52].
Our β-Tyr122• → β-Trp48 → β-Tyr356 hopping map (Fig. 13) shows that a hole can be generated at β-Tyr356 in about a millisecond. Turnover in WT RNR occurs with kobs = 2–10 s−1, much faster than single-step ET between β-Tyr122• and β-Tyr356. For reference, single-step ET over 25 Å with −ΔG° between −0.15 and 0.15 V is much slower (k = 2 × 10⁻⁴ to 2 × 10⁻² s−1). Note that the driving force estimates are formally ΔE°′, not ΔE°, as required for rigorous ET analysis. With this approximation in mind, we conclude that hopping beats single-step tunneling by at least a factor of 103.
Fig. 13.

Hopping map for β-Tyr122• → β-Trp48 → β-Tyr356 hole transfer in RNR. ET parameters: λ = 0.8 eV; β = 1.1 Å−1; r1 = 9 Å; r2 = 16 Å; and rT = 25 Å. The dashed lines are drawn as guides at −ΔG° = ±0.15 eV, taken as limiting values for each step based on estimated ΔE°′ [60].
If β-Trp48 is not involved in cross-subunit hole transfer, then the hopping reaction likely would be β-Tyr122• → β-Tyr356 → α-Tyr730. Again, we take the β-Tyr122• to β-Tyr356 distance as 25 Å: β-Tyr122• to α-Tyr730 is 30 Å; β-Tyr356 to α-Tyr730 is roughly 12 Å if β-Tyr356 is halfway between the subunits in the docking structure. With these distances and other aforementioned ET parameters, hopping is not predicted to play a role in hole transfer to β-Tyr730 unless the first step has a large driving force (−ΔG° > 0.25 eV).
In sum, our analysis indicates that hole hopping between β-Tyr122• and β-Tyr356 is likely required for RNR function. The logical candidate for this redox intermediate is β-Trp48, but of course it could be some other redox-active partner. We think it unlikely that structural rearrangement occurs during turnover such that β-Tyr122• and β-Tyr356 come close enough (12–15 Å) to promote single-step ET, but we cannot rule that out as an alternative to hole hopping.
5. Conclusions
We have found that: (1) hopping is favorable when intervening steps are not more than 200 meV uphill if ET is to occur on millisecond or faster timescales typically required for biological function; (2) the fate of ionizable protons is a key consideration for hopping involving amino acids, as loss of protons results in substantial loss of oxidative potential; and (3) optimal arrangement of cofactors is a requirement for functional hopping. For in vivo systems, our analysis indicates that cofactors are arranged such that hopping is favored only for a relatively narrow range of driving forces. Ultimately, an understanding of how energetic electrons and holes are transported in natural systems opens the way for the design and construction of efficient artificial photosynthetic molecular machines.
Acknowledgments
Our work is supported by NIH (DK019038 to H.B.G. and J.R.W.; GM095037 to J.J.W.), an NSF Center for Chemical Innovation (Powering the Planet, CHE-0947829) and by a Czech Ministry of Education Grant ME10124 to A.V.
References
- 1.(a) Moore GF, Brudvig GW. Annu Rev Condens Matter Phys. 2011;2:303. [Google Scholar]; (b) Nelson N, Yocum CF. Annu Rev Plant Biol. 2006;57:521. doi: 10.1146/annurev.arplant.57.032905.105350. [DOI] [PubMed] [Google Scholar]
- 2.(a) Rich P, Maréchal RA. Essays Biochem. 2010;47:1. doi: 10.1042/bse0470001. [DOI] [PubMed] [Google Scholar]; (b) Kaila VRI, Verkhovsky MI, Wikström M. Chem Rev. 2010;110:7062. doi: 10.1021/cr1002003. [DOI] [PubMed] [Google Scholar]
- 3.(a) Sazanov LA, Hinchliffe P. Science. 2006;311:1430. doi: 10.1126/science.1123809. [DOI] [PubMed] [Google Scholar]; (b) Sun F, Huo X, Zhai Y, Wang A, Xu J, Su D, Bartlam M, Rao Z. Cell. 2005;121:1043. doi: 10.1016/j.cell.2005.05.025. [DOI] [PubMed] [Google Scholar]; (c) Iwata S, Lee JW, Okada K, Lee JK, Iwata M, Rasmussen B, Link TA, Ramaswamy S, Jap BK. Science. 1998;281:64. doi: 10.1126/science.281.5373.64. [DOI] [PubMed] [Google Scholar]; (d) Yoshikawa S, Shinzawa-Itoh K, Nakashima R, Yaono R, Yamashita E, Inoue N, Yao M, Fei MJ, Libeu CP, Mizushima T, Yamaguchi H, Tomizaki T, Tsukihara T. Science. 1998;280:1723. doi: 10.1126/science.280.5370.1723. [DOI] [PubMed] [Google Scholar]
- 4.Stock D, Leslie AGW, Walker JE. Science. 1999;286:1700. doi: 10.1126/science.286.5445.1700. [DOI] [PubMed] [Google Scholar]
- 5.For a general description of complexes I–IV, ATP, synthase see: Voet DG, Voet JG. Biochemistry. 4. John Wiley and Sons; Hoboken, NJ: 2011.
- 6.Bollinger JM. Science. 2008;320:1730. doi: 10.1126/science.1160001. [DOI] [PubMed] [Google Scholar]
- 7.(a) Gray HB, Winkler JR. Proc Natl Acad Sci U S A. 2005;102:3534. doi: 10.1073/pnas.0408029102. [DOI] [PMC free article] [PubMed] [Google Scholar]; (b) Gray HB, Winkler JR. Quart Rev Biophys. 2003;36:341. doi: 10.1017/s0033583503003913. [DOI] [PubMed] [Google Scholar]; (c) Gray HB, Winkler JR. Annu Rev Biochem. 1996;65:537. doi: 10.1146/annurev.bi.65.070196.002541. [DOI] [PubMed] [Google Scholar]; (d) Winkler JR, Gray HB. Chem Rev. 1992;92:369. [Google Scholar]
- 8.(a) Gray HB, Winkler JR. Biochim Biophys Acta. 2010;1797:1563. doi: 10.1016/j.bbabio.2010.05.001. [DOI] [PubMed] [Google Scholar]; (b) Gray HB, Winkler JR. Chem Phys Lett. 2009;483:1. doi: 10.1016/j.cplett.2009.10.051. [DOI] [PMC free article] [PubMed] [Google Scholar]
- 9.(a) Shih C, Museth AK, Abrahamsson M, Blanco-Rodriguez AM, Di B, Angel J, Sudhamsu J, Crane BR, Ronayne KL, Towrie M, Vlcek A, Jr, Richards JH, Winkler JR, Gray HB. Science. 2008;320:1760. doi: 10.1126/science.1158241. [DOI] [PubMed] [Google Scholar]; (b) Blanco-Rodríguez AM, Di Bilio AJ, Shih C, Museth AK, Clark IP, Towrie M, Cannizzo A, Sudhamsu J, Crane BR, Sýkora J, Winkler JR, Gray HB, Záliš S, Vlček A., Jr Chem Eur J. 2011;17:5350. doi: 10.1002/chem.201002162. [DOI] [PMC free article] [PubMed] [Google Scholar]
- 10.(a) Marcus RA, Sutin N. Biochim Biophys Acta. 1985;811:265. [Google Scholar]; (b) Sutin N. In: Progress in Inorganic Chemistry. Lippard SJ, editor. 1983. p. 441. [Google Scholar]; (c) Barbara PF, Meyer TJ, Ratner MA. J Phys Chem. 1996;100:13148. [Google Scholar]
- 11.See, for example: Wenger OS. Chem Soc Rev. 2011;40:3538. doi: 10.1039/c1cs15044h.Giese B. Acc Chem Res. 2000;33:631. doi: 10.1021/ar990040b.Launay JP. Chem Soc Rev. 2001;30:386.Moser CC, Anderson JLR, Dutton PL. Biochim Biohphys Acta. 2010;1797:1573. doi: 10.1016/j.bbabio.2010.04.441.Moser CC, Chobot SE, Page CC, Dutton PL. Biochim Biophys Acta. 2008;1777:1032. doi: 10.1016/j.bbabio.2008.04.021.
- 12.Wolfram Research, Inc. Mathematica, Version 7.0. Champaign, IL: 2008. [Google Scholar]
- 13.A computer program for the construction of hopping maps is available for download at http://www.bilrc.caltech.edu.
- 14.(a) Beratan DN, Skourtis SS, Balabin IA, Balaeff A, Keinan S, Venkatramani R, Xiao D. Acc Chem Res. 2009;42:1669. doi: 10.1021/ar900123t. [DOI] [PMC free article] [PubMed] [Google Scholar]; (b) Skourtis S, Waldeck DH, Beratan DN. Annu Rev Phys Chem. 2010;61:461. doi: 10.1146/annurev.physchem.012809.103436. [DOI] [PMC free article] [PubMed] [Google Scholar]; (c) Prytkova TR, Kurnikov IV, Beratan DN. Science. 2007;315:622. doi: 10.1126/science.1134862. [DOI] [PMC free article] [PubMed] [Google Scholar]
- 15.(a) Beratan DN, Onuchic JN, Winkler JR, Gray HB. Science. 1992;258:1740. doi: 10.1126/science.1334572. [DOI] [PubMed] [Google Scholar]; (b) Onuchic JN, Beratan DN, Winkler JR, Gray HB. Annu Rev Biophys Biomol Struct. 1992;21:349. doi: 10.1146/annurev.bb.21.060192.002025. [DOI] [PubMed] [Google Scholar]
- 16.Dempsey JL, Winkler JR, Gray HB. Chem Rev. 2010;110:7024. doi: 10.1021/cr100182b. [DOI] [PMC free article] [PubMed] [Google Scholar]
- 17.The average distances used here are arguably a better approximation since the electron comes from (or goes) to a delocalized π-system in Trp. The distances used in the original study [9] are the Trp-C2 to Re (or Cu) distances; r1 = 8.9 Å, r2 = 11.1 Å and rT = 19.4 Å.
- 18.E°(ReI*/0) = 1.25 V. J.J. Warren, H.B. Gray, Work in progress.
- 19.Hartings MR, Kurnikov IV, Dunn AR, Winkler JR, Gray HB, Ratner MA. Coord Chem Rev. 2010;254:248. doi: 10.1016/j.ccr.2009.08.008. [DOI] [PMC free article] [PubMed] [Google Scholar]
- 20.Warren JJ, Winkler JR, Gray HB. FEBS Lett. 2012;586:596. doi: 10.1016/j.febslet.2011.12.014. [DOI] [PMC free article] [PubMed] [Google Scholar]
- 21.Walden SE, Wheeler RA. J Phys Chem. 1996;100:1530. [Google Scholar]
- 22.Sancar A. Chem Rev. 2003;103:2203. doi: 10.1021/cr0204348. [DOI] [PubMed] [Google Scholar]
- 23.Taylor JS. Acc Chem Res. 1994;27:76. [Google Scholar]
- 24.Li YF, Heelis PF, Sancar A. Biochemistry. 1991;30:6322. doi: 10.1021/bi00239a034. [DOI] [PubMed] [Google Scholar]
- 25.Park HW, Kim ST, Sancar A, Deisenhofer J. Science. 1995;268:1866. doi: 10.1126/science.7604260. [DOI] [PubMed] [Google Scholar]
- 26.(a) Aubert C, Vos MH, Mathis P, Eker APM, Brettel K. Nature. 2000;405:586. doi: 10.1038/35014644. [DOI] [PubMed] [Google Scholar]; (b) Byrdin M, Eker APM, Vos MH, Brettel K. Proc Natl Acad Sci U S A. 2003;100:8676. doi: 10.1073/pnas.1531645100. [DOI] [PMC free article] [PubMed] [Google Scholar]; (c) Kodali G, Siddiqui SU, Stanley RJ. J Am Chem Soc. 2009;131:4795. doi: 10.1021/ja809214r. [DOI] [PubMed] [Google Scholar]
- 27.Lukacs A, Eker APM, Byrdin M, Villette S, Pan J, Brettel K, Vos MH. J Phys Chem B. 2006;110:15654. doi: 10.1021/jp063686b. [DOI] [PubMed] [Google Scholar]
- 28.Woiczikowski PB, Steinbrecher T, Kubar T, Elstner M. J Phys Chem B. 2011;115:9846. doi: 10.1021/jp204696t. [DOI] [PubMed] [Google Scholar]
- 29.Warren JJ, Tronic TA, Mayer JM. Chem Rev. 2010;110:6961. doi: 10.1021/cr100085k. [DOI] [PMC free article] [PubMed] [Google Scholar]
- 30.Mees A, Klar T, Gnau P, Hennecke U, Eker APM, Carell T, Essen LO. Science. 2004;306:1789. doi: 10.1126/science.1101598. [DOI] [PubMed] [Google Scholar]
- 31.(a) Thiagarajan V, Byrdin M, Eker APM, Lukacs A, Eker APM, Byrdin M, Brettel K, Vos MH. J Am Chem Soc. 2008;130:14394. doi: 10.1021/ja805261m. [DOI] [PubMed] [Google Scholar]; (b) Müller P, Brettel K. Proc Natl Acad Sci U S A. 2011;108:9402. doi: 10.1073/pnas.1101026108. [DOI] [PMC free article] [PubMed] [Google Scholar]
- 32.(a) Liu Z, Tan C, Guo X, Kao YT, Li J, Wang L, Sancar A, Zhong D. Proc Natl Acad Sci U S A. 2011;108:14831. doi: 10.1073/pnas.1110927108. [DOI] [PMC free article] [PubMed] [Google Scholar]; (b) Stuchebrukhov A. Proc Natl Acad Sci U S A. 2011;108:19445. doi: 10.1073/pnas.1112240108. [DOI] [PMC free article] [PubMed] [Google Scholar]
- 33.Seidel CAM, Schulz A, Sauer MHM. J Phys Chem. 1996;100:5541. [Google Scholar]
- 34.Acocella A, Jones GA, Zerbetto F. J Phys Chem B. 2010;114:4101. doi: 10.1021/jp101093z. [DOI] [PubMed] [Google Scholar]
- 35.Prytkova TR, Beratan DN, Skourtis SS. Proc Natl Acad Sci U S A. 2007;104:802. doi: 10.1073/pnas.0605319104. [DOI] [PMC free article] [PubMed] [Google Scholar]
- 36.Siddiqui MSU, Kodali G, Stanley RJ. J Phys Chem B. 2007;112:119. doi: 10.1021/jp075830e. [DOI] [PubMed] [Google Scholar]
- 37.Kao YT, Saxena C, Wang L, Sancar A, Zhong D. Proc Natl Acad Sci U S A. 2005;102:16128. doi: 10.1073/pnas.0506586102. [DOI] [PMC free article] [PubMed] [Google Scholar]
- 38.Ghisla S, Massey V, Lhoste JM, Mayhew SG. Biochemistry. 1974;13:589. doi: 10.1021/bi00700a029. [DOI] [PubMed] [Google Scholar]
- 39.Gindt YM, Schelvis JPM, Thoren KL, Huang TH. J Am Chem Soc. 2005;127:10472. doi: 10.1021/ja051441r. [DOI] [PubMed] [Google Scholar]
- 40.Scannell MP, Fenick DJ, Yeh SR, Falvey DE. J Am Chem Soc. 1997;119:1971. [Google Scholar]
- 41.Close DM, Nelson WH. Radiat Res. 1989;117:367. [PubMed] [Google Scholar]
- 42.Note that these average distances might better approximate where electrons/holes come from or go to, but they are not rigorously consistent with r0 = 3 Å. Other formulations of ET distances are possible, such as edge-to-edge distances, which are in accord with r0 = 3 Å.
- 43.Roth JP, Klinman JP. Proc Natl Acad Sci U S A. 2003;100:62. doi: 10.1073/pnas.252644599. [DOI] [PMC free article] [PubMed] [Google Scholar]
- 44.Davidson VL. Bioorg Chem. 2005;33:159. doi: 10.1016/j.bioorg.2004.10.001. [DOI] [PubMed] [Google Scholar]
- 45.Wilmot CM, Davidson VL. Curr Opin Chem Biol. 2009;13:469. doi: 10.1016/j.cbpa.2009.06.026. [DOI] [PMC free article] [PubMed] [Google Scholar]
- 46.Tarboush NA, Jensen LMR, Feng M, Tachikawa H, Wilmot CM, Davidson VL. Biochemistry. 2010;49:9783. doi: 10.1021/bi101254p. [DOI] [PMC free article] [PubMed] [Google Scholar]
- 47.Jensen LMR, Sanishvili R, Davidson VL, Wilmot CM. Science. 2010;327:1392. doi: 10.1126/science.1182492. [DOI] [PMC free article] [PubMed] [Google Scholar]
- 48.De Smet L, Savvides SN, Van Horen E, Pettigrew G, Van Beeumen JJ. J Biol Chem. 2006;281:4371. doi: 10.1074/jbc.M509582200. [DOI] [PubMed] [Google Scholar]
- 49.Tarboush NA, Jensen LMR, Yukl ET, Geng J, Liu A, Wilmot CM, Davidson VL. Proc Natl Acad Sci U S A. 2011;108:16956. doi: 10.1073/pnas.1109423108. [DOI] [PMC free article] [PubMed] [Google Scholar]
- 50.As noted in Section 3.1, changes in ET distances affect calculated hopping times, which is especially important when dealing with redox systems that include a high valent heme in which a hole is delocalized. Employing ET distances to/from a heme edge, rather than the iron center, will predict faster hopping. It follows that our prediction of a 102-fold rate enhancement in MauG/preMADH likely is a lower limit.
- 51.Lee S, Shin S, Li X, Davidson VL. Biochemistry. 2009;48:2442. doi: 10.1021/bi802166c. [DOI] [PMC free article] [PubMed] [Google Scholar]
- 52.(a) Uhlin U, Eklund H. Nature. 1994;370:533. doi: 10.1038/370533a0. [DOI] [PubMed] [Google Scholar]; (b) Sjöberg BM. Struct Bond. 1997;88:139. [Google Scholar]; (c) Rova U, Adrait A, Pötsch S, Gräslund A, Thelander L. J Biol Chem. 1999;274:23746. doi: 10.1074/jbc.274.34.23746. [DOI] [PubMed] [Google Scholar]; (d) Ekberg M, Sahlin M, Eriksson M, Sjöberg BM. J Biol Chem. 1996;271:20655. doi: 10.1074/jbc.271.34.20655. [DOI] [PubMed] [Google Scholar]
- 53.(a) Stubbe J, van der Donk WA. Chem Rev. 1998;98:705. doi: 10.1021/cr9400875. [DOI] [PubMed] [Google Scholar]; (b) Stubbe J, Nocera DG, Yee CS, Chang MCY. Chem Rev. 2003;103:2167. doi: 10.1021/cr020421u. [DOI] [PubMed] [Google Scholar]
- 54.Jiang W, Yun D, Saleh L, Barr EW, Xing G, Hoffart LM, Maslak MA, Krebs C, Bollinger JM. Science. 2007;316:1188. doi: 10.1126/science.1141179. [DOI] [PubMed] [Google Scholar]
- 55.(a) Jiang W, Bollinger JM, Krebs C. J Am Chem Soc. 2007;129:7504. doi: 10.1021/ja072528a. [DOI] [PMC free article] [PubMed] [Google Scholar]; (b) Jiang W, Hoffart LM, Krebs C, Bollinger JM. Biochemistry. 2007;46:8709. doi: 10.1021/bi700906g. [DOI] [PMC free article] [PubMed] [Google Scholar]; (c) Jiang W, Saleh L, Barr EW, Xie J, Gardner MM, Krebs C, Bollinger JM. Biochemistry. 2008;47:8477. doi: 10.1021/bi800881m. [DOI] [PMC free article] [PubMed] [Google Scholar]; Jiang W, Yun D, Saleh L, Bollinger JM, Krebs C. Biochemistry. 2008;47:13736. doi: 10.1021/bi8017625. [DOI] [PMC free article] [PubMed] [Google Scholar]; (d) Jiang W, Xie J, Varano PT, Krebs C, Bollinger JM. Biochemistry. 2010;49:5340. doi: 10.1021/bi100037b. [DOI] [PMC free article] [PubMed] [Google Scholar]
- 56.Yokoyama K, Uhlin U, Stubbe J. J Am Chem Soc. 2010;132:15368. doi: 10.1021/ja1069344. [DOI] [PMC free article] [PubMed] [Google Scholar]
- 57.(a) Yee CS, Seyedsayamdost MR, Chang MCY, Nocera DG, Stubbe J. Biochemistry. 2003;42:14541. doi: 10.1021/bi0352365. [DOI] [PubMed] [Google Scholar]; (b) Yokoyama K, Uhlin U, Stubbe J. J Am Chem Soc. 2010;132:8385. doi: 10.1021/ja101097p. [DOI] [PMC free article] [PubMed] [Google Scholar]
- 58.Minnihan EC, Young DD, Schultz PG, Stubbe J. J Am Chem Soc. 2011;133:15942. doi: 10.1021/ja207719f. [DOI] [PMC free article] [PubMed] [Google Scholar]
- 59.Minnihan EC, Seyedsayamdost MR, Uhlin U, Stubbe J. J Am Chem Soc. 2011;133:9430. doi: 10.1021/ja201640n. [DOI] [PMC free article] [PubMed] [Google Scholar]
- 60.Yokoyama K, Smith AA, Corzilius B, Griffin RG, Stubbe J. J Am Chem Soc. 2011;133:18420. doi: 10.1021/ja207455k. [DOI] [PMC free article] [PubMed] [Google Scholar]