

Abstract
Motivation: The Gene Ontology (GO) is heavily used in systems biology, but the potential for redundancy, confounds with other data sources and problems with stability over time have been little explored.
Results: We report that GO annotations are stable over short periods, with 3% of genes not being most semantically similar to themselves between monthly GO editions. However, we find that genes can alter their ‘functional identity’ over time, with 20% of genes not matching to themselves (by semantic similarity) after 2 years. We further find that annotation bias in GO, in which some genes are more characterized than others, has declined in yeast, but generally increased in humans. Finally, we discovered that many entries in protein interaction databases are owing to the same published reports that are used for GO annotations, with 66% of assessed GO groups exhibiting this confound. We provide a case study to illustrate how this information can be used in analyses of gene sets and networks.
Availability: Data available at http://chibi.ubc.ca/assessGO.
Contact: paul@chibi.ubc.ca
Supplementary information: Supplementary data are available at Bioinformatics online.
1 INTRODUCTION
The Gene Ontology (GO) (Ashburner et al., 2000; Camon et al., 2003) is a key means by which systems biologists operationalize gene function, making it a heavily relied on tool in innumerable analyses and data interpretation exercises. Although GO annotations are often used as a gold standard, it has widely appreciated imperfections. Ironically, it is difficult to assess the properties of GO itself, as there is no other comprehensive gold standard against which to hold it. Broadly speaking, assessment of GO has focused on three distinct attributes: the accuracy of annotations assigned to GO, GO’s structure independent of annotation and the utility of GO and its annotations for the interpretation of data.
Although GO was initially conceived as providing explicit definitions of gene function concepts (Lewis, 2005), GO can also be thought as defining each function by the genes that have a particular GO term assigned to them (in the field of logic, this is the distinction between ‘intensional’ and ‘extensional’ definitions). Despite misgivings about the incompleteness of GO annotations (Thomas et al., 2012), the use of GO ‘sets’ as representing ‘functions’ is now endemic. This is put to use in numerous applications such as ‘gene group enrichment’ (Subramanian et al., 2005), gene network analysis and gene function prediction (Gillis and Pavlidis, 2011a; Warde-Farley et al., 2010). It is essential to understand the extent to which such applications are valid.
There have been multiple assessments of GO annotation correctness, often focusing on subsets of annotations (Andorf et al., 2007; Devos and Valencia, 2001; Naumoff et al., 2004; Park et al., 2005; Schnoes et al., 2009; Škunca et al., 2012). Assessment of GO’s structure independent of annotation has tended to focus on issues of redundancy within the ontology structure; that is, using different names for the same concept or different concepts for the same name (Alterovitz et al., 2007; Onsongo et al., 2008). To the extent assessment of GO and its annotations are considered together, it is almost exclusively in the context of gene group enrichment analyses (Gross et al., 2012; Grossmann et al., 2007; Jantzen et al., 2011; Yang et al., 2011). In comparison, there has been little attention given to the changing or redundant role of individual genes within GO, rather than the changing or redundant role of functions. This article is an attempt to address this gap.
We describe a series of evaluations that take the approach of assuming that GO annotations are correct, focusing instead on whether they can be considered meaningful. We do this by performing three types of ‘sanity checks’ of GO annotations that would be expected to hold.
We first explore whether each gene has a consistent functional identity between versions of GO. We then consider the degree to which GO assignments are distributed unequally among genes and how this has changed over time. This annotation bias is crucial to assigning appropriate priors to the probability a gene might appear in a functional analysis by chance (Gillis and Pavlidis, 2011a; Greene and Troyanskaya, 2012). Finally, we study the degree to which GO can be safely integrated with network data without confounds that would lead to misleading conclusions or circular reasoning. To illustrate how our analyses can be applied, we close with a biologically motivated case study. Our results provide novel insights leading to a specific set of recommendations for both the developers of GO and its users.
2 METHODS
2.1 Historical analyses
GO files were obtained from the GO FTP site. The GO was processed from the ‘termdb’ rdf-xml files. The GO annotations (GOA) were from the monthly GOA files for human genes (from the EBI FTP site), releases 1–103 (releases 26 and 53 were not available, and releases 39 and 41 failed quality control), covering a 10-year period from November 2001 to November 2011. For each GOA file, an ‘xref’ file was matched based on the edition number, and a termdb file was matched based on the modification date of the GOA file and the date embedded in the termdb file name (using the file from the first day of the nearest month prior to that of the GOA file; in a few cases, we had to use termdb files from the next later date, as the earliest ones do not seem to be available). The termdb files were used to infer the ancestor terms in the GO hierarchy (excluding the three GO root terms and any obsolete terms). All annotations are thus up-propagated using the matching edition of the GO hierarchy. Yeast (Saccharomyces cerevisiae) genes annotations were obtained from the GO archives and the Saccharomyces Genome Database FTP site (discontinuities between data from these two sources were resolved in Figure 2B by alignment of neighboring time points). Genes were matched across editions using NCBI gene IDs and gene symbols. IEA annotations were ignored or irrelevant to all analyses, except for Figure 2, where they were retained. Semantic similarity was measured by the Jaccard distance; similar results were obtained using term overlap (Mistry and Pavlidis, 2008). Annotation bias (‘multifunctionality’ or ‘prevalence’) was measured as described in (Gillis and Pavlidis, 2011a). Briefly, the ranking of genes by the number of GO terms was used as a ‘predictor’ of GO term membership for all GO terms (with at least 10 genes), evaluated by receiver operating characteristic curves. The mean area under the ROC (AUROC) curve provides an overall measure of annotation bias.
Fig. 2.

Annotation bias persists in the GO. (A) Annotation bias has risen among human genes, indicating genes with many annotations have become more dominant within GO over time. (B) Annotation bias has generally fallen for yeast, aligned to remove two discontinuities that we regarded as artifactual. (C) The relative number of annotations a gene possesses has remained stable over time, with some change (correlation shown). (D) Annotation bias (expressed as the number of GO terms for a gene) is correlated with the rank of the numerical ID of the gene in NCBI, indicating a historical bias
2.2 Protein interaction network analysis
Human protein–protein interactions (PPIs) were obtained from the HIPPIE database (Schaefer et al., 2012), which aggregates multiple sources and contains 73 324 unique interactions across 8969 proteins that possess annotations in GO. These interactions come from 24 075 publications (as determined by PubMed id) reporting between 1 and 5119 interactions each (mean: 4.4) and with approximately half of the publications (12 030) reporting only a single interaction. A large proportion of the interactions (57185) are based on a single report. Over the same set of genes, in the latest edition of GO we assessed (103), GO reports 77 723 assignments of function totaling 7 41 270 assignments after propagation to ancestors. We reported results only for those functions with 10–300 genes, to emulate the use within many network analyses (Pena-Castillo et al., 2008) and reduce the effects of overlaps in large or small functions. Over this range, GO reports 14.4 functions per gene. The confound of function annotations with PPIs was determined by comparing the PubMed IDs for interactions linking pairs of genes within the function to the PubMed ID associated with the assignment of those genes to the function. We did not consider if multiple lines of evidence may have otherwise supported linking those genes (or supplying that function), as which evidence to pick to avoid confound would still be an unwanted bias. Prediction of gene function using interaction data used a basic neighbor-voting algorithm in which genes are ranked based on the fraction of their neighbors’ matching genes labeled as positive in the training data, described in more detail in Gillis and Pavlidis (2011b).
2.3 Postsynaptic proteome
The postsynaptic proteome gene list was obtained from Collins et al. (2006). Spectral clustering was performed as described by Ruan and Zhang (2008). Only the 195 genes with greater than four subnetwork connections were included in the clustering to remove many isolated small components. Enrichment analysis was performed using Fisher’s exact test with control of the false discovery rate (FDR) (Benjamini and Hochberg, 1995).
3 RESULTS
3.1 Changes in gene functional identity over time
Although GO (and associated annotations) changes over time, most users assume their results are not sensitive to this. Indeed, it is rarely noted which version of GO was used in an analysis, and even rarer to test a result for stability against different versions of GO. To assess functional identity, we used semantic similarity (Lord et al., 2003). We define functional identity as the degree to which a gene is most semantically similar to itself in different editions of GO (where by ‘GO’ we mean both the structure of GO and the annotations). If annotations are stable, it will be most semantically similar with itself, or at least tied for first, among all genes. If a gene’s annotations have changed dramatically relative to other genes, it is in a sense a functionally different gene.
Figure 1 plots the fraction of human genes having a consistent functional identity (meaning having the highest semantic similarity with itself) between every pair of editions of GOA. The average fraction of identity maintained in successive editions is 0.971. A useful way to think of this is that if one uses GO annotations as a basis for selecting a particular gene as ‘interesting’, one cannot be more certain of this than 1–0.97 (i.e. a P-value of 0.03). That is, there is a chance that the next month, the gene’s annotations will have changed so substantially that it is not functionally ‘the same gene’. This estimate is conservative because of ties in semantic similarity; therefore, the useful level of retained identity is likely to be lower. Gene-level data on stability can be used to evaluate results of GO-based analyses, as we illustrate later in the use case (Section 3.4).
Fig. 1.
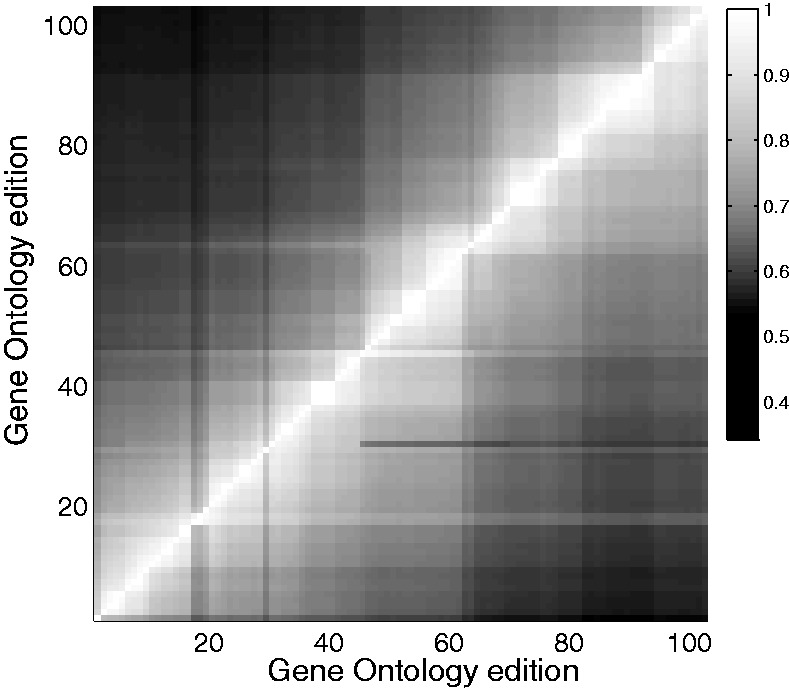
Gene functional identity changes over GO editions. The shading indicates the fraction of genes that retain a functional identity between GO editions. Semantic similarity is calculated and genes are matched between editions; if a gene is most similar to itself between editions, it is said to retain its identity. Similarity is not symmetric in time (GeneiGOA may rank GeneiGOB as most similar to it, without the reverse being true). Below the diagonal is matching backward in time; above, forward in time
The preservation of functional identity is not uniform over time; it is both slightly increasing (r = 0.20, P < 0.01) and marked by sporadic large shifts (identity match falls as low as 0.82), which have been diminishing in magnitude and appear to reflect changes in the ontology structure (and the resultant change in propagated assignments), rather than new direct function assignments (Fig. 1). Of course, as shown in Figure 1, GO changes even further over longer periods. The median duration for which it retains a 95% gene identity match is five editions (∼5 months), whereas it takes a median of 25 editions for gene identity to fall to 80%.
3.2 Changes in functional redundancy over time
Genes vary widely in how many GO annotations they have, and this property is important to the use of GO. In Gillis and Pavlidis (2011a), we treated the number of GO annotations as a measure of gene multifunctionality, but it can also be thought of as the prevalence of a gene in GO. It is unclear the degree to which annotation bias reflects biology (‘actual’ multifunctionality) versus popularity, in which some genes accrue more functions simply because they are studied more. The interpretation of differences in prevalence (‘annotation bias’) can be enhanced by examining historical trends. A decrease in bias would mean GO annotations are becoming more evenly distributed among genes. At the gene level, a gene that dramatically changes its degree of annotation would have a direct impact on GO-based analyses that focus on the gene.
As in our previous work, we quantified overall annotation bias using ROC curves [see Gillis and Pavlidis (2011a) and Section 2]. If all genes have the same number of GO terms, the annotation bias is 0.5. At the other extreme, if there are only a few GO terms used and they are all applied to the same set of genes, then the bias is 1.0. Put another way, if one can perfectly predict which GO terms genes have based on how many they have, the bias is 1.0. Thus, annotation bias measures the degree to which a statement about a GO group of interest would apply equally well to another randomly selected GO group, just because it will tend to have some genes in common. In this sense, annotations can be said to be redundant. Consistent with Gillis and Pavlidis (2011a), in the last edition of human gene GO annotations we studied, the bias was 0.84, many standard deviations away from 0.5. For yeast, the current bias is less extreme, but still high (∼0.7). To be conservative, we calculated bias using only genes that have at least one GO annotation; including all genes would increase these values substantially.
The historical analysis (Fig. 2) reveals a steady increase in bias over time for human genes until approximately GOA edition 70 where it leveled off (Fig. 2A). Interestingly, for yeast genes, annotation bias was decreasing until approximately edition 60 where it leveled off (Fig. 2B).
These trends could be due to either accumulation of annotations or changes in the structure of GO. To test this, we held GO structure constant at the earliest edition studied and assessed the change in bias as a consequence only of changes in annotation. The yeast annotation bias retained the same pattern, but the human annotation bias reversed direction, to more closely resemble the pattern for yeast, decreasing over time (r = −0.5). This suggests much of the increase in annotation bias for human genes is due to the proliferation of terms and/or relations in GO. This proliferation is not primarily occurring at the ‘leaf’ level, as indicated by the fall in the fraction of leaf terms in the ontology from 50 to 39.5% (from editions 1 to 103, with leaf annotations similarly falling from 5 to 3.2%) and a corresponding increase in the number of ancestors per term of 8.5–13.0 over this interval. In addition, the most heavily annotated genes have remained relatively stable over GO editions, with the correlation between genes ranked by prevalence in different versions of GO shown in Figure 2C. The consistency of ‘popular genes’ over history is also reflected in the degree to which numerical NCBI gene IDs predicts the number of GO terms found for genes at present; genes that were entered into NCBI first tend to be more heavily annotated (Fig. 2D). A related observation was recently made for disease annotations (Cheung et al., 2012).
3.3 Independence of GO and protein interaction data
The tendency of proteins interacting in a network to share GO categories (‘guilt by association’) serves to validate both the networks and the GO as encoding ‘real’ function. Underlying this is an assumption that the two forms of data are independent. However, because both GO annotations and protein interactions are derived from the published literature, there is a potential for logical circularity that has, to our knowledge, never been explored. We therefore compared the citations attached to reported interactions and those attached to function assignments in GO, to look for overlapping sources of data that would be considered potentially confounded. We use the term ‘confound’to indicate an overlap in data source that could affect interpretation if independence was an important assumption.
We used a human PPI dataset from HIPPIE (Schaefer et al., 2012), which documents 73 324 PPIs from 24 075 published articles (based on PubMed IDs). The GO annotations for the genes covered by this set are drawn from 18 195 distinct publications. We found that 4313 of the PubMed IDs are common between sources for the PPI and GO datasets, creating a strong opportunity for overlap at the level of specific genes and their interactions. One possibility is that ‘functional’ edges (those that link genes sharing a GO term) are created by a single report. That is, a single article might be used to assign GO terms and protein interactions to the same gene. In these confounded cases, artifactual similarities will easily appear.
We found that, as expected, interacting proteins shared GO terms at a rate much higher than chance (mean 1.6, P < 10−87), indicating substantial ‘guilt by association’. However, 13% of the time, the GO annotation shared by the two genes was derived from the same article that reported the protein interaction. At the GO term level, 66% of GO groups with functional edges possess confounds of this type (Fig. 3A), and on average, 18% of a given gene set’s functionally relevant edges will consist of this type of confound. One concern is the propagation of annotations to ancestors in the GO graph could cause a misleading overestimate in overlaps for annotations of higher-level terms. To exclude this possibility, we permuted the PubMed IDs attached to GO IDs and repeated the analysis and found all average confound scores were <1%.
Fig. 3.
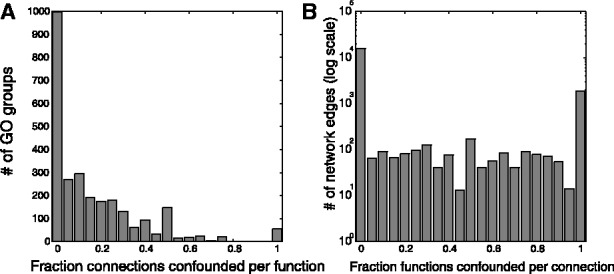
Data are reused in protein-interaction networks and GO. (A) Many GO groups have a large fraction of their network functional connectivity coming from the same publication as the GO annotations (‘confounded’). (B): Most network connections can be used to infer some function due to confounds
We hypothesized that the overlap between data sources for GO annotations and PPIs would have an impact on the utility of the PPIs for gene function prediction. We used a simple machine-learning approach to test the predictability of GO term annotations using the PPI network as the data source. The algorithm is blinded to a fraction of GO annotations and attempts to reconstruct them from the other labels and the relationships encoded by the interaction data, based on guilt by association (e.g. genes interacting with genes of a particular function are predicted to have that function themselves). Again, in agreement with the guilt by association principle, GO terms are significantly learnable on average, with a mean AUROC of 0.67. However, this performance was significantly correlated (r = 0.2, Spearman correlation, P < 10−24) with the number of ‘confound’ edges the functions contained, indicating logical circularity may play a major role in the network interpretation of function. Indeed, a network built from only confounded edges yielded a mean AUROC of 0.58 (much higher than expected by chance), suggesting the use of GO to interpret network structure is affected by a form of circular logic. One possibility we considered is that those edges most likely to be confounded were also most likely to be important in determining function. We used our previously described analysis of network edges in which they are ranked by their contribution to function prediction (measured as the impact removing that edge has on aggregate performance) (Gillis and Pavlidis, 2012). ‘Exceptional edges’ are those that contribute substantially to the learnability of many gene functions. We found there is a v-shaped relationship (Fig. 4) between exceptionality and confound such that both exceptional and unexceptional (but still linking functionally related genes) are both highly confounded on average.
Fig. 4.
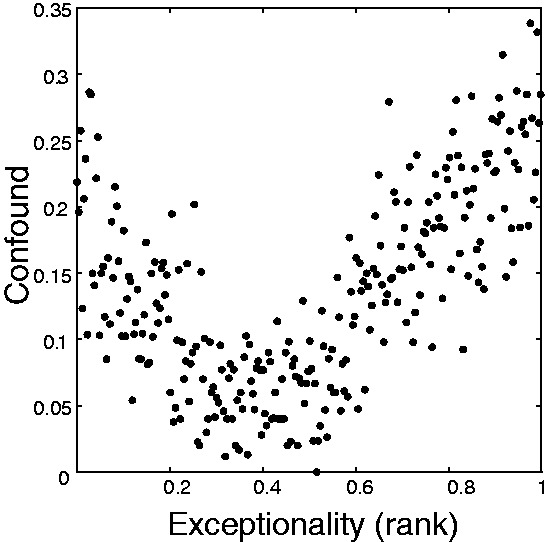
Confounded edges are likely to either have very low or very high impacts on determining function within networks. ‘Confound’ is calculated as the fraction of shared functional assignments for a protein pair, which overlap (in either part) with the article reporting the protein interaction. Exceptionality was calculated as the effect of a given edge’s removal on network function prediction performance in cross-validation (Gillis and Pavlidis, 2012). The data are binned (bins of 100 edges per point, non-overlapping) to emphasize the trend
Finally, we conducted a historical analysis of these potential sources of confounds (starting with edition 61, where annotation bias leveled off), shown in Figure 5. We find that both function-centered and connection-centered measures of confound have been relatively stable in GO over this time. As expected, those annotations labeled as ‘inferred from protein interaction’ (evidence code IPI) were substantially more likely to be confounded. Even though IPI annotation may not explicitly be transferring functional assignment (instead, e.g., it may indicate regulatory interactions implying different functional assignment), at slightly higher levels in the ontology, the assignment will be equivalent to being transferred across the interaction. Subsequent use of the interaction data in conjunction with these higher-level terms would then be confounded. Removing IPI annotations did not substantially alter the average overall confound (Fig. 5B and D); therefore, this is not a sufficient solution.
Fig. 5.
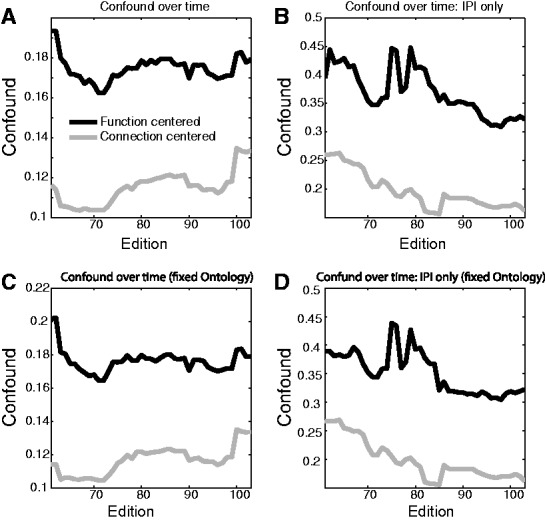
Potential confounds in functional analysis of protein interactions over time. ‘Confound’ is defined as in Figure 3A (function centered, black lines) and 3B (connection centered, gray lines). (A) The number of functions per connection with PubMed ID overlaps between function assignment and interaction report is shown (connection centered) as well as the number of functional edges within a function that have PubMed ID overlap (function centered). (B) Confounds computed using only ‘IPI’ (inferred from physical interaction). (C) Confounds calculated using changing Gene Annotations on a fixed GO (most recent). (D) Confounds for IPI annotations calculated using a fixed ontology
3.4 Use case: the postsynaptic proteome
Thus far, we have considered phenomena at a high level while arguing that the gene-level details can be exploited to assist in more typical applications of GO. As an illustration, we describe an extended sample use case.
One common use of GO is the analysis of network ‘modules’ enriched for particular functions as well as candidate genes, for example in O'Roak et al. (2012) and Rossin et al. (2011). We take as our gene list of interest the ‘consensus post-synaptic proteome’ (PSP) characterized in a meta-analysis of proteomics data (Collins et al., 2006). This set is an interesting target because of the role of synapses (the points of chemical communication between neurons) in biological processes such as learning and memory, and diseases such as autism and schizophrenia. We note that the PSP gene set was chosen not through an exhaustive search for gene sets that have ‘problems’, but owing to our laboratories’ research interests. Our analysis follows a workflow that one sees commonly in the literature when researchers are confronted with a new set of genes to interpret (albeit with numerous methodological variations).
When enrichment analysis is run on this list, 67 diverse functions are significantly enriched (FDR < 0.01). We then hypothesized that the genes will preferentially show protein interactions (‘guilt by association’). Indeed, considered as a target for function prediction, membership in the PSP is predictable from the full network using a simple machine-learning algorithm on the protein interaction data discussed in Section 3, with an AUROC of 0.73 in cross-validation. We then used the same protein interaction to construct a PSP subnetwork. As the network was still fairly large, we attempted to find sub-components, using spectral partitioning (Ruan and Zhang, 2008). This yielded six subnetworks (modules) varying in size from 11 to 67 genes. The partitioning had modularity function Q of 0.40, indicating high community structure (White and Smyth, 2005). Considered separately, four of the modules had significantly enriched GO groups (FDR P < 0.01), suggesting the modules partly reflect different functions. There were multiple GO groups associated with each modules, with clear themes: glutamatergic activity and synaptic transmission (cluster 1), cell junctions and adhesion (cluster 3), ribosomal components (cluster 4) and endocytosis (cluster 6) (see Supplementary Table S1).
We now move to considering the impacts of the effects described in the previous sections. We first tested whether the enrichment was sensitive to GO edition. We measured this by determining the number of editions over which a gene’s most semantic similar match at a previous time point was itself, as discussed in Section 3.1. All clusters except for cluster 3 had a self-similarity match of >30 GO editions (∼2.5 years), whereas cluster 3 exhibited only moderate consistency (genes mapped to selves by self-similarity for 21.6 editions). Only cluster 3 (shown in Fig. 6) contained genes significantly different in the semantic similarity consistency from other clusters (P < 0.05, rank sum test). This suggests cluster 3’s results may not be robust.
Fig. 6.
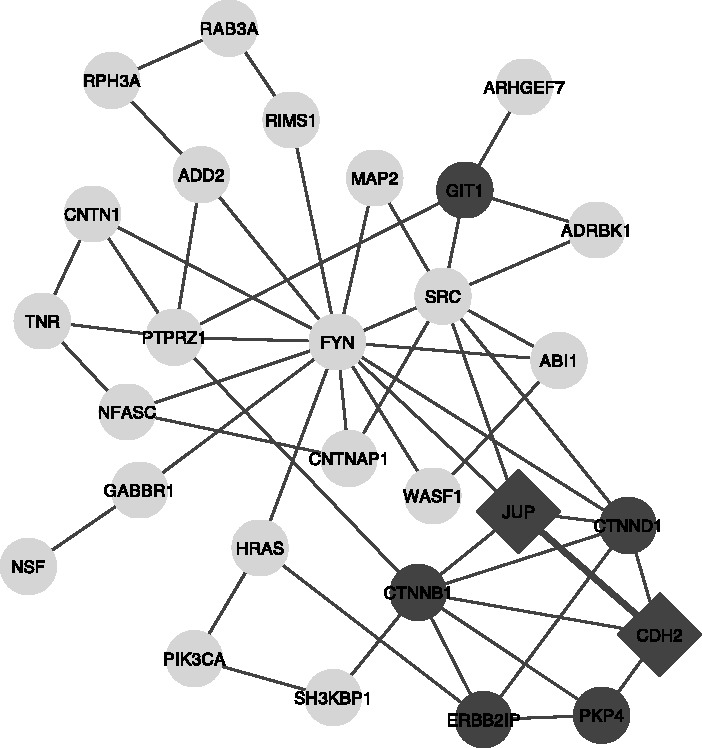
Module 3 from the PSP case study. The module is shown with genes annotated with the enriched functions shown in dark gray. JUP and CDH2 (diamonds) received annotations from articles reporting both their functional annotation and their interaction (PubMed IDs 1639850 and 7650039)
Another possibility is that separation of functions by PPI clustering does not indicate an orthogonal property, but simply that different articles reported both certain interaction and certain functions, as analysed in Section 3.3. We found that two interacting proteins in cluster 3 were confounded in this way, owing to annotation from two articles (diamonds in Fig. 6). Removing those GO terms from the two genes reduces the functional enrichment for the module to the point that no functions meet the FDR 0.01 threshold.
Another notable feature of module 3 is the hub-like status of FYN (encoding the Fyn tyrosine kinase protooncogene). FYN is not among the genes driving GO term enrichment within this module, but it clearly possesses an unusually dense connectivity. Although FYN has many interactions in the full network, it is significantly attached to this module in particular (P < 10−14). Checking the multifunctionality of FYN (as in Section 3.2), we find it is in the top 12% of annotated genes, suggesting any attempt to interpret FYN’s hub-like status, as characteristic of the module will potentially fall prey to confabulation. That is, if FYN is heavily studied enough, we will be able to find literature support for many interesting hypotheses about this module if we assume FYN characterizes it. However, a top 12% score is not so high that such analyses are impossible but merely require some greater degree of care.
We propose that the interpretation of many ‘interesting gene sets’ will be enhanced by the considerations just described. To assist others in conducting similar analyses, we have made a number of resources available as supplementary data at http://chibi.ubc.ca/assessGO:
A list of GO functions and the PubMed IDs of articles contributing the most (typically, all) confound edges for each of those functions. Thus, if a module of candidate genes is found to be enriched for a particular function, the articles underlying that overlap can be easily checked against our list.
A list of genes and the number of GO editions since they changed functional identity (measured as not having the highest semantic similarity with itself). Thus, for example, we can see that the gene most tenuously connected to our module (Fig. 6), NSF, has changed functional identity within the last three editions of GO.
A table of the similarity ranking for each gene back through each edition of GO. For each edition of GO, the semantic similarity of each gene is calculated for a given gene. The score the given gene receives is the rank of similarity it has with itself, relative to other genes. Thus, most genes take a score of 1 when compared with the previous edition of GO (they are most similar to themselves). These numbers allow us to assess whether results based on old data are likely to hold true. If, for example, a gene is prioritized for investigation through some GO-based analysis at some time in the past, this table indicates whether the same gene would be obtained today (or whether results need to be updated).
A list of gene multifunctionality rankings over time. This may be of use to developers in attempting to reduce the annotation bias in GO. For example, one of the least stable human genes is PDE2A, which gained >200 GO terms during the past 2-month period measured an increase of >300%.
We intend to expand these resources to include data for more organisms and to maintain updated versions as a resource for the community.
4 Discussion
Our contribution in this report is the identification and analysis of three types of quantifiable issues with the GO that we argue are essential to its usefulness. Importantly, these issues are distinct from the question of the ‘correctness’ of the annotations. Although the issues we have uncovered certainly do not cripple GO’s utility, they are severe enough to run a strong risk of misleading the field if not adequately taken into account. Here, we discuss some implications of each of our findings.
We presented a way to quantify the stability of GO annotations over time and showed that over moderate time spans many genes become different in their annotated functionality. The statement ‘the differentially expressed genes were enriched for genes with functions in cell growth’ does not necessarily mean the same thing today as it did 5 years ago because the definition of ‘cell growth genes’ has changed in GO. Valid experimental results often become obsolete over time, but the reported facts of the experiment should not. But that is what happens when the GO changes. This is of course to be expected, and the problem can be ameliorated by reporting which version of the gene annotations was used. But we can do better, thanks to the formal structure of GO: it is possible to quantitatively evaluate how volatile a result is likely to be. That is, users of GO could consider the likely future stability of their results, as well as the current relevance of past results. We suggest that in the future the GO consortium might track stability and report the duration since each gene’s last major shift in its functional identity. Any review of the literature thereafter could check that the ‘best before’ date for those results had not passed. A similar conclusion was reached by Gross et al. (2012) in their consideration of the time dependence of GO enrichment results.
We further found that annotation bias is a long-standing feature of GO and has no signs of declining. This bias has broad effects on the interpretation of analyses (Gillis and Pavlidis, 2011a; Greene and Troyanskaya, 2012). In general, this fact enjoins researchers to be cautious in the interpretation and use of GO: the biases in GO annotation are of sufficient magnitude to swamp almost any true result about gene function. This problem with GO can be regarded as a particular variant of ‘publication bias’, in which GO makes it even easier than usual to select genes for study, only because they have already been heavily studied. However, this does not mean GO is useless because those biases are sometimes easy to assess. Rather than simply discarding enrichment or network results using GO, they should instead be explicitly assessed for their specificity. Results where divergent lines of evidence (one involving GO) both point to a highly studied gene are much less interesting than ones where divergent lines of evidence point to genes with more circumscribed-documented function. Our results further suggest that the increase of this bias for human genes (between 2001 and 2009) seems to be owing to the proliferation of GO terms and relations (as opposed to biased annotation). Thus, it appears to be more of an effect of data organization and representation than biological reality or new discoveries about gene function. We suggest the GO developers consider the impact on interpretability of additions to GO.
Our third set of findings concerned the confound between GO and other data. We consider ensuring independence of GO from the datasets to which it is being applied as an absolute minimum standard, and our results show that at least some protein interaction data do not meet this standard. Because this does not affect all proteins and functions, we suggest that particular results be checked for confounds as in our case study. For example, a gene that was prioritized on the basis of its having a particular subset of functions should be carefully checked against any other sources of data used.
We also observed an interesting v-shaped relationship between the tendency for genes to have GO annotations from the same citation as PPIs and ‘exceptionality’ of edges associated with the gene (Fig. 4). Because low exceptionality is associated with a high number of GO annotations (Gillis and Pavlidis, 2012), our tentative interpretation is that highly annotated genes will tend to accumulate at least one confounded annotation (low exceptionality and high confound). We further speculate that less-studied genes are more likely to possess functions, which are themselves little studied (and thus knowledge of that gene is critical), and yet because these functions and genes are little studied, they too are likely to draw on overlapping citations (high exceptionality, high confound). The happy medium occurs when divergent lines of evidence point specifically to both interactions and functions.
In our experience, among systems biologists there seems to be a broadly appreciated disjunction between the true utility of GO and how often it is used, even if this is rarely acknowledged in the peer-reviewed literature. The use of GO annotations is often regarded as a minimally interesting validation of results, but not safe to use for discovery purposes. We believe the problems we have identified are among the underlying sources of these mixed feelings about GO. If it is too easy to obtain interesting results using GO, and those results do not consistently hold up, then GO’s use for such purposes is limited. We hope that our concrete suggestions to recognize and possibly correct these issues will help in the development of best practices and help ensure that GO remains useful and relevant to systems biologists.
Supplementary Material
ACKNOWLEDGEMENTS
The authors thank Adriana Sedeño for assistance with the supplementary web site, and Sanja Rogic for critical reading of the manuscript.
Funding: Supported by NIH Grant GM076990, salary awards to PP from the Michael Smith Foundation for Health Research and the Canadian Institutes for Health Research, and postdoctoral fellowships to JG from CIHR, MSFHR, and the MIND Foundation of British Columbia. The funders had no role in study design, data collection and analysis, decision to publish, or preparation of the manuscript.
Conflicts of Interest: none declared.
REFERENCES
- Alterovitz G, et al. GO PaD: the Gene Ontology Partition Database. Nucleic Acids Res. 2007;35:D322–D327. doi: 10.1093/nar/gkl799. [DOI] [PMC free article] [PubMed] [Google Scholar]
- Andorf C, et al. Exploring inconsistencies in genome-wide protein function annotations: a machine learning approach. BMC Bioinformatics. 2007;8:284–284. doi: 10.1186/1471-2105-8-284. [DOI] [PMC free article] [PubMed] [Google Scholar]
- Ashburner M, et al. Gene ontology: tool for the unification of biology. The Gene Ontology Consortium. Nat. Genet. 2000;25:25–29. doi: 10.1038/75556. [DOI] [PMC free article] [PubMed] [Google Scholar]
- Benjamini Y, Hochberg Y. Controlling the False Discovery Rate: a practical and powerful approach to multiple testing. J. R. Stat. Soc. B. 1995;57:12. [Google Scholar]
- Camon E, et al. The Gene Ontology Annotation (GOA) project: Implementation of GO in SWISS-PROT, TrEMBL, and InterPro. Genome Res. 2003;13:662–672. doi: 10.1101/gr.461403. [DOI] [PMC free article] [PubMed] [Google Scholar]
- Cheung WA, Francis Ouellette B, Wasserman WW. Inferring novel gene-disease associations using Medical Subject Heading Over-representation Profiles. Genome Med. 2012;4:75. doi: 10.1186/gm376. [DOI] [PMC free article] [PubMed] [Google Scholar]
- Collins MO, et al. Molecular characterization and comparison of the components and multiprotein complexes in the postsynaptic proteome. J. Neurochem. 2006;97(Suppl. 1):16–23. doi: 10.1111/j.1471-4159.2005.03507.x. [DOI] [PubMed] [Google Scholar]
- Devos D, Valencia A. Intrinsic errors in genome annotation. Trends Genet. 2001;17:429–431. doi: 10.1016/s0168-9525(01)02348-4. [DOI] [PubMed] [Google Scholar]
- Gillis J, Pavlidis P. The impact of multifunctional genes on “Guilt by Association” analysis. PloS One. 2011a;6:e17258–e17258. doi: 10.1371/journal.pone.0017258. [DOI] [PMC free article] [PubMed] [Google Scholar]
- Gillis J, Pavlidis P. The role of indirect connections in gene networks in predicting function. Bioinformatics. 2011b;27:1860–1866. doi: 10.1093/bioinformatics/btr288. [DOI] [PMC free article] [PubMed] [Google Scholar]
- Gillis J, Pavlidis P. “Guilt by Association” is the exception rather than the rule in gene networks. PLoS Comput. Biol. 2012;8:e1002444–e1002444. doi: 10.1371/journal.pcbi.1002444. [DOI] [PMC free article] [PubMed] [Google Scholar]
- Greene CS, Troyanskaya OG. Accurate evaluation and analysis of functional genomics data and methods. Ann. N Y Acad. Sci. 2012;1260:95–100. doi: 10.1111/j.1749-6632.2011.06383.x. [DOI] [PMC free article] [PubMed] [Google Scholar]
- Gross A, et al. Impact of ontology evolution on functional analyses. Bioinformatics. 2012;28:2671–2677. doi: 10.1093/bioinformatics/bts498. [DOI] [PubMed] [Google Scholar]
- Grossmann S, et al. Improved detection of overrepresentation of Gene-Ontology annotations with parent child analysis. Bioinformatics. 2007;23:3024–3031. doi: 10.1093/bioinformatics/btm440. [DOI] [PubMed] [Google Scholar]
- Jantzen SG, et al. GO trimming: systematically reducing redundancy in large Gene Ontology datasets. BMC Res Notes. 2011;4:267. doi: 10.1186/1756-0500-4-267. [DOI] [PMC free article] [PubMed] [Google Scholar]
- Lewis SE. Gene Ontology: looking backwards and forwards. Genome Biol. 2005;6:103. doi: 10.1186/gb-2004-6-1-103. [DOI] [PMC free article] [PubMed] [Google Scholar]
- Lord PW, et al. Semantic similarity measures as tools for exploring the gene ontology. Pac. Symp. Biocomput. 2003;8:601–612. doi: 10.1142/9789812776303_0056. [DOI] [PubMed] [Google Scholar]
- Mistry M, Pavlidis P. Gene Ontology term overlap as a measure of gene functional similarity. BMC Bioinformatics. 2008;9:327. doi: 10.1186/1471-2105-9-327. [DOI] [PMC free article] [PubMed] [Google Scholar]
- Naumoff DG, et al. Retrieving sequences of enzymes experimentally characterized but erroneously annotated: the case of the putrescine carbamoyltransferase. BMC Genomics. 2004;5:52. doi: 10.1186/1471-2164-5-52. [DOI] [PMC free article] [PubMed] [Google Scholar]
- O'Roak BJ, et al. Sporadic autism exomes reveal a highly interconnected protein network of de novo mutations. Nature. 2012;485:246–250. doi: 10.1038/nature10989. [DOI] [PMC free article] [PubMed] [Google Scholar]
- Onsongo G, et al. Generating GO slim using relational database management systems to support proteomics analysis. 21st IEEE International Symposium on Computer-Based Medical Systems. 2008;27:215–217. [Google Scholar]
- Park YR, et al. GOChase: correcting Errors from gene ontology-based annotations for gene products. Bioinformatics. 2005;21:829–831. doi: 10.1093/bioinformatics/bti106. [DOI] [PubMed] [Google Scholar]
- Pena-Castillo L, et al. A critical assessment of Mus musculus gene function prediction using integrated genomic evidence. Genome Biol. 2008;9(Suppl. 1):S2. doi: 10.1186/gb-2008-9-s1-s2. [DOI] [PMC free article] [PubMed] [Google Scholar]
- Rossin EJ, et al. Proteins encoded in genomic regions associated with immune-mediated disease physically interact and suggest underlying biology. PLoS Genet. 2011;7:e1001273. doi: 10.1371/journal.pgen.1001273. [DOI] [PMC free article] [PubMed] [Google Scholar]
- Ruan J, Zhang W. Identifying network communities with a high resolution. Phys. Rev. E Stat. Nonlin. Soft Matter Phys. 2008;77:016104. doi: 10.1103/PhysRevE.77.016104. [DOI] [PubMed] [Google Scholar]
- Schaefer MH, et al. HIPPIE: integrating protein interaction networks with experiment based quality scores. PloS One. 2012;7:e31826–e31826. doi: 10.1371/journal.pone.0031826. [DOI] [PMC free article] [PubMed] [Google Scholar]
- Schnoes AM, et al. Annotation error in public databases: misannotation of molecular function in enzyme superfamilies. PLoS Comput. Biol. 2009;5:e1000605–e1000605. doi: 10.1371/journal.pcbi.1000605. [DOI] [PMC free article] [PubMed] [Google Scholar]
- Škunca N, et al. Quality of computationally inferred gene ontology annotations. PLoS Comput. Biol. 2012;8:e1002533–e1002533. doi: 10.1371/journal.pcbi.1002533. [DOI] [PMC free article] [PubMed] [Google Scholar]
- Subramanian A, et al. Gene set enrichment analysis: a knowledge-based approach for interpreting genome-wide expression profiles. Proc. Natl Acad. Sci. USA. 2005;102:15545–15550. doi: 10.1073/pnas.0506580102. [DOI] [PMC free article] [PubMed] [Google Scholar]
- Thomas PD, et al. On the use of gene ontology annotations to assess functional similarity among orthologs and paralogs: a short report. PLoS Comput. Biol. 2012;8:e1002386–e1002386. doi: 10.1371/journal.pcbi.1002386. [DOI] [PMC free article] [PubMed] [Google Scholar]
- Warde-Farley D, et al. The GeneMANIA prediction server: biological network integration for gene prioritization and predicting gene function. Nucleic Acids Res. 2010;38:W214–W220. doi: 10.1093/nar/gkq537. [DOI] [PMC free article] [PubMed] [Google Scholar]
- White S, Smyth P. Proceedings of the 5th SIAM International Conference on Data Mining. SDM '05. 2005:9. [Google Scholar]
- Yang X, et al. GO-Module: functional synthesis and improved interpretation of Gene Ontology patterns. Bioinformatics. 2011;27:1444–1446. doi: 10.1093/bioinformatics/btr142. [DOI] [PMC free article] [PubMed] [Google Scholar]
Associated Data
This section collects any data citations, data availability statements, or supplementary materials included in this article.