

Vaccination against infectious disease confers both a direct protective effect to the individual receiving the vaccine as well as an indirect “herd protection” effect by reducing the transmission to the rest of the community. In some cases, the indirect population-level benefits may even outweigh the direct individual-level effects of vaccination.1 This article is motivated by the concern that published cost-effectiveness evaluations of vaccination programs are often conducted in comparison to a nonvaccination scenario2–8 and that failure to account for considerations of scale—notably, the vaccination coverage both prior to and after program implementation—can lead analysts to ignore the nonlinear effects of herd protection and may misrepresent the cost-effectiveness of program expansion.
We used a simple model of influenza transmission to show how coverage rates affect cost-effectiveness in the evaluation of vaccination programs when herd protection effects are considered. Specifically, we show how estimates of costs, health outcomes, and cost-effectiveness of the vaccination program change with different levels of vaccination coverage due to the herd protection effect.
METHODS
Disease Transmission Model
A standard susceptible-infectious-recovered (SIR) differential equation model was used to capture influenza transmission dynamics (Figure 1 and Table 1)9 and to estimate the disease incidence at varying levels of vaccination coverage in a population of 100,000 homogeneous, randomly mixing individuals. Vaccination efficacy (ε) was assumed to be 70%.10 The basic reproduction number (R0), the mean number of infectious cases from a single infection in a totally susceptible population, was assumed to be 1.5,11 producing an influenza attack rate of approximately 10% at 35% vaccination coverage, which mirrors the typical influenza season in the US.12 The contact rate was parameterized to generate the R0 value, based on the relationship between the contact rate and basic reproduction number: R0 × γ. The force of infection, λ(t), was obtained by multiplying the contact rate with the proportion of individuals who were infectious at time t. The vaccination program was analyzed over 180 days, corresponding to a typical seasonal influenza epidemic.
Figure 1.
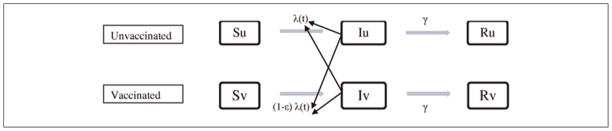
Model of susceptible-infectious-recovered (SIR) disease transmission. λ(t) represents the force of infection, ε represents vaccine efficacy on susceptibility, and γ represents the recovery rate (1/infectious period). Su, Iu, and Ru represent the susceptible, infectious, and recovered population among the unvaccinated, respectively. Sv, Iv, and Rv represent the susceptible, infectious, and recovered population among the vaccinated, respectively.
Table 1.
Model Parameters
| Model Parameters | Values | References |
|---|---|---|
| Epidemiological parameters | ||
| Basic reproduction number (R0)a | 1.5 | Chen and Liao11 |
| Infectious period (1/γ) | 4.1 days | Longini and others27 |
| Vaccination efficacy for infection (ε) | 70% | Bridges and others10 |
| Costs (in 2010 US$) | ||
| Vaccination (per person)b | $33 | Khazeni and others,14 Centers for Disease Control and Prevention16 |
| Influenza treatment (per episode)c | $183 | Lee and others15 |
| Hospitalization (per episode)d | $3862 | Lee and others15 |
| Rates of influenza-related events | ||
| Seeking treatment (per episode)e | 40% | Turner and others,28 Meltzer and others29 |
| Hospitalization (per episode)e | 0.79% | Turner and others,28 Meltzer and others29 |
The basic reproduction number represents the number of secondary cases a typical single infected case will cause in a totally susceptible population.
The cost of vaccination includes the cost of the vaccine ($12.80)16 and vaccine administration ($9.00) evaluated by 10 minutes of nurse wage15 plus the cost of time lost from work (30 minutes) for vaccination ($10.90) reported by the US Bureau of Labor Statistics.15
Influenza treatment costs include costs of antiviral medication (oseltamivir) ($102.70), clinical cost ($14.00), and lost work hours for physician visits (half day) ($66.30).15
Hospitalization costs include the costs of hospitalization ($2598), additional costs of intensive care unit (ICU) treatment ($4883), assuming the probability of being treated at the ICU is 15% given hospitalization,15 and patient time costs (4 days).15
The probabilities of seeking treatment and hospitalization were calculated as the weighted average of the probabilities among high-risk adults and not high-risk adults and children by the distribution of influenza cases given by Meltzer and others.29
Cost-Effectiveness Analysis
We measured program effectiveness in terms of influenza cases averted, an outcome that is fit for the present purpose of estimating the influence of coverage on incremental vaccine cost-effectiveness. We developed model-based estimates of the total number of influenza infections that occur as vaccination coverage varies from 0% to 100% in 10% increments. Incremental effectiveness was calculated in comparison to a 10% reduction in vaccination for each level of vaccination coverage.
We adopted a societal perspective in which all costs were relevant to the analysis.13 The costs of vaccination, treatment, and hospitalization associated with influenza infection were reported14–16 (Table 1). The total cost of vaccine delivery was calculated as the product of a constant unit cost and the number of individuals vaccinated. Treatment costs were calculated by multiplying average costs of the influenza treatment, the disease incidence, and the probability of seeking treatment. Hospitalization costs were calculated by multiplying the hospitalization costs, the disease incidence, and the probability of hospitalization. All costs were adjusted to 2010 US dollars using the Medical Care component of the Consumer Price Index.17
RESULTS
Effectiveness
Although the number of influenza cases decreases monotonically with vaccination coverage, the marginal returns to increased investment rise initially and are maximized at 35% coverage but decline at coverage above 35% (Figure 2A). When there was no vaccination, we observed 58,000 influenza cases, but 10% vaccination coverage averted 10,000 (17%) of those 58,000 cases. Increasing the vaccination coverage to 20%, 30%, and 40% eliminated 36%, 63%, and 95% of the cases, respectively. Because 50% vaccination coverage virtually terminated the epidemic, increasing coverage beyond 50% had almost no incremental impact on cases averted.
Figure 2.

Costs and health outcomes (influenza cases averted) at different levels of vaccination coverage. The basic reproduction number (R0) is 1.5. (A) Total influenza cases averted and additional cases averted. (B) Total costs of vaccination and influenza infection in 2010 US dollars.
Costs
At vaccination coverage up to 40%, the medical cost savings from reduced influenza infection offset the rising costs of increased coverage. At very low vaccination coverage, total costs were dominated by high costs of treatment and hospitalization. In contrast, at vaccination coverage levels sufficient to halt an epidemic, total costs equaled vaccination costs. Total costs were minimized at 46% vaccination coverage, eliminating 99% of cases and their associated costs and sparing 50% of the population the cost of the vaccine (Figure 2B).
Cost-Effectiveness Analysis
Increasing vaccination coverage up to 40% reduces total costs because the savings from reduced treatment and hospitalization offset the expanded costs of vaccination. Thus, all strategies from 0% to 40% coverage are dominated by higher coverage strategies. The incremental cost-effectiveness ratio (ICER) was $1699 per case averted when vaccination coverage increased from 50% to 60% (Table 2). Above 60% coverage, the marginal returns to additional investment in vaccination decreased. Vaccination costs increased linearly with vaccination coverage; however, the number of additional cases averted decreased with increasing coverage. The cost of averting one additional case was $9879 when coverage increased from 60% to 70%. Costs per case averted were 28 times higher when coverage increased from 80% to 90% than when coverage increased from 50% to 60%.
Table 2.
Costs, Incremental Costs and Effectiveness, Incremental Effectiveness, and Incremental Cost-Effectiveness Ratio (ICER) with a Basic Reproduction Number of 1.5
| Vaccination Coverage | No. of Cases | Costsa (Thousands US$) | Incremental Costsb (Thousands US$) | Incremental Effectivenessb (Cases Averted) | ICER Evaluated by Incremental Costs and Benefits (US$ per Case Averted) |
|---|---|---|---|---|---|
| 0% | 58,270 | 6043 | NA | NA | DS |
| 10% | 48,431 | 5353 | –690 | 9839 | DS |
| 20% | 37,294 | 4528 | –825 | 11,137 | DS |
| 30% | 21,619 | 3232 | –1296 | 15,675 | DS |
| 40% | 3071 | 1639 | –1593 | 18,548 | NA |
| 50% | 259 | 1677 | 38 | 2812 | 14 |
| 60% | 76 | 1988 | 311 | 183 | 1699 |
| 70% | 43 | 2314 | 326 | 33 | 9879 |
| 80% | 29 | 2643 | 329 | 14 | 23,500 |
| 90% | 22 | 2972 | 329 | 7 | 47,000 |
| 100% | 18 | 3302 | 330 | 4 | 82,500 |
Note: NA = not applicable; DS = dominated strategies.
Includes costs of vaccination, treatment, and hospitalization.
Incremental costs and effectiveness are calculated in comparison to the next smaller level of vaccination coverage (i.e., 10% lower vaccination coverage).
DISCUSSION
The Panel on Cost-Effectiveness in Health and Medicine recommends that cost-effectiveness analysis be conducted from the societal perspective and that the benefits of an intervention include direct and indirect effects.13 We show that the indirect effects of vaccination introduce fundamental nonlinearities into the relationship between vaccination coverage and costs and that the ICERs of expanded vaccination coverage are consequently scale dependent. Based on incremental costs and benefits, our cost-effectiveness analysis demonstrates that influenza vaccination generates savings in total cost, particularly at lower vaccination coverage, reflecting indirect effects. However, once herd protection terminates transmission, any further increase in vaccination coverage incurs a steady rise in the costs of vaccination, resulting in less favorable ICERs for the same percentage increase in vaccination coverage.
Our finding of the scale dependency of the ICER indicates that cost-effectiveness assessment requires adequate specifications of comparator and target coverage rates, as the incremental costs and benefits of a given percentage improvement in vaccine coverage depend on both the initial and final vaccination rates. This suggests that analysts must take particular care in defining an appropriate baseline comparator and in specifying target coverage rates.
Static models presume a linear relationship between coverage rates and vaccination outcomes. However, nonlinear herd protection effects may exert significant influence over the cost-effectiveness predictions. We show that the use of epidemiological models of disease transmission is essential to account for the scale dependency of cost-effectiveness. In addition to the use of dynamic models to incorporate herd protection effects into cost-effectiveness analyses,14,18,19 other studies have used static models that add a lump sum of costs due to secondary infections into the base cost of each primary infection2,3 or have assumed a linear risk reduction in the nonvaccinated population.20–24 These static methods require that the number of infected individuals remain constant, thus presuming that disease incidence is linearly related to vaccination coverage and constraining predictions regarding the cost-effectiveness of a vaccination program at different levels of vaccination coverage.
One possible limitation of our study is the simplifying assumption that vaccination costs increase linearly with coverage. A more realistic cost function may exhibit increasing marginal costs at higher coverage levels,25,26 resulting from the increasing difficulty of identifying new candidates for vaccination. However, any refinement of our assumption to capture rising vaccination costs at higher coverage levels would most likely strengthen our conclusions because the costs of increasing vaccination coverage would rise faster and result in even less favorable ICERs at higher coverage levels.
Our objective, in this article, was to highlight the influence of total vaccination coverage on cost-effectiveness. To that end, we have employed a simple model that omits the fine detail of influenza epidemiology in exchange for clarity of presentation.
These results may be generalized to other infectious diseases. A particularly promising area of application is the case of relatively new vaccines that experience rapid, widespread adoption. Two examples in the US might be vaccination programs against varicella and human papillomavirus. In each of these instances, vaccine coverage has increased so quickly that assessments of the cost-effectiveness of further expansion will hinge on what is assumed about the baseline comparator and the assumed coverage at baseline.
Although the concept of herd protection is well understood and widely applied in studies of population biology, it has not been fully explored in the context of cost-effectiveness studies. Our study shows that the cost-effectiveness of influenza vaccination depends on the choice of the comparator and the target coverage level evaluated. These findings should inform both cost-effectiveness analyses and resource allocation for vaccination against influenza and other diseases.
Acknowledgments
The authors gratefully acknowledge Drs. Eunha Shim and Jingzhou Liu for their useful comments. This study was supported by the National Institute of Allergy and Infectious Diseases (grant no. R01 AI072706). Dr. Yoko Ibuka received a grant from the Abe Fellowship Program administered by the Social Science Research Council and the American Council of Learned Societies in cooperation with and with funds provided by the Japan Foundation Center for Global Partnership.
Footnotes
The authors declare no conflict of interest.
References
- 1.Pradas-Velasco R, Antonanzas-Villar F, Martinez-Zarate MP. Dynamic modelling of infectious diseases: an application to the economic evaluation of influenza vaccination. Pharmacoeconomics. 2008;26(1):45–56. doi: 10.2165/00019053-200826010-00005. [DOI] [PubMed] [Google Scholar]
- 2.White T, Lavoie S, Nettleman MD. Potential cost savings attributable to influenza vaccination of school-aged children. Pediatrics. 1999;103(6):e73. doi: 10.1542/peds.103.6.e73. [DOI] [PubMed] [Google Scholar]
- 3.Cohen GM, Nettleman MD. Economic impact of influenza vaccination in preschool children. Pediatrics. 2000;106(5):973–6. doi: 10.1542/peds.106.5.973. [DOI] [PubMed] [Google Scholar]
- 4.Luce BR, Zangwill KM, Palmer CS, et al. Cost-effectiveness analysis of an intranasal influenza vaccine for the prevention of influenza in healthy children. Pediatrics. 2001;108(2):E24. doi: 10.1542/peds.108.2.e24. [DOI] [PubMed] [Google Scholar]
- 5.Rothberg MB, Rose DN. Vaccination versus treatment of influenza in working adults: a cost-effectiveness analysis. Am J Med. 2005;118(1):68–77. doi: 10.1016/j.amjmed.2004.03.044. [DOI] [PubMed] [Google Scholar]
- 6.Turner DA, Wailoo AJ, Cooper NJ, Sutton AJ, Abrams KR, Nicholson KG. The cost-effectiveness of influenza vaccination of healthy adults 50–64 years of age. Vaccine. 2006;24(7):1035–43. doi: 10.1016/j.vaccine.2004.12.033. [DOI] [PubMed] [Google Scholar]
- 7.Prosser LA, Bridges CB, Uyeki TM, et al. Health benefits, risks, and cost-effectiveness of influenza vaccination of children. Emerg Infect Dis. 2006;12(10):1548–58. doi: 10.3201/eid1210.051015. [DOI] [PMC free article] [PubMed] [Google Scholar]
- 8.Prosser LA, O’Brien MA, Molinari NA, et al. Non-traditional settings for influenza vaccination of adults: costs and cost effectiveness. Pharmacoeconomics. 2008;26(2):163–78. doi: 10.2165/00019053-200826020-00006. [DOI] [PubMed] [Google Scholar]
- 9.Anderson RM, May RM. Infectious Diseases of Humans: Dynamics and Control. Oxford: Oxford University Press; 1991. [Google Scholar]
- 10.Bridges CB, Fukuda K, Uyeki TM, Cox NJ, Singleton JA. Prevention and control of influenza: recommendations of the Advisory Committee on Immunization Practices (ACIP) MMWR Recomm Rep. 2002;51(RR-3):1–31. [PubMed] [Google Scholar]
- 11.Chen SC, Liao CM. Probabilistic indoor transmission modeling for influenza (sub)type viruses. J Infect. 2010;60(1):26–35. doi: 10.1016/j.jinf.2009.09.015. [DOI] [PubMed] [Google Scholar]
- 12.Chowell G, Miller MA, Viboud C. Seasonal influenza in the United States, France, and Australia: transmission and prospects for control. Epidemiol Infect. 2008;136(6):852–64. doi: 10.1017/S0950268807009144. [DOI] [PMC free article] [PubMed] [Google Scholar]
- 13.Russell LB, Gold MR, Siegel JE, Daniels N, Weinstein MC. The role of cost-effectiveness analysis in health and medicine: Panel on Cost-Effectiveness in Health and Medicine. JAMA. 1996;276(14):1172–7. [PubMed] [Google Scholar]
- 14.Khazeni N, Hutton DW, Garber AM, Hupert N, Owens DK. Effectiveness and cost-effectiveness of vaccination against pandemic influenza (H1N1) 2009. Ann Intern Med. 2009;151(12):829–39. doi: 10.1059/0003-4819-151-12-200912150-00157. [DOI] [PMC free article] [PubMed] [Google Scholar]
- 15.Lee BY, Bacon KM, Donohue JM, Wiringa AE, Bailey RR, Zimmerman RK. From the patient perspective: the economic value of seasonal and H1N1 influenza vaccination. Vaccine. 2011;29(11):2149–58. doi: 10.1016/j.vaccine.2010.12.078. [DOI] [PMC free article] [PubMed] [Google Scholar]
- 16.Centers for Disease Control and Prevention. CDC vaccine price list. 2011 Available from: http://www.cdc.gov/vaccines/programs/vfc/cdc-vac-price-list.htm.
- 17.US Department of Labor, Bureau of Labor and Statistics. Consumer price index: detailed report. Available from: http://www.bls.gov/cpi/#tables.
- 18.Goldie SJ, Kim SY. Cost-effectiveness analyses of vaccination programmes: a focused review of modelling approaches. Pharmacoeconomics. 2008;26(3):191–215. doi: 10.2165/00019053-200826030-00004. [DOI] [PubMed] [Google Scholar]
- 19.Lugner AK, Mylius SD, Wallinga J. Dynamic versus static models in cost-effectiveness analyses of anti-viral drug therapy to mitigate an influenza pandemic. Health Econ. 2010;19(5):518–31. doi: 10.1002/hec.1485. [DOI] [PubMed] [Google Scholar]
- 20.Bergman A, Hjelmgren J, Ortqvist A, et al. Cost-effectiveness analysis of a universal vaccination programme with the 7-valent pneumococcal conjugate vaccine (PCV-7) in Sweden. Scand J Infect Dis. 2008;40(9):721–9. doi: 10.1080/00365540802014872. [DOI] [PubMed] [Google Scholar]
- 21.Isaacman DJ, Strutton DR, Kalpas EA, et al. The impact of indirect (Herd) protection on the cost-effectiveness of pneumococcal conjugate vaccine. Clin Ther. 2008;30(2):341–57. doi: 10.1016/j.clinthera.2008.02.003. [DOI] [PubMed] [Google Scholar]
- 22.Lloyd A, Patel N, Scott DA, Runge C, Claes C, Rose M. Cost-effectiveness of heptavalent conjugate pneumococcal vaccine (Prevenar) in Germany: considering a high-risk population and herd immunity effects. Eur J Health Econ. 2008;9(1):7–15. doi: 10.1007/s10198-006-0013-6. [DOI] [PubMed] [Google Scholar]
- 23.Vespa G, Constenla DO, Pepe C, et al. Estimating the cost-effectiveness of pneumococcal conjugate vaccination in Brazil. Rev Panam Salud Publica. 2009;26(6):518–28. doi: 10.1590/s1020-49892009001200007. [DOI] [PubMed] [Google Scholar]
- 24.Rozenbaum MH, Hoek AJ, Hak E, Postma MJ. Huge impact of assumptions on indirect effects on the cost-effectiveness of routine infant vaccination with 7-valent conjugate vaccine (Prevnar) Vaccine. 2010;28(12):2367–9. doi: 10.1016/j.vaccine.2010.01.005. [DOI] [PubMed] [Google Scholar]
- 25.Johns B, Baltussen R. Accounting for the cost of scaling-up health interventions. Health Econ. 2004;13(11):1117–24. doi: 10.1002/hec.880. [DOI] [PubMed] [Google Scholar]
- 26.Johns B, Torres TT. Costs of scaling up health interventions: a systematic review. Health Policy Plan. 2005;20(1):1–13. doi: 10.1093/heapol/czi001. [DOI] [PubMed] [Google Scholar]
- 27.Longini IM, Jr, Halloran ME, Nizam A, Yang Y. Containing pandemic influenza with antiviral agents. Am J Epidemiol. 2004;159(7):623–33. doi: 10.1093/aje/kwh092. [DOI] [PubMed] [Google Scholar]
- 28.Turner D, Wailoo A, Nicholson K, Cooper N, Sutton A, Abrams K. Systematic review and economic decision modelling for the prevention and treatment of influenza A and B. Health Technol Assess. 2003;7(35):iii–iv. xi–xiii, 1–170. doi: 10.3310/hta7350. [DOI] [PubMed] [Google Scholar]
- 29.Meltzer MI, Cox NJ, Fukuda K. The economic impact of pandemic influenza in the United States: priorities for intervention. Emerg Infect Dis. 1999;5(5):659–71. doi: 10.3201/eid0505.990507. [DOI] [PMC free article] [PubMed] [Google Scholar]