

Abstract
Background
Lipoprotein lipase (LPL) and serum 25-hydroxyvitamin D [25(OH)D] play important roles in the regulation of lipid metabolism. Although dyslipidemia is associated with insulin resistance (IR) and type 2 diabetes (T2D), there are limited data available regarding the relationship of LPL and 25(OH)D to IR and T2D at a population level. The objective of the present study is to investigate the associations of LPL and 25(OH)D with IR and T2D in a Chinese population.
Methods
The study cohort consisted of 2708 subjects (1326 males, 1382 females; mean age 48.5 ± 12.6 years) in main communities of Harbin, China. Serum 25(OH)D, LPL, free fatty acids (FFAs), fasting glucose (FG), fasting insulin, lipid profile, apoA and apoB concentrations were measured.
Results
Serum 25(OH)D concentration was positively associated with LPL (β = 0.168, P < 0.001). LPL was inversely associated with IR and T2D. Subjects in the lowest quartile of LPL had the highest risk of IR [odds ratio (OR) = 1.85, 95% CI = 1.22-2.68] and T2D (OR = 1.65, 95% CI = 1.14-2.38). Serum 25(OH)D was also inversely associated with IR and T2D. Vitamin D deficiency [25(OH)D < 20 ng/ml] was associated with an increasing risk of IR (OR = 1.91, 95% CI = 1.23-2.76) and T2D (OR = 2.06, 95% CI = 1.37-3.24). The associations of 25(OH)D with IR and T2D were attenuated by further adjustment for LPL.
Conclusions
LPL is associated with serum 25(OH)D, IR and T2D in the Chinese population. These results suggest a potential mediating role of LPL in the associations of 25(OH)D with IR and T2D.
Keywords: Lipoprotein lipase, Vitamin D, Diabetes, Insulin resistance, Lipid metabolism
Background
Lipoprotein lipase (LPL) is a member of the so-called lipase superfamily which includes hepatic lipase, pancreatic lipase and LPL itself [1]. Although it is mainly synthesized by the parenchymal cells in adipose, skeletal and cardiac muscle, LPL has its physiological site of action at the capillary endothelial cell surface where the enzyme catalyzes the lipolysis of triglyceride (TG) to provide free fatty acids (FFAs) and 2-monoacylglycerol for tissue utilization [2,3]. Therefore, LPL plays a central role in lipid metabolism and is widely distributed in various tissues. In addition to its effect on the lipid metabolism, LPL is also directly or indirectly implicated in some pathophysiological conditions such as insulin resistance (IR) and type 2 diabetes (T2D). Reduction of LPL is observed in patients with T2D and individuals with IR [4-6]. Low LPL activity accompanied by high TG was observed in diabetic dyslipidemia [7].
In addition to LPL, vitamin D also plays an important role in the regulation of lipid metabolism. Over the past decades, numerous studies have shown that individuals with vitamin D deficiency are at an increasing risk for a disorder of lipid metabolism [8,9]; serum 25-hydroxyvitamin D [25(OH)D], the main circulating form of vitamin D, is significantly associated with lipid metabolism [10].
Despite a large body of literature in this regard, the relationship between LPL and vitamin D is not fully understood. Existing evidence suggested that treatment with 1,25-Dihydroxyvitamin D [1,25(OH)2D], the active form of vitamin D, could induce the LPL expression in cells [11]; however, few epidemiological studies have been so far designed to investigate the association between vitamin D and LPL at a population level. Furthermore, although it is known that dyslipidemia is associated with IR and T2D, information is limited on the association between LPL, 25(OH)D, IR and T2D in population studies. Importantly the role of LPL in linking 25(OH)D, IR and T2D is largely unknown. The objective of this cross-sectional epidemiologic study is to examine the relationship among LPL, 25(OH)D, IR and T2D in the northeastern Chinese population.
Methods
Study cohort
The source population consisted of 8127 adults, aged 20 to 74 years, who were recruited from main communities of Harbin, China [12]. In the current study, 3000 individuals (1500 males, 1500 females) were randomly selected from the source population between August and October 2008. After 292 subjects were excluded, the final study sample comprised a total of 2708 subjects (1326 males, 1382 females; mean age 48.5 ± 12.6 years). The exclusion criteria were any disorders or history known to alter vitamin D metabolism; drug or alcohol abuse or dependence; severe liver diseases including hepatitis, cirrhosis, or malignancy; under regular medication for controlling blood lipids; no signed informed consent. There were no significant differences between participants (2708 subjects) and the source population (8127 subjects) in age and BMI. Design and all procedures of the present study were in accordance with the Declaration of Helsinki. This study was approved by the Ethics Committee of the Harbin Medical University, and all subjects provided signed informed consent.
Data collection
Demographic and lifestyle data were obtained using a general structured questionnaire. Body mass index (BMI, kg/m2) was calculated as weight in kilograms divided by the square of the height in meters. The physical activity level (PAL) was calculated with the formula from the American Institute of Medicine [13]. Blood samples were collected in tubes from each subject after fasting for 10 hours for laboratory analyses of study variables. The blood samples were immediately centrifuged at 2500 g for 15 min to obtain serum which was instantly cooled down, stored at −80 centigrade. Fasting serum glucose (FG) and 2-h post-load (75 g sugar) glucose (PG) for oral glucose tolerance test (OGTT) were measured quantitatively by the glucose oxidase method. Concentrations of total cholesterol (TC), high- (HDL) and low-density lipoprotein (LDL) cholesterols, TG, FFAs, apoA and apoB were assessed with standard enzymatic methods in an auto-analyzer (AUTOLAB PM 4000, AMS Corporation, Rome, Italy). Serum insulin was measured with an auto-analyzer using commercial kits (Centaur, Bayer Corporation, Bayer Leverkusen, Germany). LPL concentration in the post-heparin serum collected in 10 minutes after intravenous injection of 30 IU/kg heparin was measured by enzyme-linked immunosorbent assay (ELISA) using commercially available ELISA Kits (R&D System, USA). The inter-assay coefficient and intra-assay coefficient of LPL were 6.28% and 7.04%, respectively. Homeostasis model of assessment of insulin resistance (HOMA-IR) was calculated as HOMA-IR = Fasting glucose (mmol/L) × Fasting insulin (mU/L)/22.5. Serum 25(OH)D concentrations were determined by ACQUITY Ultra Performance Liquid Chromatography (Waters, USA). The inter-assay coefficient and intra-assay coefficient of 25(OH)D at 20 ng/mL were 4.69% and 3.72%, respectively. IR was defined as HOMA-IR higher than 2.50. T2D was defined as FG ≥ 7.0 mmol/L, or PG ≥ 11.1 mmol/L on a 2-h OGTT [14], or a diagnosis of diabetes. Vitamin D deficiency was defined as serum 25(OH)D concentrations < 20 ng/ml (50 nmol/L), insufficiency 21-29 ng/ml, and sufficiency ≥ 30 ng/ml (75 nmol/L) [15]. Suboptimal D status was defined as vitamin D deficiency or vitamin D insufficiency.
Statistical analysis
Characteristics of study variables were presented as mean ± SD, or median for continuous variables and as percentage for categorical variables. Log-transformation was performed to improve normality of the distribution where necessary. Analysis of covariance (ANCOVA) was used to assess differences in study variables between subgroups classified by levels of LPL and 25(OH)D, with post hoc Bonferroni's correction for multiple comparisons. The associations between 25(OH)D and continuous variables such as LPL and FFAs were tested by multivariable linear regression analysis, adjusted for covariates (age, sex, BMI, PAL, smoking and alcohol use). The associations of serum 25(OH)D and LPL with IR and T2D were tested by logistic regression analysis, adjusted for the above covariates. In order to evaluate the influence of individual covariates (age, sex, BMI, PAL, smoking and alcohol use) on the association parameters (ORs), logistic regression models were performed separately by excluding the covariates one by one from the model and including the remaining variables. The changes in OR values reflect the influence of the variable removed from the model on the particular association. Statistical analyses were performed with SPSS software version 16.0 (SPSS Inc., Chicago, IL), and P value < 0.05 was considered statistically significant.
Results
Characteristics of study variables
The characteristics for study variables are shown in Table 1 by sex groups. Mean serum 25(OH)D concentration of the total sample was 25.4 ± 6.5 ng/ml. The prevalence of suboptimal vitamin D (vitamin D deficiency and insufficiency), IR and T2D in 2708 subjects was 74.7%, 19.5% and 15.9%, respectively.
Table 1.
Demographic and clinical characteristics for males and femalesa
| Males | Females | P | |
|---|---|---|---|
| N |
1326 |
1382 |
|
|
Basic characteristics |
|
|
|
| Age, y |
47.6 ± 11.3 |
49.4 ± 13.1 |
<0.001 |
| BMI, kg/m2 |
25.7 ± 3.8 |
25.2 ± 3.3 |
0.002 |
| Physical activity level |
1.45 ± 0.40 |
1.49 ± 0.42 |
0.011 |
| Insulin Resistance, n (%) |
288 (21.7) |
240 (17.4) |
0.004 |
| Type 2 diabetes, n (%) |
243 (18.3) |
189 (13.7) |
<0.001 |
| Obesity, n (%) |
273 (20.6) |
283 (20.5) |
0.943 |
| Alcohol use, n (%) |
797 (60.1) |
170 (12.3) |
<0.001 |
| Smoking, n (%) |
|
|
<0.001 |
| Never |
541 (40.8) |
1273 (92.1) |
|
| Past |
164 (12.4) |
23 (1.7) |
|
| Current |
621 (46.8) |
86 (6.2) |
|
|
Clinical variables |
|
|
|
| 25(OH)D, ng/ml |
25.7 ± 6.7 |
25.1 ± 6.4 |
0.017 |
| FG, mmol/L |
5.1 (3.6-9.2) |
4.9 (3.4-10.3) |
0.054 |
| PG, mmol/L |
7.9 (3.8-14.5) |
7.6 (3.5-13.6) |
0.011 |
| HbAlc, % |
4.3 (3.4-11.7) |
3.9 (3.3-11.5) |
0.002 |
| Insulin, mU/L |
6.1 (1.5-17.5) |
6.0 (1.4-16.8) |
0.051 |
| HOMA-IR |
1.4 (0.3-6.2) |
1.3 (0.3-6.0) |
0.011 |
| TC, mmol/L |
4.8 ± 1.1 |
4.9 ± 1.2 |
0.024 |
| TG, mmol/L |
1.7 (0.5-6.1) |
1.5 (0.4-5.9) |
<0.001 |
| HDL-C, mmol/L |
1.5 (0.8-2.3) |
1.5 (0.7-2.4) |
0.286 |
| LDL-C, mmol/L |
3.0 (0.6-5.2) |
2.9 (0.5-5.4) |
0.118 |
| apoA, mmol/L |
1.8 ± 0.4 |
2.0 ± 0.4 |
<0.001 |
| apoB, mmol/L |
0.8 ± 0.2 |
0.7 ± 0.3 |
<0.001 |
| FFAs, μmol/L |
723.8 ± 293.7 |
729.4 ± 265.4 |
0.602 |
| LPL, U/L | 653.1 ± 187.8 | 664.3 ± 193.5 | 0.127 |
a Data are presented as n(%), means ± SD or median (range). χ2 test or ANOVA were adopted to compare differences between males and females.
Abbreviations: FFAs, free fatty acids; FG, fasting serum glucose; HOMA-IR, Homeostasis model of assessment - insulin resistance; LPL, lipoprotein lipase; PG, 2 h post-load glucose; TC, total cholesterol; HDL-C, high-density lipoprotein cholesterol; LDL-C, low-density lipoprotein cholesterol; TG, triglyceride.
Differences in variables among quartiles of LPL
Table 2 shows differences in study variables among LPL quartile groups. BMI values and prevalence of obesity decreased with increasing LPL quartiles, but the trend was borderline significant. All metabolic variables had significantly increasing or decreasing trends across LPL quartile groups except for insulin, TC and apoB. LDL-C had a marginally significant decreasing trend across LPL quartile groups (P = 0.068).
Table 2.
Characteristics of study variables by lipoprotein lipase quartile groupsa
| Quartiles of LPL (U/L) | |||||
|---|---|---|---|---|---|
| |
Q 1 (< 532.8) |
Q 2 (532.9 - 653.2) |
Q 3 (653.3 - 778.6) |
Q 4 (> 778.6) |
P |
|
N |
677 |
677 |
677 |
677 |
|
|
Basic characteristics |
|
|
|
|
|
| Age, y |
49.2 ± 12.6 |
47.9 ± 12.3 |
48.3 ± 10.1 |
48.6 ± 11.4 |
0.213 |
| BMI, kg/m2 |
25.6 ± 3.8 |
25.2 ± 3.5 |
25.3 ± 3.6 |
25.1 ± 3.1 |
0.053 |
| Physical activity level |
1.49 ± 0.39 |
1.46 ± 0.47 |
1.50 ± 0.44 |
1.47 ± 0.38 |
0.283 |
| Obesity, n (%) |
158 (23.3) |
142 (21.0) |
135 (19.9) |
121 (17.9) |
0.093 |
|
Metabolic variables |
|
|
|
|
|
| 25(OH)D, ng/ml |
23.1 ± 6.7 |
24.6 ± 6.3 |
26.4 ± 6.2 |
27.8 ± 7.1 |
<0.001 |
| FG, mmol/L |
5.2 (3.5-11.5) |
5.0 (3.3-10.8) |
4.9 (2.8-10.7) |
4.9 (3.0-11.2) |
0.021 |
| PG, mmol/L |
8.0 (3.6-13.3) |
7.7 (3.5-12.7) |
7.6 (3.1-12.1) |
7.4 (3.0-12.4) |
0.008 |
| HbAlc, % |
4.3 (3.2-11.9) |
4.2 (3.3-12.5) |
4.0 (3.2-11.4) |
3.9 (3.2-11.7) |
<0.001 |
| Insulin, mU/L |
6.0 (1.4-17.6) |
5.8 (1.5-17.9) |
5.9 (1.6-17.7) |
5.8 (1.4-18.1) |
0.149 |
| HOMA-IR |
1.5 (0.3-6.6) |
1.4 (0.4-6.4) |
1.4 (0.2-6.0) |
1.3 (0.3-5.9) |
<0.001 |
| TC, mmol/L |
4.8 ± 1.2 |
4.7 ± 1.1 |
4.9 ± 1.3 |
4.8 ± 1.2 |
0.201 |
| TG, mmol/L |
1.9 (0.6-6.2) |
1.8 (0.5-6.0) |
1.5 (0.7-5.6) |
1.5 (0.6-5.9) |
<0.001 |
| HDL-C, mmol/L |
1.4 (0.7-2.1) |
1.4 (0.6-2.4) |
1.5 (0.7-2.3) |
1.5 (0.8-2.5) |
0.032 |
| LDL-C, mmol/L |
3.0 (0.7-5.3) |
3.0 (0.6-5.1) |
2.9 (0.5-4.9) |
2.9 (0.5-5.2) |
0.068 |
| apoA, mmol/L |
1.9 ± 0.4 |
1.9 ± 0.5 |
2.0 ± 0.4 |
2.1 ± 0.5 |
<0.001 |
| apoB, mmol/L |
0.8 ± 0.2 |
0.8 ± 0.3 |
0.8 ± 0.2 |
0.8 ± 0.3 |
0.470 |
| FFAs, μmol/L | 776.4 ± 293.2 | 741.3 ± 295.4 | 713.2 ± 289.7 | 685.4 ± 278.5 | <0.001 |
a Data are presented as n(%), means ± SD or median (range). χ2 test or ANOVA were adopted to compare the difference among LPL quartile groups.
Abbreviations: FFAs, free fatty acids; FG, fasting serum glucose; LPL, lipoprotein lipase; PAL, Physical activity level; PG: 2 h post-load glucose; TC, total cholesterol; HDL-C, high-density lipoprotein cholesterol; LDL-C, low-density lipoprotein cholesterol; TG, triglyceride.
The association of serum 25(OH)D with LPL and other metabolic variables
The effects of 25(OH)D and LPL on metabolic variables were further examined with ANCOVA as summarized in Table 3. After adjusted for age, sex, BMI, PAL, smoking and alcohol consumption, subjects with vitamin D deficiency indicated significant differences in metabolic variables compared with vitamin D sufficiency group except for insulin, TC, LDL-C and apoB. In subjects with vitamin D insufficiency, selected metabolic variables had significant differences when compared with vitamin D sufficiency group. Of interest, subjects in both vitamin D deficiency and insufficiency groups had significantly lower LPL values than those in vitamin D sufficiency group (P < 0.05).
Table 3.
Means or medians by serum 25 (OH)D status and regression coefficients of serum 25(OH)D on metabolic variables
|
Dependent variables |
Serum 25 (OH)D statusa |
Regression model 1b |
Regression model 2c |
||||
|---|---|---|---|---|---|---|---|
| Deficiency (<20 ng/ml) | Insufficiency (20-29 ng/ml) | Sufficiency (>30 ng/ml) | β | P | β | P | |
|
Subjects (n) |
422 |
1602 |
684 |
|
|
|
|
|
FG, mmol/L |
5.3 (3.6-11.5)* |
5.0 (3.1-9.3) |
4.9 (2.7-8.8) |
−0.086 |
0.011 |
−0.055 |
0.034 |
|
PG, mmol/L |
8.5 (3.7-13.9)* |
7.8 (3.5-12.4) |
7.7 (3.2-12.1) |
−0.091 |
0.002 |
−0.058 |
0.027 |
|
HbAlc, % |
4.4 (3.3-11.5)** |
4.2 (3.2-11.8)** |
4.0 (3.3-11.6) |
−0.120 |
<0.001 |
−0.082 |
0.012 |
|
Insulin, mU/L |
5.9 (1.5-16.9) |
6.1 (1.4-17.8) |
6.0 (1.6-18.1) |
−0.045 |
0.051 |
−0.042 |
0.058 |
|
HOMA-IR |
1.5 (0.3-6.5)** |
1.4 (0.3-6.1)* |
1.3 (0.3-5.8) |
−0.127 |
<0.001 |
−0.048 |
0.047 |
|
TC, mmol/L |
5.0 ± 1.2 |
4.8 ± 1.3 |
4.8 ± 1.2 |
−0.014 |
0.532 |
−0.015 |
0.525 |
|
TG, mmol/L |
1.8 (0.8-6.3)* |
1.6 (0.5-6.1) |
1.5 (0.6-5.8) |
−0.093 |
0.001 |
−0.043 |
0.056 |
|
HDL-C, mmol/L |
1.4 (0.7-2.2)* |
1.5 (0.8-2.4) |
1.5 (0.8-2.3) |
0.117 |
<0.001 |
0.084 |
0.011 |
|
LDL-C, mmol/L |
3.0 (0.8-5.3) |
2.9 (0.7-5.2) |
2.9 (0.5-5.5) |
−0.021 |
0.431 |
−0.018 |
0.513 |
|
apoA, mmol/L |
1.9 ± 0.4* |
2.0 ± 0.4 |
2.0 ± 0.3 |
0.089 |
0.005 |
0.052 |
0.028 |
|
apoB, mmol/L |
0.8 ± 0.2 |
0.8 ± 0.3 |
0.8 ± 0.2 |
0.024 |
0.353 |
0.022 |
0.358 |
|
FFAs, μmol/L |
778.6 ± 284.8** |
734.5 ± 306.4* |
672.8 ± 297.5 |
−0.145 |
<0.001 |
−0.077 |
0.021 |
| LPL, U/L | 615.3 ± 192.4** | 658.8 ± 196.6* | 691.2 ± 194.1 | 0.168 | <0.001 | NA | NA |
a Means ± SD or medians ( range). * P < 0.05, ** P < 0.01, compared with vitamin D sufficiency group by ANCOVA, adjusted for age, sex, BMI, physical activity level, smoking and alcohol consumption.
b Multivariable linear regression analyses model 1, with 25(OH)D concentration as the independent variable, adjusted for age, sex, BMI, physical activity level, smoking and alcohol consumption.
c Multivariable linear regression analyses model 2, with 25(OH)D concentration as the independent variable adjusted for covariates in model 1 + LPL.
Abbreviations: FFAs, free fatty acids; FG, fasting serum glucose; LPL, lipoprotein lipase; PAL, Physical activity level; PG: 2 h post-load glucose; TC, total cholesterol; HDL-C, high-density lipoprotein cholesterol; LDL-C, low-density lipoprotein cholesterol; TG, triglyceride; β, regression coefficients.
In multivariable linear regression analysis model 1, with 25(OH)D as the independent variable, adjusted for the same confounding factors in ANCOVA above, 25(OH)D was significantly associated with all metabolic variables except for TC, LDL-C and apoB, and marginally associated with insulin (P = 0.051). In regression model 2, inclusion of LPL did not substantially change the regression parameters; however, the association between TG and 25(OH)D was weakened when LPL was included in model 2.
The relationship of vitamin D and LPL to IR and T2D
Table 4 presents association parameters (OR and 95% CI) of serum 25(OH)D and LPL with IR and T2D from logistic regression models. In model 1, subjects with vitamin D deficiency were 1.91 and 2.06 times more likely to develop IR and T2D, respectively. In model 2 these association parameters were attenuated by the inclusion of LPL which was positively associated with serum 25(OH)D. Lower LPL was significantly associated with a higher risk of IR and T2D. The associations became stronger with decreasing quartiles of LPL. Compared with subjects in the top LPL quartile group, the risk was 1.85 times higher for IR and 1.65 times higher for T2D among those in the bottom LPL quartile group.
Table 4.
Associations of serum 25(OH)D and LPL with IR and T2D
| 25(OH)D (ng/ml) | Quartiles of LPL (U/L) | |||||||||
|---|---|---|---|---|---|---|---|---|---|---|
| |
Deficiency |
Insufficiency |
Sufficiency |
Q 1 |
Q 2 |
Q 3 |
Q 4 |
|||
| |
(< 20.0) |
(20.1-29.9) |
(≥ 30.0) |
(≤ 532.8) |
(532.9-653.2) |
(653.3-778.6) |
(> 778.6) |
|||
|
IR, OR (95% CI) | ||||||||||
| Cases/Non-cases |
101/321 |
324/1278 |
103/581 |
159/518 |
143/534 |
128/549 |
98/579 |
|||
| Model 1 |
1.91 (1.23-2.76) |
1.42 (1.04-1.87) |
1.00 (reference) |
1.85 (1.22-2.68) |
1.51 (1.03-2.25) |
1.32 (0.91-1.93) |
1.00 (reference) |
|||
| Model 2 |
1.35 (1.12-2.45) |
1.13 (1.02-1.82) |
1.00 (reference) |
NA |
NA |
NA |
NA |
|||
|
T2D, OR (95% CI) | ||||||||||
| Cases/Non-cases |
87/335 |
269/1333 |
76/608 |
124/553 |
113/564 |
101/576 |
94/583 |
|||
| Model 1 |
2.06 (1.37-3.24) |
1.57 (1.12-2.29) |
1.00 (reference) |
1.65 (1.14-2.38) |
1.41 (1.07-2.25) |
1.29 (0.84-1.96) |
1.00 (reference) |
|||
| Model 2 | 1.42 (1.09-2.68) | 1.10 (1.03-1.93) | 1.00 (reference) | NA | NA | NA | NA | |||
Model 1, adjusted for age, sex, BMI, PAL, smoking and alcohol consumption.
Model 2, adjusted for covariates in model 1 + LPL.
25(OH)D, 25-hydroxyvitamin D; IR, insulin resistance; T2D, type 2 diabetes; LPL, lipoprotein lipase; PAL, physical activity level.
The effects of demographic and lifestyle variables on association parameters
In the evaluation analysis of the influence of individual covariates (age, sex, BMI, PAL, smoking and alcohol use) on the association parameters (ORs) in Table 4, BMI showed a marked influence on the association of vitamin D with IR and T2D. Other covariates did not substantially affect the OR values.
Discussion
Among 2708 northeastern Chinese adults in the current study, the main findings were that LPL was positively associated with serum 25(OH)D concentration; LPL and serum 25(OH)D concentration were inversely associated with the prevalence of IR and T2D; whereas the associations of 25(OH)D with IR and T2D were attenuated by further adjusted for LPL. To the best of our knowledge, this is the first epidemiological study reporting the association between serum 25(OH)D and LPL in the Chinese population.
Vitamin D and type 2 diabetes
The rapid economic development has been accompanied by westernization of lifestyle behaviors and an increasing epidemic of obesity and metabolic syndrome in China during the past couple of decades. Consequently, the incidence and prevalence of T2D has been rapidly rising and has become a major public health problem in China as well as in developed countries [16-18]. Previous survey indicated the prevalence of T2D is 8.8% in the source population (n=8940) recruited in Harbin, China [19]. In the present study cohort, the percentage of T2D is 15.9%. Different source population size and the exclusion of 292 non-diabetic subjects from the present study accounted for the difference in the two prevalence rates. Furthermore, the sampling bias may partially explain the difference.
Individuals with low serum 25(OH)D concentration are at increasing risk for dyslipidemia, IR and T2D [20-22]. However, the relationship between vitamin D status and metabolic syndrome needs to be further investigated since the results from previous studies are controversial. For instance, studies of the British Cohort and nationally representative sample of the U.S. population both reported an inverse association between serum 25(OH)D concentration and metabolic syndrome [21,23], but another study in obese population did not find such a association [24]. Considering a strong link between diabetes and metabolic syndrome, the inverse association between 25(OH)D and T2D observed in our study supported the notion that vitamin D is associated with metabolic syndrome.
The favorable effect of improvement in vitamin D on T2D could be explained by its direct effect on insulin action. 1,25(OH)2D enhances insulin responsiveness for glucose transport by stimulating the expression of insulin receptor in peripheral tissue [25]. Besides, supplementation of vitamin D in experimental diabetic models significantly improved the concentration and integrity of the elastic lamellae in the medial layer of the aorta, and prevented fragmentation of elastic fibers in the aortic media [26].
Recently, a prospective intervention study indicated that 18 months vitamin D supplementation on adult patients with T2D significantly improved lipid profile with a favorable change in HDL/LDL ratio [27]. Considering that significant associations between serum 25(OH)D and lipid profile such as TG and HDL were also observed in our study, it is possible that the disorder of lipid metabolism may partially mediate the pathogenesis of IR and T2D caused by vitamin D deficiency. Therefore, LPL was introduced and investigated due to its primary role in the overall lipid metabolism.
LPL linking vitamin D and type 2 diabetes
As a major enzyme responsible for lipolysis of circulating lipoproteins, LPL can be activated by PPAR through agonists, and inactivated by angiopoietin-like protein 4 [28]. Research carried out in the population over the past few years suggested an inverse association between LPL and TG [29]. Despite the fact that capillary endothelial cell surface is the physiological site of LPL-mediated hydrolysis reaction, adipose tissue is one of the most dominant sites for the synthesis of LPL [2,30]. Previous in vitro studies have shown that incubation with 1,25(OH)2D significantly increased LPL activity and mRNA in cultured adipocytes [31] and induced LPL expression in 3 T3-L1 cells [11]. If in vivo studies showed a similar effect of 1,25(OH)2D on LPL expression, it would be helpful to investigate the role of LPL in the association between vitamin D and glucose-lipid metabolism. Serum 25(OH)D concentration was positively associated with LPL in the present study. This result is helpful to explain the inverse association between serum 25(OH)D and TG, since hydrolysis reaction mediated by LPL will result in a decrease of TG in serum (Figure 1). Although supported by previous in vitro studies, the observed association between 25(OH)D and LPL in this population still needs to be confirmed in other studies.
Figure 1.
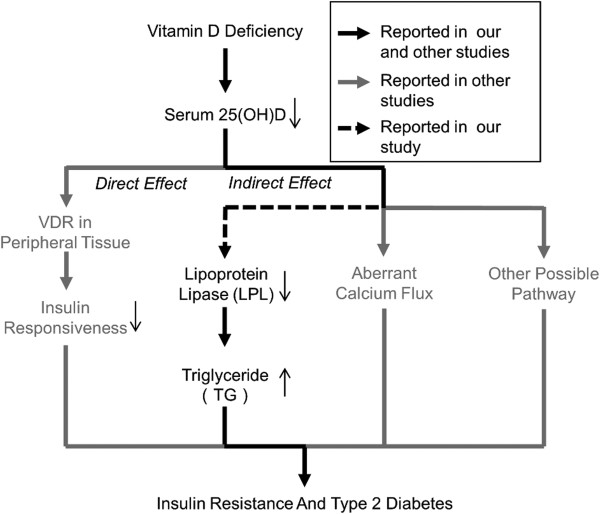
Putative scheme of effect of vitamin D on insulin resistance and type 2 diabetes. Vitamin D deficiency influences the pathogenesis of insulin resistance and type 2 diabetes by direct effect such as decreased binding to vitamin D receptor (VDR), and indirect effect such as aberrant calcium flux. Reductive serum 25(OH)D concentration was accompanied with decreased LPL and increased TG in our study, which might be associated with insulin resistance and type 2 diabetes.
Additionally, LPL was found to be inversely and independently associated with IR and T2D in the present study. Since further adjusted for LPL markedly attenuated the associations of 25(OH)D with IR and T2D, the finding suggested that associations of 25(OH)D with IR and T2D might be partially mediated by LPL. Certainly, further studies are needed to clarify this concept.
Serum FFAs concentration was also introduced in the present study. It is well established that abnormality of serum FFAs concentration plays an important role in the pathological incidence and development of IR and T2D, but data on the association between serum 25(OH)D and FFAs at a population level are still limited. In our study, serum 25(OH)D was inversely associated with FFAs even after adjusted for confounding factors. Despite the unknown mechanisms, previous in vitro studies provided the following two aspects to explain the association between 25(OH)D and FFAs. Firstly, activation of PPAR-δ by 1,25(OH)2D [32] will induce decreased FFAs concentrations because of increased fat oxidation and utilization of fatty acids by skeletal muscle [33]; secondly, treatment with 1,25(OH)2D could result in promotion of fatty acid synthesis and inhibition of lipolysis [34,35] in adipocytes, and hence the serum FFAs concentration was increased under vitamin D deficiency status.
Prevalence of suboptimal vitamin D
High prevalence of suboptimal vitamin D has been a worldwide health problem. It is estimated that at least 30% of the general population in North America, Europe, Asia and Australasia has vitamin D deficiency [36]. However, Data from epidemiologic studies with large samples in northeastern China are still limited in this regard. Due to the high latitude of northeastern China, sunshine in this area is relatively inadequate, thus residents living in this area are at high risk of vitamin D deficiency [37]. According to the findings from previous survey [37], a majority of northeastern Chinese adults (>70%) was estimated to be in suboptimal vitamin D status. It is well known that the season when blood is collected is one of the influencing factors of vitamin D concentration. In the current study, all serum samples were collected between August and October when the sunshine is relatively abundant in this area. A comparison study on vitamin D concentrations in different seasons may provide more information in the northeastern area in China.
Limitations and strengths
The present study is cross-sectional in nature; therefore the causal relationships between serum 25(OH)D, LPL, IR and T2D cannot be examined. Furthermore, LPL activity was not measured. The main strength of the present study is that the study cohort is representative of the source population with a large sample size. This is the first epidemiological study investigating the associations of serum LPL with 25(OH)D, IR and T2D in the population in China.
Conclusions
The present study indicates that LPL is significantly associated with serum 25(OH)D, IR and T2D, adjusted for confounding factors. The associations of 25(OH)D with IR and T2D may be partially mediated by changes in LPL concentrations. Further in vivo, vitro and population studies are needed to replicate the findings from the current study.
Abbreviations
ANOVA: analysis of variance; ANCOVA: analysis of covariance; BMI: body mass index; FFAs: free fatty acids; FG: fasting serum glucose; HOMA-IR: homeostatic model assessment of insulin resistance; IR: insulin resistance; LPL: lipoprotein lipase; OGTT: oral glucose tolerance test; PAL: Physical activity level; PG: 2-h post-load glucose; TC: total cholesterol; HDL: high-density lipoprotein cholesterol; LDL: low-density lipoprotein cholesterol; TG: triglyceride; T2D: type 2 diabetes; 25(OH)D: 25-hydroxyvitamin D.
Competing interests
The authors declare that they have no competing interests.
Authors’ contributions
CHS and YL designed the research; YFH, MQW, HN and LMA conducted research; YFH, XXL, YL and MQW analyzed and interpreted the data; YFH wrote the paper; YFH, XXL, YL and CHS had primary responsibility for final content. All authors read and approved the final manuscript.
Contributor Information
Yifan Huang, Email: yyzhyf@hotmail.com.
Xiaoxia Li, Email: lxx1413@163.com.
Maoqing Wang, Email: wang_maoqing@yahoo.com.
Hua Ning, Email: ninghua188@126.com.
Lima A, Email: alima9508@126.com.
Ying Li, Email: liying_helen@163.com.
Changhao Sun, Email: sun2002changhao@yahoo.com.
Acknowledgements
We would like to thank all study subjects for their participation and cooperation. This study is supported by grants from the National Natural Science Foundation of China (No.81130049), National High Technology Research and Development Program of China (863 Program) (No.2010AA023002).
References
- Hide WA, Chan L, Li WH. Structure and evolution of the lipase superfamily. Journal of lipid research. 1992;33(2):167–178. [PubMed] [Google Scholar]
- Mead JR, Irvine SA, Ramji DP. Lipoprotein lipase: structure, function, regulation, and role in disease. J Mol Med (Berl) 2002;80(12):753–769. doi: 10.1007/s00109-002-0384-9. [DOI] [PubMed] [Google Scholar]
- Goldberg IJ, Merkel M. Lipoprotein lipase: physiology, biochemistry, and molecular biology. Frontiers in bioscience: a journal and virtual library. 2001;6:D388–D405. doi: 10.2741/goldberg. [DOI] [PubMed] [Google Scholar]
- Hanyu O, Miida T, Kosuge K, Ito T, Soda S, Hirayama S, Wardaningsih E, Fueki Y, Obayashi K, Aizawa Y. Preheparin lipoprotein lipase mass is a practical marker of insulin resistance in ambulatory type 2 diabetic patients treated with oral hypoglycemic agents. Clinica chimica acta; international journal of clinical chemistry. 2007;384(1-2):118–123. doi: 10.1016/j.cca.2007.06.015. [DOI] [PubMed] [Google Scholar]
- Eckel RH, Yost TJ, Jensen DR. Alterations in lipoprotein lipase in insulin resistance. International journal of obesity and related metabolic disorders: journal of the International Association for the Study of Obesity. 1995;19(Suppl 1):S16–S21. [PubMed] [Google Scholar]
- Eriksson JW, Buren J, Svensson M, Olivecrona T, Olivecrona G. Postprandial regulation of blood lipids and adipose tissue lipoprotein lipase in type 2 diabetes patients and healthy control subjects. Atherosclerosis. 2003;166(2):359–367. doi: 10.1016/s0021-9150(02)00366-0. [DOI] [PubMed] [Google Scholar]
- Taskinen MR. Lipoprotein lipase in diabetes. Diabetes/metabolism reviews. 1987;3(2):551–570. doi: 10.1002/dmr.5610030208. [DOI] [PubMed] [Google Scholar]
- Botella-Carretero JI, Alvarez-Blasco F, Villafruela JJ, Balsa JA, Vazquez C, Escobar-Morreale HF. Vitamin D deficiency is associated with the metabolic syndrome in morbid obesity. Clin Nutr. 2007;26(5):573–580. doi: 10.1016/j.clnu.2007.05.009. [DOI] [PubMed] [Google Scholar]
- Lu L, Yu Z, Pan A, Hu FB, Franco OH, Li H, Li X, Yang X, Chen Y, Lin X. Plasma 25-hydroxyvitamin D concentration and metabolic syndrome among middle-aged and elderly Chinese individuals. Diabetes care. 2009;32(7):1278–1283. doi: 10.2337/dc09-0209. [DOI] [PMC free article] [PubMed] [Google Scholar]
- Delvin EE, Lambert M, Levy E, O'Loughlin J, Mark S, Gray-Donald K, Paradis G. Vitamin D status is modestly associated with glycemia and indicators of lipid metabolism in French-Canadian children and adolescents. The Journal of nutrition. 2010;140(5):987–991. doi: 10.3945/jn.109.112250. [DOI] [PubMed] [Google Scholar]
- Vu D, Ong JM, Clemens TL, Kern PA. 1,25-dihydroxyvitamin D induces lipoprotein lipase expression in 3 T3-L1 cells in association with adipocyte differentiation. Endocrinology. 1996;137(5):1540–1544. doi: 10.1210/endo.137.5.8612483. [DOI] [PubMed] [Google Scholar]
- Huang L, Xue J, He Y, Wang J, Sun C, Feng R, Teng J, He Y, Li Y. Dietary calcium but not elemental calcium from supplements is associated with body composition and obesity in Chinese women. PloS one. 2011;6(12):e27703. doi: 10.1371/journal.pone.0027703. [DOI] [PMC free article] [PubMed] [Google Scholar]
- Trumbo P, Schlicker S, Yates AA, Poos M. Food, Nutrition Board of the Institute of Medicine TNA: Dietary reference intakes for energy, carbohydrate, fiber, fat, fatty acids, cholesterol, protein and amino acids. Journal of the American Dietetic Association. 2002;102(11):1621–1630. doi: 10.1016/s0002-8223(02)90346-9. [DOI] [PubMed] [Google Scholar]
- World Health Organization. International Diabetes Federation. World Health Organization: Definition and diagnosis of diabetes mellitus and intermediate hyperglycaemia: report of a WHO/IDF consultation. Geneva; 2006. [Google Scholar]
- Holick MF, Siris ES, Binkley N, Beard MK, Khan A, Katzer JT, Petruschke RA, Chen E, de Papp AE. Prevalence of Vitamin D inadequacy among postmenopausal North American women receiving osteoporosis therapy. The Journal of clinical endocrinology and metabolism. 2005;90(6):3215–3224. doi: 10.1210/jc.2004-2364. [DOI] [PubMed] [Google Scholar]
- Ujcic-Voortman JK, Schram MT, der Bruggen MA J-v, Verhoeff AP, Baan CA. Diabetes prevalence and risk factors among ethnic minorities. European journal of public health. 2009;19(5):511–515. doi: 10.1093/eurpub/ckp096. [DOI] [PubMed] [Google Scholar]
- Hanefeld M, Koehler C, Gallo S, Benke I, Ott P. Impact of the individual components of the metabolic syndrome and their different combinations on the prevalence of atherosclerotic vascular disease in type 2 diabetes: the Diabetes in Germany (DIG) study. Cardiovascular diabetology. 2007;6:13. doi: 10.1186/1475-2840-6-13. [DOI] [PMC free article] [PubMed] [Google Scholar]
- Liu S, Wang W, Zhang J, He Y, Yao C, Zeng Z, Piao J, Howard BV, Fabsitz RR, Best L. et al. Prevalence of diabetes and impaired fasting glucose in Chinese adults, China National Nutrition and Health Survey, 2002. Preventing chronic disease. 2011;8(1):A13. [PMC free article] [PubMed] [Google Scholar]
- Feng RN, Zhao C, Wang C, Niu YC, Li K, Guo FC, Li ST, Sun CH, Li Y. BMI is strongly associated with hypertension, and waist circumference is strongly associated with type 2 diabetes and dyslipidemia, in northern Chinese adults. Journal of epidemiology/ Japan Epidemiological Association. 2012;22(4):317–323. doi: 10.2188/jea.JE20110120. [DOI] [PMC free article] [PubMed] [Google Scholar]
- Holick MF. Vitamin D deficiency. N Engl J Med. 2007;357(3):266–281. doi: 10.1056/NEJMra070553. [DOI] [PubMed] [Google Scholar]
- Hypponen E, Boucher BJ, Berry DJ, Power C. 25-Hydroxyvitamin D, IGF-1, and Metabolic Syndrome at 45 Years of Age: A Cross-Sectional Study in the 1958 British Birth Cohort. Diabetes. 2007;57(2):298–305. doi: 10.2337/db07-1122. [DOI] [PubMed] [Google Scholar]
- Ford ES, Zhao G, Li C, Pearson WS. Serum concentrations of vitamin D and parathyroid hormone and prevalent metabolic syndrome among adults in the United States. Journal of diabetes. 2009;1(4):296–303. doi: 10.1111/j.1753-0407.2009.00046.x. [DOI] [PubMed] [Google Scholar]
- Ford ES, Ajani UA, McGuire LC, Liu S. Concentrations of serum vitamin D and the metabolic syndrome among U.S. adults. Diabetes care. 2005;28(5):1228–1230. doi: 10.2337/diacare.28.5.1228. [DOI] [PubMed] [Google Scholar]
- Hjelmesaeth J, Hofso D, Aasheim ET, Jenssen T, Moan J, Hager H, Roislien J, Bollerslev J. Parathyroid hormone, but not vitamin D, is associated with the metabolic syndrome in morbidly obese women and men: a cross-sectional study. Cardiovascular diabetology. 2009;8:7. doi: 10.1186/1475-2840-8-7. [DOI] [PMC free article] [PubMed] [Google Scholar]
- Pittas AG, Lau J, Hu FB, Dawson-Hughes B. The role of vitamin D and calcium in type 2 diabetes. A systematic review and meta-analysis. The Journal of clinical endocrinology and metabolism. 2007;92(6):2017–2029. doi: 10.1210/jc.2007-0298. [DOI] [PMC free article] [PubMed] [Google Scholar]
- Salum E, Kampus P, Zilmer M, Eha J, Butlin M, Avolio AP, Podramagi T, Arend A, Aunapuu M, Kals J. Effect of vitamin D on aortic remodeling in streptozotocin-induced diabetes. Cardiovascular diabetology. 2012;11:58. doi: 10.1186/1475-2840-11-58. [DOI] [PMC free article] [PubMed] [Google Scholar]
- Al-Daghri NM, Alkharfy KM, Al-Othman A, El-Kholie E, Moharram O, Alokail MS, Al-Saleh Y, Sabico S, Kumar S, Chrousos GP. Vitamin D supplementation as an adjuvant therapy for patients with T2DM: an 18-month prospective interventional study. Cardiovascular diabetology. 2012;11(1):85. doi: 10.1186/1475-2840-11-85. [DOI] [PMC free article] [PubMed] [Google Scholar]
- Makoveichuk E, Sukonina V, Kroupa O, Thulin P, Ehrenborg E, Olivecrona T, Olivecrona G. Inactivation of lipoprotein lipase occurs on the surface of THP-1 macrophages where oligomers of angiopoietin-like protein 4 are formed. Biochem Biophys Res Commun. 2012;425(2):138–143. doi: 10.1016/j.bbrc.2012.07.048. [DOI] [PubMed] [Google Scholar]
- Mingrone G, Henriksen FL, Greco AV, Krogh LN, Capristo E, Gastaldelli A, Castagneto M, Ferrannini E, Gasbarrini G, Beck-Nielsen H. Triglyceride-induced diabetes associated with familial lipoprotein lipase deficiency. Diabetes. 1999;48(6):1258–1263. doi: 10.2337/diabetes.48.6.1258. [DOI] [PubMed] [Google Scholar]
- Braun JE, Severson DL. Regulation of the synthesis, processing and translocation of lipoprotein lipase. The Biochemical journal. 1992;287(Pt 2):337–347. doi: 10.1042/bj2870337. [DOI] [PMC free article] [PubMed] [Google Scholar]
- Querfeld U, Hoffmann MM, Klaus G, Eifinger F, Ackerschott M, Michalk D, Kern PA. Antagonistic effects of vitamin D and parathyroid hormone on lipoprotein lipase in cultured adipocytes. J Am Soc Nephrol. 1999;10(10):2158–2164. doi: 10.1681/ASN.V10102158. [DOI] [PubMed] [Google Scholar]
- Mathieu C, Gysemans C, Giulietti A, Bouillon R. Vitamin D and diabetes. Diabetologia. 2005;48(7):1247–1257. doi: 10.1007/s00125-005-1802-7. [DOI] [PubMed] [Google Scholar]
- Riserus U, Sprecher D, Johnson T, Olson E, Hirschberg S, Liu A, Fang Z, Hegde P, Richards D, Sarov-Blat L. et al. Activation of peroxisome proliferator-activated receptor (PPAR)delta promotes reversal of multiple metabolic abnormalities, reduces oxidative stress, and increases fatty acid oxidation in moderately obese men. Diabetes. 2008;57(2):332–339. doi: 10.2337/db07-1318. [DOI] [PubMed] [Google Scholar]
- Zemel MB. Regulation of adiposity and obesity risk by dietary calcium: mechanisms and implications. J Am Coll Nutr. 2002;21(2):146S–151S. doi: 10.1080/07315724.2002.10719212. [DOI] [PubMed] [Google Scholar]
- He YH, Song Y, Liao XL, Wang L, Li G, Alima LG, Li Y, Sun CH. The calcium-sensing receptor affects fat accumulation via effects on antilipolytic pathways in adipose tissue of rats fed low-calcium diets. The Journal of nutrition. 2011;141(11):1938–1946. doi: 10.3945/jn.111.141762. [DOI] [PubMed] [Google Scholar]
- Holick MF. High prevalence of vitamin D inadequacy and implications for health. Mayo Clin Proc. 2006;81(3):353–373. doi: 10.4065/81.3.353. [DOI] [PubMed] [Google Scholar]
- Yan L, Prentice A, Zhang H, Wang X, Stirling DM, Golden MM. Vitamin D status and parathyroid hormone concentrations in Chinese women and men from north-east of the People's Republic of China. European journal of clinical nutrition. 2000;54(1):68–72. doi: 10.1038/sj.ejcn.1600895. [DOI] [PubMed] [Google Scholar]