Abstract
TIA-1 and TTP are AU-rich element-binding proteins that prevent the pathological overexpression of tumor necrosis factor α (TNF-α). TIA-1 inhibits the translation of TNF-α transcripts, whereas TTP promotes the degradation of TNF-α transcripts. Here we show that TIA-1 and TTP function as arthritis suppressor genes: TIA-1–/– mice develop mild arthritis, TTP–/– mice develop severe arthritis, and TIA-1–/–TTP–/– mice develop very severe arthritis. Peritoneal macrophages derived from all three genotypes overexpress cyclooxygenase 2 and TNF-α. Surprisingly, lipopolysaccharide-activated TIA-1–/–TTP–/– macrophages secrete less TNF-α protein than either TIA-1–/– or TTP–/– macrophages. In these mice, arthritogenic cytokine may be produced by neutrophils that accumulate in the bone marrow and peripheral blood. Our results suggest that TIA-1 and TTP are genetic modifiers of inflammatory arthritis that can alter the spectrum of cells that produce arthritogenic cytokines.
Keywords: protein translation, mRNA stability, coordinate expression
Tumor necrosis factor α (TNF-α) is a major mediator of inflammation and plays a pivotal role during the early phase of a host's reaction to infection or injury. Localized and transient secretion of TNF-α is normal, whereas pathological overexpression of TNF-α results in inflammatory arthritis and inflammatory bowel disease (1–3). Posttranscriptional mechanisms that affect the stability and translatability of TNF-α transcripts serve to dampen the production of this potentially harmful cytokine. Of particular importance in this regard is an AU-rich element (ARE) in the 3′ untranslated region of TNF-α mRNA that recruits a family of ARE-binding proteins (ARE-BPs) that regulate mRNA stability and translation (4–6). Studies using mutant mice lacking individual ARE-BPs have shown that TTP promotes the degradation of TNF-α transcripts (7–9), whereas TIA-1 inhibits the translation of TNF-α transcripts (10). The effects of these negative regulators are likely to be balanced by the effects of ARE-BPs that stabilize TNF-α transcripts (e.g., human antigen R and heteronuclear ribonucleoprotein particle A0) (4, 11). Thus, the integrated effects of positive and negative regulators will determine the level of TNF-α expression in different cell types. We have previously shown that TIA-1 dampens the expression of TNF-α in macrophages but not in T cells (12), suggesting that the functional integration of ARE-BPs can differ in different cell types.
Mice lacking TTP develop an autoimmune syndrome characterized by cachexia, arthritis, dermatitis, and autoantibody formation (9). Arthritis is prevented by neutralizing antibodies against TNF-α and is not observed in TTP–/–TNF-R1–/– mice, indicating that TNF-α is essential for the development of inflammatory arthritis (13–15). In macrophages lacking TTP, TNF-α transcripts are stabilized, resulting in the pathological overexpression of TNF-α mRNA and protein (7, 15). Like TNF-α transcripts, granulocyte/macrophage colony-stimulating factor (GM-CSF) transcripts are destabilized by TTP (16). Overproduction of GM-CSF by bone marrow stromal cells activates medullary and extramedullary granulopoiesis (9), causing abnormal accumulations of mature neutrophils in the bone marrow, lymph nodes, spleen, and peripheral blood.
BALB/c mice lacking TIA-1 are phenotypically normal (10). Although lipopolysaccharide (LPS)-activated macrophages derived from wild-type and TIA-1–/– mice express similar amounts of TNF-α transcripts, macrophages lacking TIA-1 produce significantly more TNF-α protein than do wild-type controls (10, 12). In macrophages lacking TIA-1, the percentage of TNF-α transcripts found in polysomes is significantly increased, suggesting that TIA-1 functions as a translational silencer (10). The overexpression of TNF-α protein in macrophages lacking TIA-1 is strain-dependent. TIA-1–/– macrophages derived from BALB/c mice produce three to five times more TNF-α than do wild-type controls, whereas TIA-1–/– macrophages derived from C57BL/6 mice produce nearly 10 times more TNF-α than do wild-type controls (12). Although TIA-1–/– BALB/c mice do not develop arthritis, here we report that TIA-1–/– C57BL/6 mice develop mild arthritis. Thus, unidentified genetic modifiers determine whether TIA-1–/– mice develop arthritis.
Coimmunoprecipitation experiments suggest that TIA-1 and TTP can physically interact in cell lysates (17). To investigate the functional interactions between TIA-1 and TTP, we bred TIA-1–/– mice with TTP–/– mice to produce TIA-1/TTP nullizygotes. Phenotypic and biochemical comparison of TIA-1–/–, TTP–/–, and TIA-1–/–TTP–/– mice indicates that TIA-1 and TTP interact with each other in functionally important ways. Female mice lacking both TIA-1 and TTP have more severe arthritis than mice lacking either TIA-1 or TTP alone. Whereas TIA-1–/–/TTP–/– macrophages produce less TNF-α than either TIA-1–/– or TTP–/– macrophages, TIA-1–/–TTP–/– bone marrow produces much more TNF-α than either TIA-1–/– or TTP–/– bone marrow. Moreover, TIA-1–/–TTP–/– bone marrow is packed with Gr-1+ neutrophils, suggesting that TIA-1 and TTP cooperatively regulate myeloid cell maturation and/or survival. Our results suggest that neutrophils may be an important source of arthritogenic cytokines in TIA-1/TTP nullizygotes. This result further suggests that inactivating mutations in individual ARE-BPs might alter the cell types that produce inflammatory cytokines in patients with rheumatoid arthritis.
Materials and Methods
Generation of Mutant Mice. Mice deficient in TIA-1 (10) and TTP (9) were backcrossed for >10 generations onto the C57BL/6 strain before intercrossing. Because TTP–/– mice do not breed well due to their severe inflammatory phenotype, TTP+/– mice were bred to TIA-1–/– mice to obtain TIA-1–/–TTP+/– mice, which were then bred to produce TIA-1–/–TTP–/– mice. Genotyping of the offspring was performed by using PCR of tail DNA, using primers that span the regions of the wild-type genes disrupted by the targeting vectors (9, 10). All animals were maintained in autoclaved microisolator cages in a barrier facility. All animal care and experiments were in accordance with institutional guidelines for animal use.
Phenotype Assessment and Arthritis Index. The phenotype of all nullizygous and heterozygous mice was assessed to include weight, dermatitis, conjunctivitis, and arthritis. A clinical index of arthritis severity was measured in a blinded fashion. Each paw was assigned a score of 0–4, where 0 is assigned in the absence of arthritis, 1 is assigned when one digit is swollen, 2 is assigned when two to three digits are swollen, and 4 is assigned when more than four digits are swollen, to give a maximum score of 16. The arthritis index was determined by using age-matched mice between the ages of 4 and 6 months.
Histology. Tissue samples were fixed in 4% paraformaldehyde. When required, tissues were decalcified after fixation by immersing in 12.5% sodium citrate and 25% formic acid for 24 h, rinsing in water, and washing in 70% ethanol. Fixed tissues were embedded for paraffin sectioning. Specimens were processed according to standard protocols before being stained with hematoxylin/eosin. Histologic assessment was determined by using age-matched mice between the ages of 4 and 6 months.
Fluorescence-Activated Cell Sorter Analysis. Bone marrow cells were obtained by flushing dissected femurs with 2 ml of ice-cold Hanks' buffered saline solution (HBSS) followed by gentle pipeting to disperse the cells. Analysis of the cell surface phenotype was performed by using a FACSSort flow cytometer and associated cellquest software (Becton Dickinson). The following immunofluorescent antibodies were used at saturating titers: Gr-1 (12-5931-82, eBioscience, San Diego) and isotype control (12-4331-81, eBioscience).
Cell Culture. Peritoneal macrophages were isolated as previously described (10). Briefly, age- and gender-matched mice were injected i.p. with 2 ml of sterile 3% thioglycollate broth (Remel, Lenexa, KS) to increase the yield of macrophages. Three days later, the mice were killed in a carbon dioxide chamber and peritoneal cells were collected by peritoneal lavage with HBSS. The cells were washed with HBSS, and red blood cells were lysed with 0.9% ammonium chloride. Cells were washed and plated at a concentration of 1 × 10⁶ cells per ml of medium. Cells were treated as indicated within 24 h of collection. The cell medium consisted of DMEM supplemented with 10% (vol/vol) heat-inactivated FBS, 1% penicillin/streptomycin, 3.5 μl/liter 2-mercaptoethanol, and insulin–transferrin–sodium selenite medium supplement (Sigma). Bone marrow-derived cells were prepared as described in ref. 9. Briefly, marrow cells were flushed from both femurs of individual mice, and the red blood cells were lysed with 0.9% ammonium chloride. Cells were washed in HBSS, plated in supplemented DMEM, and treated as indicated within 24 h. Cells were cultured in the absence or presence of LPS (1 μg/ml Escherichia coli serotype 0111:B4; Sigma) for the indicated times before processing for quantitation of TNF-α.
Neutrophil Enrichment. Bone marrow cells suspended in calcium- and magnesium-free HBSS supplemented with 0.1% BSA were layered on the top of a 62/81% two-layer Percoll gradient (Pharmacia, Uppsala). After centrifugation for 30 min at 300 × g, polymorphonuclear leukocytes were harvested from the 62/81% interface. Polymorphonuclear leukocytes were washed once with ice-cold HBSS before plating at a concentration of 1 × 10⁶.
Cytokine Detection. Supernatants collected from cells were centrifuged at 13,000 × g for 5 min and stored at –80°C. To assess cytokine concentrations in cell supernatants, standard sandwich ELISAs were performed by using Nunc-Immuno plates (Wiesbaden, Germany). Capture antibodies (5 mg/ml) and biotinylated detection antibodies (1 μg/ml) for TNF-α were used (Pharmingen). Commercially available streptavidin-conjugated horseradish peroxidase (Southern Biotechnology Associates) and 2,2′-azino-di(3-ethylbenzthiazoline-6-sulfonate (Boehringer Mannheim) were used in the final steps in detection. The optical density of each sample was measured on a Multiscan MCC/340 MK 11 plate reader (Titertek, Huntsville, AL) at the recommended wavelength, and the cytokine concentration in each sample was calculated from a cytokine recombinant protein standard curve made with a TNF-α recombinant protein (Pharmingen). Each cytokine concentration was expressed as amount per 1 × 10⁵ cells
Quantitative Real-Time PCR. Total cellular RNA was isolated as described above from samples and controls (10). The quality of RNA was determined by OD260/OD280 and Northern gel analysis. Sample RNA (20 ng/ml) plus 1 ml of RNase-Inhibitor was assessed by using a TNF-α primer and probe set as described in ref. 18. RT-PCR was performed by using a Bio-Rad iCycler IQ detection system. Relative quantitation of gene expression was determined by comparison to a standard curve generated by using 18S rRNA (labeled with 6-carboxyfluorescein) as an endogenous control. Each PCR amplification was performed in triplicate wells. TNF-α RNA is expressed as a relative amount compared with TNF-α RNA in unstimulated cells.
Western Blotting. Peritoneal macrophages were cultured in the absence or presence of 1 μg/ml LPS for 4 h before harvesting for Western blotting analysis. Cell lysates were separated on a 4–20% SDS polyacrylamide gel, transferred to nitrocellulose, and probed by using a monoclonal antibody reactive with cyclooxygenase 2 (COX-2; BD Biosciences) or a goat polyclonal antiserum reactive with TNF-α (Santa Cruz Biotechnology) using methods described in ref. 10.
Statistical Analysis. Statistical analyses were performed by using Student's unpaired two-tailed t test.
Results
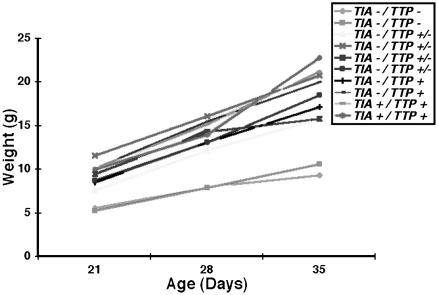
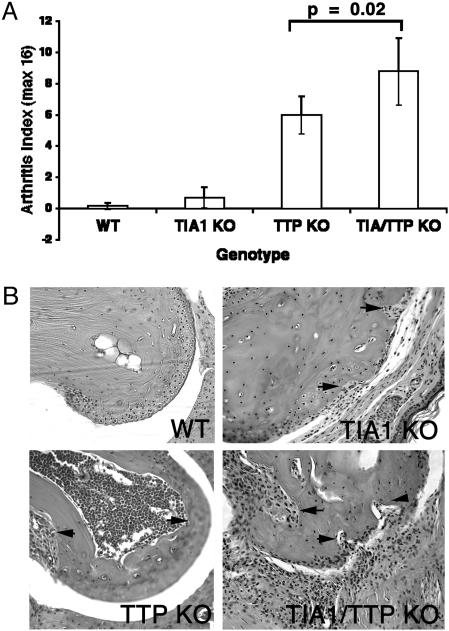
Phenotypic Comparison of TIA-1–/–, TTP–/–, and TIA-1–/–TTP–/– Mice. TIA-1–/– and TTP–/– mice on the C57BL/6 background were bred to produce TIA-1/TTP nullizygotes. Like the TTP nullizygotes, TIA-1–/–TTP–/– mice are runts at birth and subsequently grow slowly. Fig. 1 shows the growth curves of 10 mice of the indicated genotypes. Whereas the absence of TIA-1 does not significantly affect growth rate, absence of TTP confers a slow growth phenotype. The incidence of arthritis in wild-type, TIA-1–/–, TTP–/–, and TIA-1–/–TTP–/– mice was assessed in a blinded fashion (a total of 12 mice of each genotype were scored; see Fig. 2A). Blinded analysis revealed that some TIA-–/– mice on the C57BL/6 background develop mild arthritis (although the arthritis index was not significantly different from wild-type controls, some mice had obvious joint swelling and occasional bone erosions, as demonstrated in Fig. 2B). In TTP nullizygotes, arthritis is more severe than in TIA-1 nullizygotes. Arrows in Fig. 2B point to bone marrow hypercellularity and bone erosions, both from within the marrow cavity and from the juxtarticular bone surface, in the TTP nullizygotes. In TIA-1–/–TTP–/– mice, arthritis is significantly more severe than in either TIA-1–/– or TTP–/– mice (P = 0.02), suggesting that the absence of TIA-1 potentiates the arthritis that develops in the absence of TTP.
Fig. 1.
Growth curves for wild-type and knockout mice. TIA-1/TTP nullizygous mice are smaller than wild-type or TTP+/– mice at birth and exhibit delayed growth.
Fig. 2.
Arthritis severity in wild-type and mutant mice. (A) Arthritis index. Wild-type, TIA-1–/–, TTP–/–, and TIA-1–/–/TTP–/– adult mice were blindly assessed for arthritis severity and were assigned a score based on the arthritis index described in Materials and Methods. Data show the means ± SE from 12 mice of each genotype. (B) Histologic assessment of arthritis. Shown is a hematoxylin/eosin stain of proximal interphalangeal joint from the front paw from the indicated genotype. (Magnification, ×20.) All histologic assessments were determined by using age-matched mice (6 months old). (Upper Left) Wild type (WT). (Upper Right) TIA-1–/– (TIA1 KO). Arrows indicate bone erosion from the articular surface. (Lower Left) TTP–/– (TTP KO). Arrows indicate hypercellular bone marrow with osteoclastogenic activation in the marrow space. (Lower Right) TIA-1–/–/TTP–/– (TIA1/TTP KO) mice. Arrows indicate thickened inflamed synovium with bone erosion from the articular surface.
The histology of finger joints derived from mice from each genotype (wild type, TIA-1–/–, TTP–/– and TIA-1–/–TTP–/–) is shown in Fig. 2B. Compared with joints derived from wild-type mice, joints derived from TTP–/– and TIA-1–/–TTP–/– mice exhibit exuberant inflammatory pannus and bony erosions. In contrast, swollen joints from TIA-1–/– mice exhibit minimal inflammatory pannus and rare bony erosions, indicating that the arthritis is significantly less severe.
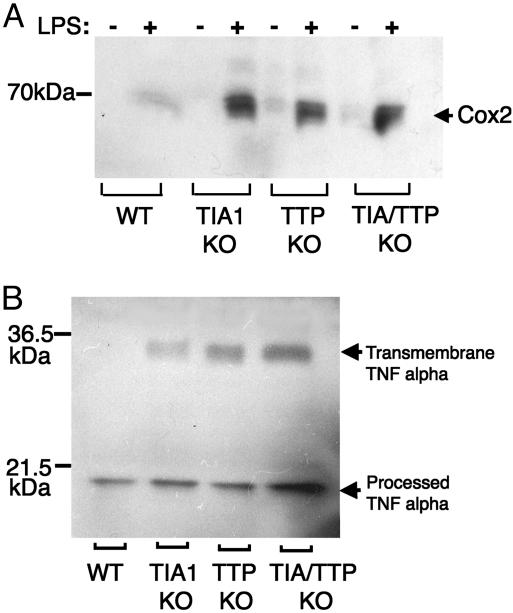
Overproduction of COX-2 by Peritoneal Macrophages. TIA-1 binds to an ARE found in the 3′ untranslated regions of both TNF-α transcripts (10) and COX-2 transcripts (19). TIA-1 functions as a translational silencer that dampens the production of both TNF-α and COX-2, suggesting that it may be a key regulator of the inflammatory response. We compared the LPS-induced expression of COX-2 in peritoneal macrophages derived from wild-type, TIA-1–/–, TTP–/–, and TIA-1–/–TTP–/– mice using Western blotting analysis. As shown in Fig. 3A, LPS induces the expression of COX-2 protein in both wild-type and mutant macrophages. Macrophages lacking TIA-1, TTP, or both TIA-1 and TTP overexpress COX-2, consistent with a role for these proteins in repressing the production of inflammatory mediators. In a parallel experiment, lysates from LPS-activated peritoneal macrophages were probed by using goat polyclonal anti-serum reactive with TNF-α (Fig. 3B). LPS-activated macrophages lacking TIA-1, TTP, or both TIA-1 and TTP overexpress the transmembrane form of TNF-α compared with wild-type macrophages. In this experiment, the proteolytic processing of transmembrane TNF-α may be more efficient in wild-type compared with mutant macrophages. Additional experiments will be required to determine whether the absence of TIA-1 and/or TTP affects the expression of the TNF-α convertase that cleaves transmembrane TNF-α to release the secreted product.
Fig. 3.
Expression of COX-2 and TNF-α in LPS-activated peritoneal macrophages. (A) Peritoneal macrophages (derived from wild-type, TIA-1–/–, TTP–/–, and TIA-1/TTP–/– mice) were cultured in the absence (–) or presence (+) of LPS (1 μg/ml for 4 h) before processing for Western blot analysis using antibodies reactive with COX-2. (B) LPS-activated macrophages of the indicated genotypes were processed for Western blot analysis by using antibodies reactive with TNF-α. The relative migration of molecular mass markers is shown at the left.
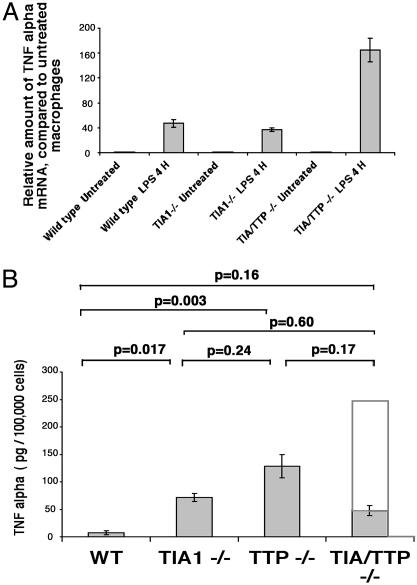
Production of TNF-α mRNA and Protein by Peritoneal Macrophages. We used real-time PCR to compare the expression of TNF-α mRNA in wild-type, TIA-1–/–, TTP–/–, and TIA-1–/–TTP–/– peritoneal macrophages before and after LPS stimulation (1 μg/ml for 4 h). In each case, total cellular RNA was isolated by using the TRIzol method. Validated primers were used to quantitate the expression of TNF-α transcripts. In each case, the expression of TNF-α was normalized to the expression of 18S ribosomal RNA, which served as an internal standard. As shown in Fig. 4A, LPS induces the expression of TNF-α transcripts in wild-type and mutant macrophages (data show the mean level of expression from three mice of each genotype). Consistent with results reported in ref. 10, the level of TNF-α mRNA is similar in LPS-stimulated wild-type and TIA-1–/– macrophages. Like TTP–/– macrophages (7), LPS-stimulated TIA-1–/–TTP–/– macrophages express three to four times more TNF-α mRNA than wild-type controls.
Fig. 4.
Expression of TNF-α mRNA and protein in LPS-activated peritoneal macrophages. (A) Quantitation of TNF-α mRNA using real-time PCR. Total cellular mRNA was extracted from LPS-activated peritoneal macrophages (derived from wild-type, TIA-1–/–, TTP–/–, and TIA-1–/–/TTP–/– mice) using the TRIzol method. TNF-α RNA and 18S rRNA were quantitated by using real-time PCR. The expression of TNF-α mRNA was normalized to 18S rRNA and is shown in arbitrary units. Pooled RNA from three mice was subjected to RT-PCR. Data show the average of two independent analyses. (B) Quantitation of TNF-α protein using ELISA. Supernatants from LPS-activated peritoneal macrophages derived from 12 wild-type, 10 TIA-1–/–, 5 TTP–/–, and 12 TIA-1/TTP–/– mice were assayed for soluble TNF-α. Each bar shows the mean secretion ± SE. The open bar in the TIA-1–/–/TTP–/– sample depicts the expected production of TNF-α if the effects of TIA-1 and TTP were additive.
The secretion of TNF-α into the supernatants of LPS-activated peritoneal macrophages was quantitated by using an ELISA. As shown in Fig. 4B, TIA-1–/– and TTP–/– macrophages produce significantly more TNF-α than wild-type macrophages (data show the means ± SE from the indicated number of mice from each genotype). Given the increased production of TNF-α mRNA and the increased severity of arthritis in TIA-1–/–TTP–/– mice, we expected that TIA-1–/–TTP–/– macrophages would produce more TNF-α than either TIA-1–/– or TTP–/– macrophages. Surprisingly, LPS-activated TIA-1–/–TTP–/– macrophages produced somewhat less TNF-α than either TIA-1–/– or TTP–/– macrophages (Fig. 4B, shaded bar; the extended open bar in the TIA/TTP lane shows the amount of TNF-α protein expected if the effects of TIA-1 and TTP were additive). Because cell-associated TNF-α is appropriately increased in macrophages lacking both TIA-1 and TTP (Fig. 3B), the reduced accumulation of secreted TNF-α suggests that some aspect of the secretory pathway may be disrupted in these cells.
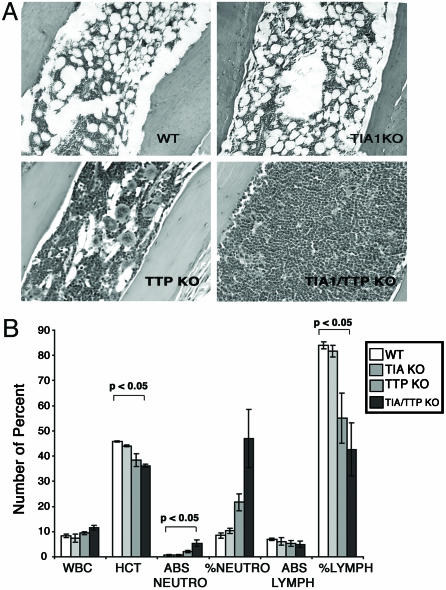
TNF-α Production by Neutrophils. Pathological overexpression of TNF-α is essential for the induction of arthritis in mice lacking TTP. Neutralizing antibodies against TNF-α prevent arthritis in TTP nullizygotes (9), and mice lacking both TTP and TNF-R1 do not develop arthritis (14). Although TIA-1–/–TTP–/– mice develop severe arthritis, LPS-activated TIA-1–/–TTP–/– macrophages produce less TNF-α than either TIA-1–/– or TTP–/– macrophages. An alternative source of TNF-α might be the expanded population of Gr-1+ neutrophils found in the bone marrow and peripheral blood of TTP–/– mice (9). Histological analysis revealed that bone marrow from TTP–/– and, to a greater extent, TIA-1–/–TTP–/– mice is packed with myeloid cells (Fig. 5A). Phenotypic analysis revealed increased Gr-1+ cells in TIA-1–/–TTP–/– bone marrow (82% Gr-1+) compared with wild-type (53% Gr-1+), TIA-1–/– (42% Gr-1+), and TTP–/– (56% Gr-1+) bone marrow. Excess neutrophils were also found in the peripheral blood in TTP–/– mice and, to a greater extent, in TIA-1–/–TTP–/– mice (Fig. 5B; data show the means ± SE from three different mice). There was a concomitant reduction in peripheral blood lymphocytes and red blood cells.
Fig. 5.
Quantitation of bone marrow and peripheral blood neutrophils. (A) Bone marrow histology. All histologic assessments were determined by using age-matched mice (4–6 months old). Bone marrow from wild-type, TIA-1–/–, TTP–/–, and TIA-1–/–/TTP–/– mice was analyzed by hematoxylin/eosin staining. (B) Peripheral blood counts from wild-type, TIA-1–/–, TTP–/–, and TIA-1–/–/TTP–/– mice shows total white blood count (WBC), hematocrit (HCT), absolute neutrophil count (ABS NEUTRO), percent of neutrophils (% NEUTRO), absolute lymphocyte count (ABS LYMPH), and percent of lymphocytes (% LYMPH). Data are the means and SE from three different mice. Statistical analysis (P < 0.05) compares wild-type and TIA-1–/–/TTP–/– mice.
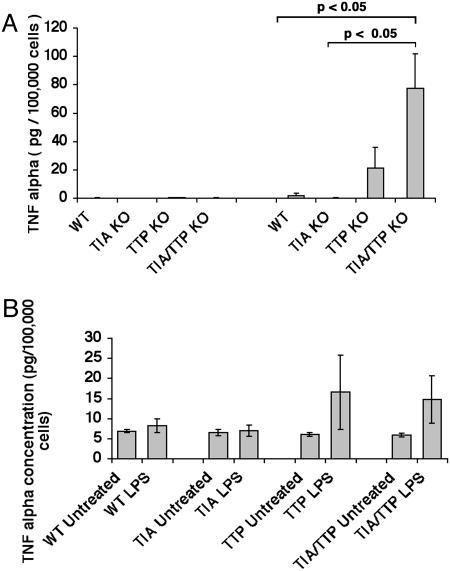
LPS activation of unfractionated bone marrow cells revealed that TIA-1–/–TTP–/– cells produce significantly more TNF-α than TTP–/– cells (Fig. 6A; data show the mean expression ± SE from three different mice). The increased percentage of Gr-1+ cells in the TIA-1–/–TTP–/– bone marrow might be sufficient to account for the increased production of TNF-α. Alternatively, TIA-1–/–TTP–/– neutrophils might produce more TNF-α than TIA-1–/– or TTP–/– neutrophils. To differentiate between these possibilities, we used Percoll gradients to enrich bone marrow cells for Gr-1+ neutrophils (20). Using cell populations that contained >75% Gr-1+ cells, it is clear that wild-type and TIA-1–/– neutrophils produce little or no TNF-α in response to LPS (Fig. 6B; data show the mean secretion ± SE from three different mice from each genotype). In contrast, TTP–/– and TIA-1–/–TTP–/– neutrophils produce similar amounts of TNF-α in response to LPS (Fig. 6B). Thus, the absence of TTP is sufficient to allow the production of TNF-α in LPS-activated neutrophils. Furthermore, TIA-1 and TTP cooperatively promote myeloid maturation (and/or neutrophil survival) resulting in increased numbers of neutrophils in the bone marrow and peripheral blood. In combination, these events are likely to contribute to the severe arthritis observed in TIA-1–/–TTP–/– mice.
Fig. 6.
Production of TNF-α by bone marrow cells and bone marrow-derived Gr-1+ neutrophils. (A) Supernatants harvested from LPS-activated bone marrow cells derived from wild-type, TIA-1–/–, TTP–/–, and TIA-1–/–/TTP–/– mice were assayed for TNF-α by using an ELISA. Data depict the means and SE from three independent experiments. (B) Percoll gradient-enriched, bone marrow-derived Gr-1+ neutrophils from wild-type, TIA-1–/–, TTP–/–, and TIA-1–/–/TTP–/– female mice were activated with LPS (1 μg/ml for 4 h) before harvesting supernatants for quantitation of TNF-α using an ELISA. Data depict the means and SE from three independent experiments.
Discussion
The coordinate expression of inflammatory mediators requires both transcriptional and posttranscriptional control elements. Many mRNAs that encode inflammatory mediators (e.g., TNF-α, IL-1β, COX-2, and matrix metalloproteases) possess AREs in their 3′ untranslated regions that inhibit translation and promote mRNA decay (19, 21, 22). These functional effects require the coordinated activity of ARE-BPs such as TIA-1 and TTP (10, 23). Here we show that mice lacking either TIA-1 or TTP develop inflammatory arthritis. Mice lacking both TIA-1 and TTP develop more severe arthritis, suggesting that these ARE-BPs can cooperatively influence the severity of inflammatory arthritis. On this basis, TIA-1 and TTP can be considered to be arthritis suppressor genes.
Because TIA-1 and TTP regulate different aspects of mRNA metabolism, their functional effects could be independent and additive. In this case, TIA–/–TTP–/– cells would be expected to produce as much TNF-α as TIA-1–/– and TTP–/– cells combined. Analysis of macrophages and neutrophils derived from wild-type, TIA-1–/–, TTP–/–, and TIA–/–TTP–/– mice reveals that this is not the case. LPS-activated macrophages lacking TIA-1 produce eight times more TNF-α protein than wild-type controls. LPS-activated macrophages lacking TTP produce 16 times more TNF-α protein than wild-type controls. If the effects of TIA-1 and TTP are independent and additive, TIA-1–/–TTP–/– macrophages should produce ≈24 times more TNF-α protein than wild-type controls. In fact, TIA-1–/–TTP–/– macrophages produce only six times more TNF-α protein than wild-type controls (i.e., less than either TIA-1–/– or TTP–/– macrophages), indicating that the effects of TIA-1 and TTP are not independent and additive in these cells. Although additional experiments will be required to explain this result, it is possible that TIA-1 and TTP serve a redundant role in a process required for the secretion of TNF-α. Although increased production of TNF-α appears to play a central role in the pathogenesis of the inflammatory arthritis seen in these mouse models, contribution from other cytokines cannot be excluded.
In contrast to macrophages, TIA-1–/– neutrophils do not produce more TNF-α than wild-type neutrophils. Moreover, both TTP–/– and TIA-1–/–TTP–/– neutrophils produce similar amounts of TNF-α protein. Thus, the putative secretory defect observed in macrophages is not seen in neutrophils. These results suggest that TTP, but not TIA-1, functions to dampen the expression of TNF-α in neutrophils. This result is analogous to our finding that TIA-1 regulates the production of TNF-α in macrophages but not in T cells (12). Previous studies from other laboratories have also suggested that other ARE-BPs (e.g., butyrate response factor 1) may regulate ARE-dependent mRNA turnover differently in different cell types (e.g., T cells and fibroblasts) (24). Data from this study confirm that there likely exists a complex interplay between individual ARE-BPs that regulates the stability and translation of inflammatory cytokine transcripts.
Our results suggest that TIA-1 plays an important role in the maturation and/or survival of neutrophils. As previously reported, mice lacking TTP have increased numbers of bone marrow and peripheral blood neutrophils (9). This phenomenon might result from increased production of granulocyte/macrophage colony-stimulating factor (GM-CSF) by bone marrow stromal cells of mice lacking TTP (16). Although mice lacking TIA-1 do not have increased numbers of neutrophils, mice lacking both TIA-1 and TTP have significantly more neutrophils than mice lacking TTP alone. Thus, the marked increase in neutrophils observed in TTP–/– bone marrow and peripheral blood is potentiated in mice that also lack TIA-1. The mechanism whereby TIA-1 and TTP cooperate to regulate the number of bone marrow and peripheral blood neutrophils is not known. In addition to their effects on myeloid maturation, GM-CSF and TNF-α can influence neutrophil survival (25). The relative contribution of maturation versus survival on the observed phenotype remains to be determined.
Although neutrophils clearly contribute to the pathogenesis of arthritis (26, 27), our understanding of their precise contribution to the inflammatory process is incomplete. Neutrophils are the predominant cell type found in inflammatory synovial fluid (but not synovial pannus) derived from patients with rheumatoid arthritis. Neutrophils are an important source of arachadonic acid-derived inflammatory mediators (e.g., prostaglandins, leukotrienes, and lipoxins). It is possible that TNF-α production by neutrophils in the bone marrow contributes to joint inflammation and destruction from a distance, either through stimulation of endogenous cells or by recruitment of other inflammatory cells. Alternatively, there is an intimate relationship between the bone marrow and the joint space, suggesting a possible direct role. Neutrophils are essential components of the inflammatory process in animal models of inflammatory arthritis (28). The ability of TIA-1 and TTP to cooperatively regulate both neutrophil maturation and function suggests that these cells could be a major source of inflammatory cytokine production in a subset of patients with rheumatoid arthritis.
Acknowledgments
We thank the members of the Anderson laboratory for helpful suggestions. K.P. was supported by a fellowship from the Arthritis National Research Foundation. This work was supported by National Institutes of Health Grants AI33600 and AI 50167 and by a Biomedical Science Award from the Arthritis Foundation.
Abbreviations: TNF-α, tumor necrosis factor α; COX-2, cyclooxygenase 2; ARE, AU-rich element; ARE-BP, ARE-binding protein; LPS, lipopolysaccharide; HBSS, Hanks' buffered saline solution.
References
- 1.Cope, A., Aderka, D., Doherty, M., Englemann, H., Gibbons, D., Jones, A., Brennan, F., Maini, R., Wallach, D. & Feldmann, M. (1992) Arthritis Rheum. 35, 1160–1169. [DOI] [PubMed] [Google Scholar]
- 2.Feldmann, M. & Maini, R. N. (2002) Joint Bone Spine 69, 12–18. [DOI] [PubMed] [Google Scholar]
- 3.Gravallese, E., Galson, D., Goldring, S. & Auron, P. (2001) Arthritis Res. 3, 6–12. [DOI] [PMC free article] [PubMed] [Google Scholar]
- 4.Brennan, C. M. & Steitz, J. A. (2001) Cell Mol. Life Sci. 58, 266–277. [DOI] [PMC free article] [PubMed] [Google Scholar]
- 5.Dreyfuss, G., Kim, V. N. & Kataoka, N. (2002) Nat. Rev. Mol. Cell Biol. 3, 195–205. [DOI] [PubMed] [Google Scholar]
- 6.Wilusz, C. J., Wormington, M. & Peltz, S. W. (2001) Nat. Rev. Mol. Cell Biol. 2, 237–246. [DOI] [PubMed] [Google Scholar]
- 7.Carballo, E., Lai, W. S. & Blackshear, P. J. (1998) Science 281, 1001–1005. [DOI] [PubMed] [Google Scholar]
- 8.Blackshear, P. J. (2002) Biochem. Soc. Trans. 30, 945–952. [DOI] [PubMed] [Google Scholar]
- 9.Taylor, G. A., Carballo, E., Lee, D. M., Lai, W. S., Thompson, M. J., Patel, D. D., Schenkman, D. I., Gilkeson, G. S., Broxmeyer, H. E., Haynes, B. F. & Blackshear, P. J. (1996) Immunity 4, 445–454. [DOI] [PubMed] [Google Scholar]
- 10.Piecyk, M., Wax, S., Beck, A. R., Kedersha, N., Gupta, M., Maritim, B., Chen, S., Gueydan, C., Kruys, V., Streuli, M. & Anderson, P. (2000) EMBO J. 19, 4154–4163. [DOI] [PMC free article] [PubMed] [Google Scholar]
- 11.Rousseau, S., Morrice, N., Peggie, M., Campbell, D. G., Gaestel, M. & Cohen, P. (2002) EMBO J. 21, 6505–6514. [DOI] [PMC free article] [PubMed] [Google Scholar]
- 12.Saito, K., Chen, S., Piecyk, M. & Anderson, P. (2001) Arthritis Rheum. 44, 2879–2887. [DOI] [PubMed] [Google Scholar]
- 13.Blackshear, P. J. (2002) Biochem. Soc. Trans. 30, 945–952. [DOI] [PubMed] [Google Scholar]
- 14.Carballo, E. & Blackshear, P. J. (2001) Blood 98, 2389–2395. [DOI] [PubMed] [Google Scholar]
- 15.Carballo, E., Gilkeson, G. S. & Blackshear, P. J. (1997) J. Clin. Invest. 100, 986–995. [DOI] [PMC free article] [PubMed] [Google Scholar]
- 16.Carballo, E., Lai, W. S. & Blackshear, P. J. (2000) Blood 95, 1891–1899. [PubMed] [Google Scholar]
- 17.Zhang, T., Kruys, V., Huez, G. & Gueydan, C. (2001) Biochem. Soc. Trans. 30, 952–958. [DOI] [PubMed] [Google Scholar]
- 18.Overbergh, L., Valckx, D., Waer, M. & Mathieu, C. (1998) Cytokine 11, 305–312. [DOI] [PubMed] [Google Scholar]
- 19.Dixon, D., Balch, G., Kedersha, N., Anderson, P., Zimmerman, G., Beauchamp, R. & Prescott, S. (2003) J. Exp. Med. 198, 475–481. [DOI] [PMC free article] [PubMed] [Google Scholar]
- 20.Cowland, J. B. & Borregaard, N. (1999) J. Immunol. Methods 232, 191–200. [DOI] [PubMed] [Google Scholar]
- 21.Phillips, R. S., Ramos, S. B. & Blackshear, P. J. (2002) J. Biol. Chem. 277, 11606–11613. [DOI] [PubMed] [Google Scholar]
- 22.Yu, Q., Cok, S. J., Zeng, C. & Morrison, A. R. (2003) J. Biol. Chem. 278, 1579–1584. [DOI] [PubMed] [Google Scholar]
- 23.Lai, W. S., Carballo, E., Strum, J. R., Kennington, E. A., Phillips, R. S. & Blackshear, P. J. (1999) Mol. Cell. Biol. 19, 4311–4323. [DOI] [PMC free article] [PubMed] [Google Scholar]
- 24.Stoecklin, G., Colombi, M., Raineri, I., Leuenberger, S., Mallaun, M., Schmidlin, M., Gross, B., Lu, M., Kitamura, T. & Moroni, C. (2002) EMBO J. 21, 4709–4718. [DOI] [PMC free article] [PubMed] [Google Scholar]
- 25.Sakamoto, C., Suzuki, K., Hato, F., Akahori, M., Hasegawa, T., Hino, M. & Kitagawa, S. (2003) Int. J. Hematol. 77, 60–70. [DOI] [PubMed] [Google Scholar]
- 26.Edwards, S. & Hallett, M. (1997) Immunol. Today 18, 320–324. [DOI] [PubMed] [Google Scholar]
- 27.Pillinger, M. & Abramson, S. (1995) Rheum. Dis. Clin. North Am. 21, 691–714. [PubMed] [Google Scholar]
- 28.Wipke, B. T. & Allen, P. M. (2001) J. Immunol. 167, 1601–1608. [DOI] [PubMed] [Google Scholar]


