Abstract
Adenovirus-induced hyperleptinemia rapidly depletes body fat in normal rats without increasing free fatty acids and ketogenesis, implying that fat-storing adipocytes are oxidizing the fat. To analyze the ultrastructural changes of adipocytes accompanying this functional transformation, we examined the fat tissue by electron microscopy. After 14 days of hyperleptinemia, adipocytes had become shrunken, fatless, and encased in a thick basement-membrane-like matrix. They were crowded with mitochondria that were much smaller than those of brown adipocytes. Their gene expression profile revealed striking up-regulation of peroxisome proliferator-activated receptor γ coactivator 1α (an up-regulator of mitochondrial biogenesis not normally expressed in white fat), increased uncoupling proteins-1 and -2, and down-regulation of lipogenic enzymes. Phosphorylation of both acetyl CoA carboxylase and AMP-activated protein kinase was increased, thus explaining the increase in fatty acid oxidation. The ability to transform adipocytes into unique fat-burning cells may suggest novel therapeutic strategies for obesity.
Intense hyperleptinemia induced in normal rats by means of adenovirus-mediated transfer of the leptin gene causes the rapid disappearance of all visible body fat within 7 days (1). Because this fulminating fat loss is unaccompanied by any increase in plasma free fatty acids (FFA) and β-hydroxybutyrate levels or of ketonuria (2), it contrasts sharply with the fat loss induced by starvation and insulin deficiency, in which FFA released from adipocytes are oxidized to ketones in the liver (3). A possible explanation for this radical metabolic difference is that in the hyperleptinemic animals FFA are oxidized inside the adipocytes. The gene expression profile of overleptinized adipose tissue is consistent with this hypothesis (4), as is the fact that isolated adipocytes respond to recombinant leptin with a release of glycerol unaccompanied by the parallel release of FFA induced by other lipolytic hormones (5).
In this article, we report on the morphologic and molecular changes that occur in white adipocytes as they are transformed by hyperleptinemia into mitochondria-rich fat-burning cells. The findings suggest a metamorphosis of fat-laden white adipocytes into a unique fat-free, mitochondria-rich cell type morphologically distinct from other related cells. The remarkable increase in internal combustion of fat seems to result from a leptin-induced increase in the phosphorylation state of AMP-activated kinase (AMPK), together with increased expression of peroxisome proliferator-activated receptor (PPAR)γ coactivator 1α (PGC-1α) and thermogenic proteins and decreased expression of lipogenic enzymes.
Experimental Procedures
Animals. Eight-week-old wild-type Zucker diabetic fatty (ZDF) rats (+/+) weighing between 280 and 300 g were used. Adenovirus containing either the rat leptin cDNA (AdCMV-leptin) or the β-galactosidase cDNA with the cytomegalovirus (CMV) promoter was prepared and administered intravenously as described (1). Body weight measurements confirmed weight loss. Hyperleptinemia was quantified by leptin RIA of plasma (Linco Research Immunoassay, St. Charles, MO). Tri-iodothyronine was measured with the DiaSorin Free T3 RIA kit (Stillwater, MN). Rats were killed under pentobarbital anesthesia at 7, 10, or 14 days after injection. An epididymal fat pad or its remnant was resected from each rat and fixed for microscopy or frozen in liquid nitrogen for mRNA or protein analysis.
Processing for Light and Electron Microscopy. Epididymal fat pads and fat pad remnants from hyperleptinemic and control animals were fixed in 2% glutaraldehyde in 0.1 M cacodylate buffer (pH 7.4). For conventional electron microscopy, the samples were postfixed with OsO4, dehydrated with alcohol, and embedded in Epoxy embedding medium (Epon; Fluka). For light microscopy immunohistochemistry, the OsO4 step was omitted. For electron microscopy immunocytochemistry, samples of glutaraldehyde-fixed epididymal fat were embedded in 12% gelatin, infused with 2.3 M sucrose, and frozen in liquid nitrogen for cryoultramicrotomy. Ultrathin cryosections were cut at –120°C and picked up with a mixture (1:1) of 2.3 M sucrose and 1.8% methylcellulose (6). Semithin (1-μm thick) sections of Epon-embedded fat were examined by phase contrast microscopy. Immunofluorescence reactions were performed on semithin sections of nonosmicated tissue after removal of Epon. Sheep anti-collagen lV (a gift of G. Martin, National Institute of Aging, Bethesda, MD) was used at 1:1,000 dilution, followed by FITC-conjugated rabbit anti-sheep IgG (Biosys, Columbia, MD). Ultrathin cryosections were incubated with sheep antibody to collagen IV (1:2,000 dilution) or rabbit antibody to mouse perlecan (a gift of J. Hassel, University of Pittsburgh, Pittsburgh, PA) diluted at 1:250. The sections were subsequently incubated with rabbit anti-sheep antibody followed by protein A-gold (for anti-collagen IV) or directly with protein A-gold (for anti-perlecan). For quantification of adipocyte size, semithin sections (1- to 2-μm thick) or thin sections were analyzed by using a Zeiss Axiophot microscope equipped with an AxioCam digital camera. Data of sectional area and cell perimeter were obtained by using the axiovision software for digital image processing. Data are presented as mean ± SEM.
Real-Time PCR Analysis of mRNA. To quantify mRNA by real-time RT-PCR, total RNA was prepared from frozen tissue samples by using Trizol according to the manufacturer's protocol (Invitrogen). Genomic DNA was removed from the total RNA preparations by using DNA-free Dnase 1 (Ambion, Austin, TX). RNA from each sample was diluted to 5 ng/μl, and 100 ng of RNA was reverse transcribed in a 100-μl reaction with random hexamers (TaqMan Reverse Transcription kit, Applied Biosystems) as described (7). Data were analyzed by using sds 2.1 software (Applied Biosystems). Relative quantification of gene expression was by the comparative CT method with 36B4 mRNA as an endogenous control (User Bulletin no. 2, Applied Biosystems). Primers were designed with primer express 2.0 (Applied Biosystems). Their sequences are shown in Table 2, which is published as supporting information on the PNAS web site.
Immunoblotting Analysis. Total cell extracts prepared from fat tissues of lean +/+ rats that were treated with AdCMV-leptin virus for 14 days were resolved by SDS/PAGE and transferred to poly(vinylidene difluoride) membrane (Amersham Pharmacia Biosciences). The blotted membrane was treated in 1× Tris-buffered saline containing 0.1% Tween 20 and 5% nonfat dry milk for 1 h at room temperature with gentle, constant agitation. The following antibodies were used: anti-acetyl CoA carboxylase (ACC) (Alpha Diagnostic, San Antonio, TX), anti-AMPKα and anti-phospho-AMPK (Thr-172) (Cell Signaling Technology, Beverly, MA), anti-phospho-ACC (Ser-79) (Upstate Biotechnology, Lake Placid, NY), anti-cytochrome c (BD Biosciences/Pharmingen), anti-cytochrome c oxidase IV subunit 5b (Molecular Probes), and anti-uncoupling proteins (UCP)-1 and -2 (Alpha Diagnostics).
Results
Clinical Effects of Adenovirus-Induced Hyperleptinemia. Lean wild-type (+/+) Zucker diabetic fatty rats with an average body weight of 280 ± 20 g received recombinant adenovirus containing the leptin cDNA. Body weight declined to 207 ± 5 g in 14 days. Plasma leptin levels rose from 3.5 ± 1.2 ng/ml before treatment to a value of 265 ± 88 ng/ml 7 days later, followed by a decline to 36 ± 12 ng/ml at 14 days. Tri-iodothyronine levels were normal. Hyperleptinemic animals were in their usual state of health, except for a 30% reduction in food intake.
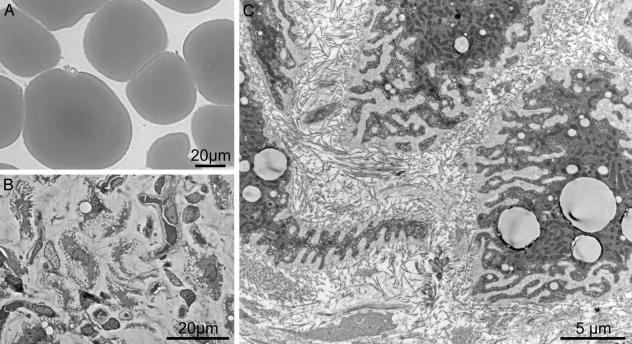
Microscopic Features of Lipid-Depleted Adipocytes. After induction of hyperleptinemia, the epididymal fat pad was rapidly transformed into a fatless, hypervascular fat pad remnant (data not shown). In the place of the well differentiated spheroidal adipocytes present in control rats (Fig. 1A), semithin sections of the remnant fat pad revealed irregularly shaped shrunken cells in a well vascularized stroma with extreme folding of the cell surface (Fig. 1B). There was a dramatic decrease in the size of leptinized adipocytes when compared with fat cells of control rats: the sectional area of untreated control adipocytes declined in 14 days from 4,147 ± 255 μm2 to 102 ± 6 μm2, whereas cell perimeter was proportionally less reduced (from 313 ± 11 μm to 183 ± 20 μm), as expected from the highly indented surface of postadipocytes.
Fig. 1.
Hyperleptinemia induces extensive lipid depletion in adipose tissue. (A) Semithin section of normal epididymal fat pad tissue from control rats 14 days after infusion with β-galactosidase adenovirus. (B) Epididymal fat cells 14 days after infusion with leptin adenovirus. The cells are fat-depleted with a few residual lipid droplets and a highly indented surface. (C) Low magnification electron microscopic view showing a highly convoluted surface of postadipocytes embedded within an exceedingly thick layer of apparently amorphous material, which separates individual cells from the collagen-fibril-rich interstitial matrix.
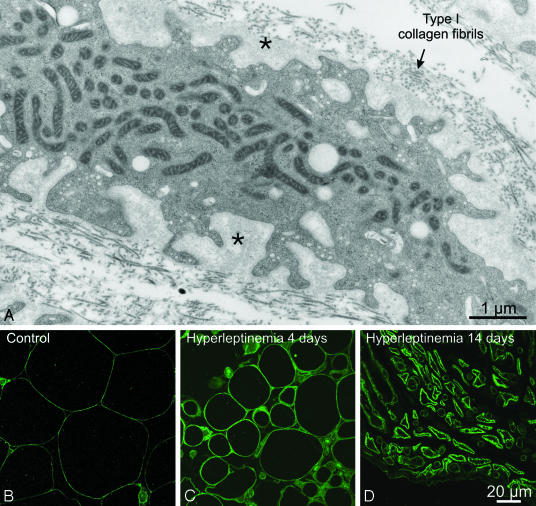
A thick pericellular matrix filled the infoldings of the cell surface (Fig. 1C). At higher magnification (Fig. 2A), the matrix displayed a texture similar to, albeit less compact than, that of the basal lamina that surrounds well differentiated adipocytes. In contrast to the thin line of collagen IV immunofluorescent staining that surrounds normal adipocytes (8) (Fig. 2B), collagen IV immunofluorescence thickened progressively in the leptinized cells (Fig. 2 C and D).
Fig. 2.
Ultrastructural and immunocytochemical features of the postadipocyte pericellular matrix. (A) Postadipocytes from rats infused for 14 days with leptin adenovirus are surrounded by a very thick layer of finely granular material (asterisks) that separates them from the collagen fibrils of the interstitial matrix. (B) Immunocytochemical localization of collagen type IV in control epididymal fat pad tissue. Immunoreactivity is detected as a thin, faint line surrounding each individual adipocyte and corresponding to the location of the basal lamina. (C) Four days after the infusion of leptin adenovirus, adipocytes still present a spheroidal shape, but their size has decreased. Collagen IV staining at the cell periphery appears considerably thicker than in control rats. (D) After 14 days of hyperleptinemia, adipocytes are further reduced in size, and their highly indented surface displays a thick, scalloped collagen IV immunoreactivity.
Although electron microscopy revealed ImmunoGold labeling for collagen IV and perlecan (two major components of basement membranes) to be present throughout the pericellular matrix (data not shown), the mRNAs of collagen IV, perlecan, and laminin α4 and β1 chains were not increased (Table 2) nor was there a reduction in the mRNAs of three matrix metalloproteinases involved in extracellular matrix remodeling (Table 2). However, the expression of the physiological metalloproteinase inhibitors TIMP-1, -2, and -3 (9) was increased at 7 days but not thereafter (Table 2). Expression of β1 integrins, which play an important role in basement-membrane assembly (10), was markedly reduced at 10 and 14 days of hyperleptinemia (Table 2), raising the possibility that β1 integrins were insufficient for the formation of a normal basal lamina.
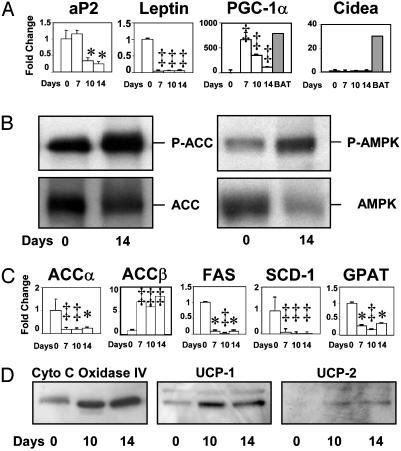
Expression of Adipocyte Cell Markers. To determine whether the lipid-depleted white adipocytes had been converted to a closely related fat-burning cell type, brown adipocytes, we assessed the protein or mRNA of genes that are normally expressed at high levels in those cells. UCP-1, normally found only in brown adipose tissue, was present by immunoblotting in the white fat of the leptinized rats (Fig. 3D), but it was well below the levels normally present in brown adipose tissue. Cidea mRNA, which is present in brown adipocytes (11), was not detected (Fig. 3A). The molecular hallmarks of mature white adipocytes, such as adipocyte fatty acid-binding protein 2 (aP2) and leptin, had disappeared (Fig. 3A), but some brown adipocytes markers, such as Cidea, were absent. For this reason they were designated postadipocytes.
Fig. 3.
Effects of adenovirus-induced hyperleptinemia on epididymal white fat tissue. (A) Effect of adenovirus-induced hyperleptinemia on the mRNA of genes normally expressed at high levels in mature white adipocytes [adipocyte fatty acid-binding protein 2 (aP2) and leptin] and on genes normally expressed at high levels only in brown adipocytes (BAT). mRNA is expressed as fold change from 0 time. (0 time: n = 4; 7 days: n = 4; 10 days: n = 3; 14 days: n = 3.) *, P < 0.05; ‡, P < 0.01. (B) Effect of adenovirus-induced hyperleptinemia on the total AMPK and Thr-172-phosphorylated α-subunit of AMPK and the total ACC and the Ser-79-phosphorylated ACCα and -β. We assume that it is largely the β isoenzyme, because ACCα mRNA was so strongly down-regulated (see below). Phosphorylation inactivates ACC and activates AMPK. (C) Effect of hyperleptinemia on mRNA of key lipogenic enzymes ACCα, ACCβ, fatty acid synthase (FAS), stearoyl CoA desaturase 1 (SCD-1), and glycerol-3-phosphate acyl transferase (GPAT) expressed as fold change at 7, 10, and 14 days after treatment. *, P < 0.05; ‡, P < 0.01. (D) Immunoblotting showing effects of hyperleptinemia on mitochondrial proteins cytochrome c oxidase IV subunit 5b and UCP-1 and -2.
Expression of Transcription Factors of Lipid Metabolism. Neither PPARα, which targets enzymes of fatty acid oxidation and is necessary for the fat-depleting action of hyperleptinemia on adipocytes (12), nor PPARδ, recently shown to activate fat burning (13), were altered by hyperleptinemia. The adipogenic transcription factors SREBP-1c, ChREBP, and FOXO1 (14), but not PPARα, were significantly suppressed during the first week of hyperleptinemia, whereas the anti-adipogenic factor FOXC2 (15) was significantly increased (Table 1).
Table 1. Relative changes in transcription factor mRNA content.
| Transcription factor
|
Days of hyperleptinemia
|
|||
|---|---|---|---|---|
| 0 (n = 4) | 7 (n = 4) | 10 (n = 3) | 14 (n = 3) | |
| PPARα | 1 ± 0.11 | 0.70 ± 0.16 | 1.02 ± 0.06 | 1.18 ± 0.08 |
| PPARγ | 1 ± 0.09 | 0.65 ± 0.09 | 0.60 ± 0.06 | 0.87 ± 0.06 |
| PPARδ | 1 ± 0.14 | 1.46 ± 0.31 | 0.86 ± 0.08 | 1.33 ± 0.11 |
| LXRα | 1 ± 0.20 | 2.36 ± 0.77* | 1.65 ± 0.09* | 2.08 ± 0.18* |
| SREBP-1c | 1 ± 0.09 | 0.45 ± 0.09* | 0.91 ± 0.06 | 1.39 ± 0.26 |
| ChREBP | 1 ± 0.31 | 0.25 ± 0.03* | 0.26 ± 0.11* | 0.58 ± 0.14* |
| FOXO1 | 1 ± 0.10 | 0.66 ± 0.13* | 0.17 ± 0.06* | 0.21 ± 0.07* |
| FOXC2 | 1 ± 0.18 | 2.47 ± 0.95* | 1.95 ± 0.09* | 4.84 ± 0.20* |
| C/EBPα | 1 ± 0.15 | 1.34 ± 0.35 | 0.81 ± 0.18 | 1.65 ± 0.22* |
, P < 0.05. LXR, liver X receptor; SREBP, sterol regulatory element-binding protein; ChREBP, carbohydrate-responsive element-binding protein; FOXO1, Forkhead transcription factor FKHR; FOXC2, another Forkhead transcription factor; C/EBP, CCAAT/enhancer-binding protein.
Activity and Expression of Enzymes of Fat Metabolism. Conversion of adipocytes from fat-storing to fat-burning cells could be the result of a reduction in malonyl CoA, the substrate for lipogenesis and an inhibitor of fatty acid oxidation (16). Because malonyl CoA production can be blocked by phosphorylation of ACC (17), we measured P-ACC (α plus β) in the fat pad remnant and found it to be increased compared to unleptinized control rats (Fig. 3B). Because ACC phosphorylation is catalyzed by AMPK, which is activated by phosphorylation (17, 18), we also measured P-AMPK. It, too, was increased in the fat tissue of leptinized rats (Fig. 3B), confirming the finding of Minokoshi et al. (19). It is likely that the increase in P-AMPK, by inactivating ACC, was a factor in the lipid depletion in adipocytes.
To determine the role of down-regulation of expression of lipogenic enzymes, we measured the mRNAs of ACCα and ACCβ, fatty acid synthase (FAS), stearoyl CoA desaturase 1 (SCD-1), and glycerol-3-phosphate acyl transferase (GPAT) (shown in Fig. 3C) and ATP citrate-lyase (data not shown). Except for ACCβ, which rose ≈8-fold, all were significantly reduced at all points measured after leptin treatment (Fig. 3C), suggesting that reduced biosynthesis of new ACCα, as well as inactivation of ACCβ, may contribute to the fat loss. There was no change in the expression of the oxidative enzymes carnitine-palmitoyl transferase 1 or acyl CoA oxidase (Table 2).
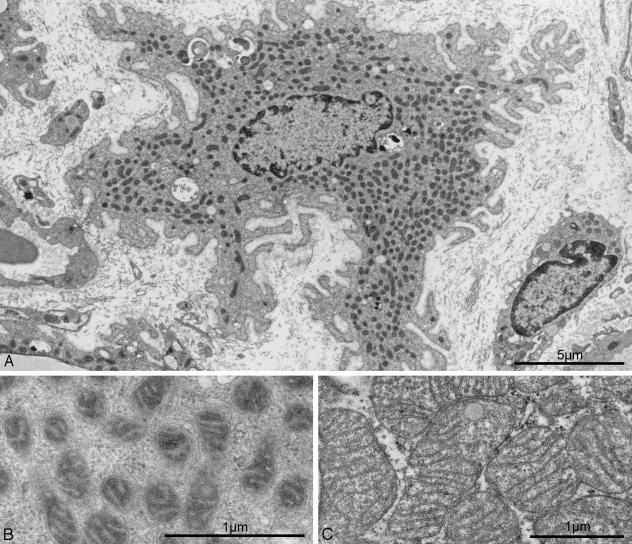
Hyperleptinemia Converts White Adipocytes into Mitochondria-Rich Cells. Conversion of a fat-storing cell into a fat-burning cell would require a substantial up-regulation of mitochondria. The most remarkable ultrastructural finding in postadipocytes was a profusion of filamentous mitochondria (Figs. 2A and 4A) containing numerous cristae embedded in a highly electron-dense matrix (Fig. 4B). The apparent increase in mitochondria cannot be explained entirely by the reduction in cytoplasmic volume resulting from lipid depletion, because starvation-induced volume reduction of adipocytes is not associated with a comparable abundance of mitochondria (20). Moreover, the mitochondria in starvation are pleomorphic and have a less electron-dense matrix (20). The postadipocyte mitochondria differ from those of brown adipocytes, which are much larger and more spherical with cristae that traverse the entire width of the organelle (Fig. 4C). There was also an increase in mitochondrial proteins cytochrome c oxidase IV and UCP-1 and -2 (Fig. 3D) but not in cytochrome c (data not shown).
Fig. 4.
Mitochondrial ultrastructure in hyperleptinemic white postadipocytes and in brown adipocytes. (A) Mitochondrial abundance in the cytoplasm of a postadipocyte. (B) Higher magnification of a hyperleptinemia-induced postadipocyte reveals that mitochondrial cristae are embedded in an electron-dense matrix. (C) Mitochondria from an untreated brown adipocyte. Although the magnification is lower than that in B, mitochondria appear much larger than those of white postadipocytes. In addition, their matrix is less electron-dense than in mitochondria of white postadipocytes, and their cristae traverse the entire width of the organelle.
To determine the mechanism of the apparent increase in mitochondria we measured PGC1-α, which regulates mitochondrial biogenesis in brown adipocytes and muscles of normal animals (21–23) but is very low in white adipose tissue. Consistent with the increased mitochondrial abundance, PGC-1α mRNA was strikingly elevated in the postadipocytes, reaching at 7 days after leptinization the levels found in brown adipose tissue (Fig. 3A). A progressive decline in PGC-1α mRNA followed as fat disappeared. There were no important changes in the mRNA of various factors involved in PGC-1α activation and actions and in mitochondrial functions other than a decline in the mRNA of nuclear respiratory factor (NRF-1) and mitofusin (Table 2).
Discussion
In the unique type of fat loss induced by hyperleptinemia, the fatty acids appear to be oxidized inside the white adipocytes (2) rather than released and carried to the liver for oxidation to ketones, the classical pathway in other fat-losing conditions (3). In this article, we describe profound morphological and molecular changes in white adipose cells that are consistent with their transformation by hyperleptinemia into fat-burning cells.
Normal-appearing, fat-filled adipocytes were replaced by irregularly shaped, fat-depleted, shrunken cells with extensive infoldings of the cell membrane. These cells could be identified as “former” white adipocytes by tiny residual fat droplets. A thick layer of diffuse basement-membrane-like matrix surrounded these postadipocytes, but the mRNA levels for basement-membrane proteins and for matrix metalloproteinases and their inhibitors provided no clue as to mechanism. Conceivably, the marked decrease in β1 integrin prevented the assembly of basement-membrane components into a condensed extracellular matrix layer (10).
The postadipocytes contained a profusion of mitochondria that differed in size and appearance from the much larger mitochondria of brown adipocytes, in which the cristae traverse the entire organelle. This mitochondrial abundance was accompanied by profound changes in the expression profile of postadipocytes. Most striking of these changes was the increase in PGC-1α mRNA, which rose from the very low levels normally present in white adipose tissue to those of brown adipose tissue (Fig. 3A). Because PGC-1α is involved in mitochondrial biogenesis (21–23), its increase may have played a role in the abundance of mitochondria in postadipocytes. Indeed, when PGC-1α is not increased, as in fat cells of adenovirus-leptin-treated PPARα-null mice, the hyperleptinemia fails to induce adipocyte fat loss (12). Because forced expression of PGC-1α in human fat cells enhances their oxidation of fatty acids (24), it is quite likely that its increase was responsible for the loss of fat through “internal combustion.”
The intraadipocyte disappearance of fat induced by hyperleptinemia differs sharply from that of starvation and insulin deficiency, in which fatty acids are released from adipocytes and oxidized in the liver. The increased fatty acid oxidation inside white fat tissue can be explained by the changes in the phosphorylation state of key liporegulatory enzymes. The phosphorylation of ACCβ would reduce mitochondrial malonyl CoA (25), thereby increasing fatty acid oxidation, whereas the down-regulation of genes encoding lipogenic enzymes, such as ACCα and other lipogenic enzymes, would reduce their capacity to form new fat. The inactivation of ACCβ by phosphorylation (Fig. 3B) would lower malonyl CoA and thus enhance oxidation of the existing fatty acids (16). Finally, the abundance of mitochondria, induced by the high PGC-1α levels, would expand the oxidative machinery required for enhanced oxidation, while increased UCP-1 and -2 protein would dissipate the unneeded energy as heat. Although this combination of events was reminiscent of hyperthyroidism, tri-iodothyronine levels were not increased in the plasma of the leptinized rats.
The metamorphosis of fat-storing white adipocytes into fat-oxidizing cells may have important therapeutic implications for the treatment of obesity. The fat loss induced here was far more rapid and profound than can be induced by caloric restriction. Moreover, it was devoid of the ketonemia, loss of lean body mass, hunger, and other side effects that plague this form of therapy. Control rats pair-fed to the overleptinized animals were clearly unwell, exhibiting ketonemia, reduced physical activity, obvious hunger, and evidence of negative nitrogen balance, whereas the hyperleptinemic rats seemed healthy and normally active or hyperactive, except for disinterest in food. In addition, the fat loss persisted for months after the hyperleptinemia had waned, whereas fat lost through dietary restriction was recovered far more rapidly. This phenomenon could be the result of severe hypoleptinemia induced by caloric restriction; indeed, it has been demonstrated that caloric restriction plus the maintenance of normoleptinemia with leptin replacement is more effective than caloric restriction alone (26), and it is possible that hyperleptinemia would be even more so.
It is unclear from these results whether the hyperleptinemia acted directly on the adipocytes or by means of a central mechanism. Despite the importance of hypothalamic mediation of leptin actions, there is evidence that, at least at high concentrations, leptin acts directly on white adipocytes. Leptin acts on normal cultured adipocytes in vitro, causing effects similar to those observed here (5), and it causes the complete disappearance of fat in denervated fat pads in vivo (27), strong evidence for a direct effect, at least in part.
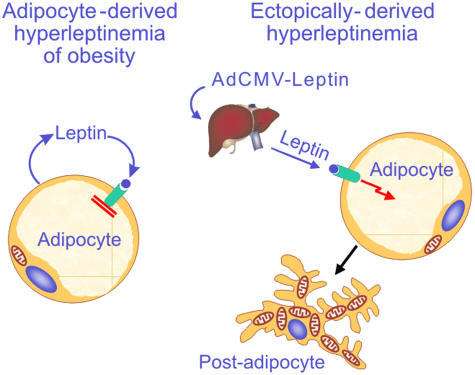
If this interpretation is true, it begs the question as to why the high leptin levels in the interstitial fluid surrounding the adipocytes of rats with diet-induced obesity cannot induce in adipocytes the same changes that are induced by the nonadipocyte-derived hyperleptinemia, even though the interstitial leptin levels must be comparable. We hypothesize that to maintain their vital function of fuel storage and conservation, the adipocytes must mount a powerful defense against their own leptin to prevent wasteful loss of their fat stores, such as we induced here (Fig. 5). If this defense against the leptin that they release could be pharmacologically inactivated or circumvented, a futile cycle would be created in which an increase in intraadipocyte fatty acids would trigger a leptin-induced increase in intraadipocyte fatty acid oxidation. Such an effect would make obesity impossible and might lead to a quick and safe solution of the obesity problem.
Fig. 5.
Comparison of the effects of endogenous (adipocyte-derived; Left) and ectopic (liver-derived; Right) hyperleptinemia on white adipocyte morphology. (Left) As obesity develops, the accumulation of triglycerides is accompanied by progressively increasing hyperleptinemia. The fat-burning action of the hyperleptinemia on the adipocytes is completely blocked, possibly by factor(s) that are coexpressed with leptin. This blockade preserves the physiologic mission of the adipocytes, which is to store fat so as to provide fat fuel during famine. (Right) When the hyperleptinemia is ectopically derived, as in normal rats treated with recombinant adenovirus containing the leptin cDNA, there is no blockade of leptin action on adipocytes. Liver-derived hyperleptinemia rapidly transforms adipocytes into mitochondria-rich, fat-burning postadipocytes that are essentially fatless.
Supplementary Material
Acknowledgments
We are grateful to A. Widmer and M. Ebrahim Malek for skillful technical assistance and to Christie Fisher and Nadine Dupont for excellent secretarial work. We thank Michael S. Brown, M.D., Cai Li, Ph.D., and Joyce Repa, Ph.D., for critical examination of the manuscript. This work was supported by grants from the National Institute of Diabetes and Digestive and Kidney Diseases (to R.H.U.) and the Swiss National Science Foundation (to L.O. and R.M.).
Abbreviations: AMPK, AMP-activated kinase; PPAR, peroxisome proliferator-activated receptor; PGC-1α, PPARγ coactivator 1α; UCP, uncoupling protein; ACC, acetyl CoA carboxylase.
References
- 1.Chen, G., Koyama, K., Yuan, X., Lee, Y., Zhou, Y. T., O'Doherty, R., Newgard, C. B. & Unger, R. H. (1996) Proc. Natl. Acad. Sci. USA 93, 14795–14799. [DOI] [PMC free article] [PubMed] [Google Scholar]
- 2.Shimabukuro, M., Koyama, K., Chen, G., Wang, M. Y., Trieu, F., Lee, Y., Newgard, C. B. & Unger, R. H. (1997) Proc. Natl. Acad. Sci. USA 94, 4637–4641. [DOI] [PMC free article] [PubMed] [Google Scholar]
- 3.Cahill, G. F., Jr., Aoki, T. T. & Ruderman, N. B. (1973) Trans. Am. Clin. Climatol. Assn. 84, 184–202. [PMC free article] [PubMed] [Google Scholar]
- 4.Zhou, Y. T., Shimabukuro, M., Koyama, K., Lee, Y., Wang, M. Y., Trieu, F., Newgard, C. B. & Unger, R. H. (1997) Proc. Natl. Acad. Sci. USA 94, 6386–6390. [DOI] [PMC free article] [PubMed] [Google Scholar]
- 5.Wang, M. Y., Lee, Y. & Unger, R. H. (1999) J. Biol. Chem. 274, 17541–17544. [DOI] [PubMed] [Google Scholar]
- 6.Liou, W., Geuze, H. J. & Slot, J. W. (1996) Histochem. Cell Biol. 106, 41–58. [DOI] [PubMed] [Google Scholar]
- 7.Bustin, A. (2000) J. Mol. Endocrinol. 25, 169–193. [DOI] [PubMed] [Google Scholar]
- 8.Pierleoni, C., Verdenelli, F., Castellucci, M. & Cinti, S. (1998) Eur. J. Histochem. 42, 183–188. [PubMed] [Google Scholar]
- 9.Sternlicht, M. D. & Werb, Z. (2001) Annu. Rev. Cell Dev. Biol. 17, 463–516. [DOI] [PMC free article] [PubMed] [Google Scholar]
- 10.Lohikangas, L., Gullberg, D. & Johansson, S. (2001) Exp. Cell Res. 265, 135–144. [DOI] [PubMed] [Google Scholar]
- 11.Zhou, Z., Yon Toh, S., Chen, Z., Guo, K., Ng, C. P., Ponniah, S., Lin, S. C., Hong, W. & Li, P. (2003) Nat. Genet. 35, 49–56. [DOI] [PubMed] [Google Scholar]
- 12.Lee, Y., Yu, X., Gonzales, F., Mangelsdorf, D. J., Wang, M. Y., Richardson, C., Witters, L. A. & Unger, R. H. (2002) Proc. Natl. Acad. Sci. USA 99, 11848–11853. [DOI] [PMC free article] [PubMed] [Google Scholar]
- 13.Wang, Y.-X., Lee, C.-H., Tiep, S., Yu, R., Ham, J., Kang, H. & Evans, R. M. (2003) Cell 113, 159–190. [DOI] [PubMed] [Google Scholar]
- 14.Nakae, J., Kitamura, T., Kitamura, Y., Biggs, W. H., III, Arden, K. C. & Accili, D. (2003) Dev. Cell 4, 119–129. [DOI] [PubMed] [Google Scholar]
- 15.Cederberg, A., Gronning, L. M., Ahren, B., Tasken, K., Carlsson, P. & Enerback, S. (2001) Cell 106, 563–573. [DOI] [PubMed] [Google Scholar]
- 16.McGarry, J. D., Mannaerts, G. P. & Foster, D. W. (1977) J. Clin. Invest. 60, 265–270. [DOI] [PMC free article] [PubMed] [Google Scholar]
- 17.Hardie, D. G. (2003) Endocrinology 144, 5179–5183. [DOI] [PubMed] [Google Scholar]
- 18.Saha, A. K. & Ruderman, N. B. (2003) Mol. Cell Biochem. 253, 65–70. [DOI] [PubMed] [Google Scholar]
- 19.Minokoshi, Y., Kim, Y. B., Peroni, O. D., Fryer, L. G., Muller, C., Carling, D. & Kahn, B. B. (2002) Nature 415, 339–343. [DOI] [PubMed] [Google Scholar]
- 20.Napolitano, L. & Gagne, H. T. (1963) Anat. Rec. 147, 273–280. [DOI] [PubMed] [Google Scholar]
- 21.Lehman, J. J., Barger, P. M., Kovacs, A., Saffitz, J. E., Medeiros, D. M. & Kelly, D. P. (2000) J. Clin. Invest. 106, 847–856. [DOI] [PMC free article] [PubMed] [Google Scholar]
- 22.Puigserver, P., Wu, Z., Park, C. W., Graves, R., Wright, M. & Spiegelman, B. M. (1998) Cell 92, 829–839. [DOI] [PubMed] [Google Scholar]
- 23.Wu, Z., Puigserver, P., Andersson, U., Zhang, C., Adelmant, G., Mootha, V., Troy, A., Cinti, S., Lowell, B., Scarpulla, R. C. & Spiegelman, B. M. (1999) Cell 98, 115–124. [DOI] [PubMed] [Google Scholar]
- 24.Tiraby, S., Tavernier, G., Lefort, C., Larrcuy, D., Bouillaud, F., Ricquier, D. & Langin, D. (2003) J. Biol. Chem. 278, 33370–33376. [DOI] [PubMed] [Google Scholar]
- 25.Abu-Elheiga, L., Oh, W., Kordari, P. & Wakil, S. J. (2003) Proc. Natl. Acad. Sci. USA 100, 10207–10212. [DOI] [PMC free article] [PubMed] [Google Scholar]
- 26.Rosenbaum, M., Murphy, E. M., Heymsfield, S. B., Matthews, D. E. & Leibel, R. L. (2002) J. Clin. Endocrinol. Metab. 87, 2391–2394. [DOI] [PubMed] [Google Scholar]
- 27.Wang, Z.-W., Zhou, Y. T., Lee, Y., Higa, M., Kalra, S. & Unger, R. H. (1999) Biochem. Biophys. Res. Commun. 260, 653–657. [DOI] [PubMed] [Google Scholar]
Associated Data
This section collects any data citations, data availability statements, or supplementary materials included in this article.


