

Abstract
We report cadmium-free, biocompatible (Zn)CuInS2 quantum dots with long fluorescence lifetimes as superior bioimaging probes using time-gated detection to suppress cell autofluorescence and improve the signal:background ratio by an order of magnitude. These results will be important for developing non-toxic fluorescence imaging probes for ultrasensitive biomedical diagnostics.
Fluorescence microscopy techniques for cellular imaging are vital to the exploration of microscopic structures involved in biological processes and for biomedical diagnostics.1 Such imaging requires the targeting of highly fluorescent optical probes as biomarkers for specific molecules in cells.2 Molecular fluorophores based on synthetic organic fluorescent dyes and genetically engineered fluorescent proteins are widely used as conventional probes in cell imaging.3 However, a major drawback of conventional fluorescence microscopy is that the fluorescence signal from the tagged molecules is collected together with background fluorescence (autofluorescence) from the cell matrix and scattered light resulting in a reduction in detection sensitivity. Molecular fluorophores that emit in the red or near infrared spectral regions, where cell autofluorescence is low, often suffer from low quantum yields. Furthermore, permanent photobleaching of molecular fluorophores makes it difficult to view the same region over long period of time, and is a particular problem for red-emitting molecular fluorophores. Quantum dots (QDs) have several advantages over conventional molecular fluorophores.4 Their emission wavelength can be tuned by varying their size and composition and, due to their narrow emission width, it is easier to perform multicolour imaging with minimal spectral overlap. Due to their broad excitation spectra, it is possible to excite all colours of QDs simultaneously with a single light source.5 Furthermore, they display excellent photostability over molecular fluorophores. These unique optical properties have allowed QDs to emerge as a strong competitor as fluorescent probes for labelling experiments.6 However, their widespread biological use is severely limited by the presence of cadmium as a major component in most commercially available QDs. A number of reports have discussed the toxicity effects of cadmium-based QDs, as cadmium ions may diffuse into the biological environment with time.7 In addition to possible effects on health, there are significant environmental concerns regarding the use and disposal of cadmium-based nanomaterials.
Due to such toxicity and environmental concerns, a current major focus is on developing new, cadmium-free QDs as safe and non-toxic probes for biological use,8 which should maintain these advantageous optical properties and potential for clinical applications. I-III-VI ternary nanoparticles, specifically CuInS2-based nanomaterials are emerging as one such promising candidate. They do not contain toxic elements and, being direct band-gap semiconductors, their optical properties can be tailored by composition and size. Adding a ZnS shell to CuInS2 or alloyed ZnCuInS2 cores ((Zn)CIS/ZnS) result in high quantum yields and long emission lifetimes emitting from the visible to near-infrared (NIR) spectral region.9 In fact, the fluorescence lifetime of these QDs is longer than Cd-based QDs. One disadvantage of these materials is that their spectral line width is much wider than Cd-based QDs, which may limit their effectiveness in conventional spectral filter-based fluorescence imaging. In this communication, we specifically take advantage of the long fluorescence lifetime to show that to show that time-gated imaging (TGI) is a viable, and even superior, alternative to filter-based fluorescence imaging so that their wider spectral line width is no longer a disadvantage. We successfully labelled Her2 on human SK-BR-3 breast cancer cells and show that the detection sensitivity of CIS/ZnS QDs is at least as good as Cd-based QDs, and far superior to molecular-based probes. To the best of our knowledge, this is the first report of using Cd-free QDs for ultrasensitive imaging of breast cancer cells using TGI to reduce cell autofluorescence.
(Zn)CIS/ZnS and CdSe/ZnS nanocrystals were synthesized as described previously.10 To render them water soluble, the surface of the QDs are coated with amphiphilic poly(maleic anhydride-alt-1-octadecene) via hydrophobic interactions.11 This polymer has multiple carboxylic groups to solubilize the QDs in aqueous solution and allows them to be coupled to lysine residues. After purification of the QD-bioconjugates by ultracentrifugation, QDs were resuspended in borate buffer. Fig. 1 shows the UV-visible and luminescence spectra of the CIS/ZnS and CdSe/ZnS QDs. The maximum emission wavelength of CdSe/ZnS and CIS/ZnS was 622 nm and 628 nm, respectively, and show spectral line widths of ~24 nm and ~107 nm. The quantum yields were found to be 60% and 30%, respectively. Although CIS/ZnS have a lower QY and wider spectral line widths we will show that they perform just as well as the higher QY and narrower-emitting CdSe/ZnS QD for TGI.
Figure 1.
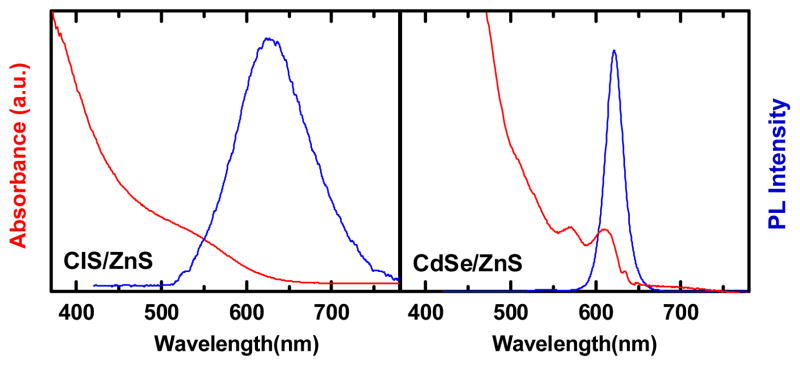
Absorption and photoluminescence spectra of CIS/ZnS and CdSe/ZnS QDs
The fluorescence lifetime decay curves of CIS/ZnS QDs in solution show a longer fluorescence lifetime than CdSe/ZnS (21.0 ns vs 8.24 ns, respectively, Fig. 2). It has been suggested that a longer radiative recombination rate originates from defect states within the QD which results in a longer lifetime of CIS/ZnS QDs compared to CdSe/ZnS, which also explains the lower relative quantum yield.12 These lifetimes are much longer lifetimes than cell autofluorescence of SK-BR-3 cells (~ 1.5 ns), and when the CIS/ZnS QDs are bound to cells (green curve), the fluorescence decay is a convolution of the quickly decaying autofluorescence and the slowly decaying CIS/ZnS QD fluorescence. It is this large difference in fluorescence lifetime that allows for selective removal of cell autofluorescence by time-gated imaging.
Figure 2.

Lifetime decay curves of CdSe/ZnS QDs, CIS/ZnS QDs and SK-BR-3 cells with and without CIS QDs. Average Lifetime is calculated from multi-exponential fitting: τavg = Σi Aiτi, with i = 3, Ai is the fractional amplitude (Σi Ai = 1) and τi are the lifetimes of each decay component
To highlight the utility of our Cd-free CIS/ZnS QDs for time-gated imaging, we have labelled Her2 receptors on the surface of human SK-BR-3 cells using Herceptin® (Genentech, San Francisco, CA), a monoclonal anti-Her2 antibody, that was tagged with either CIS/ZnS, CdSe/ZnS QDs or the molecular fluorophore AlexaFluor 488. Our experimental setup consists of a Picoquant Microtime 200 scanning confocal microscope, and has been previously described.13 Briefly, in this experiment, a 485 nm pulsed laser is reflected from a dichroic mirror (500DCXR, Chroma, Bellows Falls, VT) through a water-immersion objective (UPlanApo 60×/1.20w, Olympus, Tokyo, Japan) and focused to a diffraction-limited spot. The emitted light is collected by the same objective, passes through the same dichroic, a 100 μm pinhole, and finally an emission filter (605/55m, Chroma) before being detected onto an avalanche photodiode (PDM series, MPD, Bolzano, Italy). A piezo scanner (PI, Berlin, Germany) moves the objective in the x–y plane point-by-point to build up the images. Due to the time-tagging of every photon, each pixel contains a fluorescence lifetime curve. This curve that can be fit to a series of exponential functions to find the average lifetime of the pixel, and colour coded accordingly, with its intensity modulated to the brightness (i.e. total number of photons collected). Alternatively, we can set a time-gate to omit photons collected within a user-selected time window following the laser pulse, which can be set post-measurement, depending on the fluorescence lifetime of the probe. Fig. 3 shows the results of this experiment. The upper panels show the fluorescence intensity images, the middle panels are the fluorescence lifetime imaging (FLIM) images, and the lower panels are the fluorescence intensity images after applying a 10 ns time-gate of SK-BR-3 cells incubated with QD (or dye)-anti-Her2 conjugates.
Figure 3.

Fluorescence intensity images with two cells labeled 1 and 2 that are difficult to quantify in terms of extent of labeling; Middle row: FLIM images; ranging from 1ns (blue) to 16 ns (red); Bottom row: Image after time-gating the first 10 ns of photons significantly improving contrast, and removes unlabeled cells from the images.
Due to the specific binding of the antibody to the membrane-bound receptor, Her2, both NP-anti-Her2 conjugates and A488-anti-Her2 conjugates specifically stained the cell membranes of SK-BR-3. Due to the distinct differences between the lifetime of the cell autofluorescence (coloured blue in the FLIM images) and the NPs (which are coloured red/green in the FLIM images) the specific staining of Her2 is immediately obvious. This staining is not as obvious for the A488 due to the lower molecular brightness of the dye and the similarity in lifetime. The lifetime of A488 is slightly longer that cell autofluorescence, which is visible in the FLIM images. Under the same excitation conditions with the 485 nm laser, the emission intensity of both CdSe/ZnS and CIS/ZnS NPs is much stronger than the autofluorescence of the cells. As expected, there is a distribution of brightness from cell-to-cell, and it can be difficult to determine from the intensity images cells with low labelling levels. It is known that using a band pass filter can reduce cell autofluorescence, but it is often insufficient for significantly improving the signal to background signal for quantitative imaging since cell autofluorescence is generally broad, and overlaps with most dyes. By applying the 10 ns time gate as shown in Fig. 3, it is clear that the images show much clearer contrast between NP-labelled Her2 on the cell membrane and those exhibiting cell autofluorescence. Furthermore, we can identify and remove cells with high autofluorescence from those that contain only a small amount of fluorescence from the label. For example, it is difficult to determine the relative extent of QD-labelling between cell 1 and 2 in Fig. 3. The FLIM image clearly shows that cell 1 has negligible QD labels, while cell 2 contains a reasonable QD-signal. Time gating selectively removes cell 1 from the image, while cell 2 is still clearly visible, to enable better quantification of labelling. One can anticipate that this ability to selectively remove unlabelled but highly autofluorescent cells from consideration could lead to significant advances in cell sorting and cytometry. Overall, from Fig. 3, it is clear that both CIS/ZnS and CdSe/ZnS QDs are far superior probes than the molecular probe AlexaFluor 488 for TGI due to the fact that AlexaFluor 488 decays only slightly slower than cell autofluorescence. A further advantage of CIS/ZnS QDs primarily comes from its lower toxicity without sacrificing the signal:background ratio as compared to CdSe/ZnS.
While time-gating selectively removes the faster-decaying autofluorescence, it still cannot avoid removing some of the QD fluorescence. A balance needs to be obtained between removing the maximum cell fluorescence before one begins to reduce the signal without any further reduction in the background. To quantify this balance, we varied the time gate, and monitored the effect on the signal:background, as presented in Fig. 4. Cross-sections of the fluorescence intensity in both x and y axes were constructed to compare the intensity of the labelled membrane-localized fluorescence (signal) to the intracellular autofluorescence (background). The cross-sections extracted in Fig. 4 highlight that the background autofluorescence of the cells reduces to a minimum when the time-gate is set to 5 ns. As the time gate increases to 20 ns, the signal is further reduced without further reducing the background. It is important to note that autofluorescence was suppressed by a factor of 22 as indicated by the intensity at the point highlighted in Fig. 4, while the signal was only reduced by a factor of 2.2, leading to an overall 10-fold improvement of the signal:background ratio.
Figure 4.

Fluorescence intensity images and cross-sections in x and y to compare the signal (s): background (b) levels of CIS/ZnS-labeled cells as a function of the time-gate applied.
Confocal fluorescence imaging is one of the most versatile and widely used visualization methods in biomedical research due to its high sensitivity, high spatial resolution and relatively low cost. However, suppressing the background cellular autofluorescence is a significant challenge. Most current probes that can accomplish this either contain toxic materials, such as Cd,14 or are based on lanthanides, which have lower extinction coefficients but longer lifetimes.15 Lanthanides-based nanomaterials16 offer an attractive alternative approach to reduce autofluorescence even more, but are larger (~30 nm vs ~5 nm for CIS QDs10) and require high intensity excitation at ~400nm. In this work, we developed bright, biocompatible, Cd-free (Zn)CIS/ZnS nanoparticles and improved the signal:noise ratio by an order of magnitude to separate cells with low Her2 expression from those with high autofluorescence. While the quantum yields of these nanoparticles are generally a little lower than other fluorophores (organic dyes or CdSe/ZnS QDs), their longer fluorescence lifetime more than makes up for this to result in images that are at least as good as CdSe/ZnS QDs and far superior to organic dyes.
Supplementary Material
Acknowledgments
This research was financially supported by NIH COBRE (P30 GM103450-03) and the Arkansas Biosciences Institute
Notes and references
- 1.Berezin MY, Achilefu S. Chem Rev. 2010;110:2641. doi: 10.1021/cr900343z. [DOI] [PMC free article] [PubMed] [Google Scholar]
- 2.(a) Weiss S. Science. 1999;283:1676. doi: 10.1126/science.283.5408.1676. [DOI] [PubMed] [Google Scholar]; (b) Alivisatos P. Nat Biotechnol. 2004;22(1):47. doi: 10.1038/nbt927. [DOI] [PubMed] [Google Scholar]; (c) Zrazhevskiy P, Senawb M, Gao Xiaohu. Chem Soc Rev. 2010;39:4326. doi: 10.1039/b915139g. [DOI] [PMC free article] [PubMed] [Google Scholar]; (d) Barroso MM. J Histochem Cytochem. 2011;59:237. doi: 10.1369/0022155411398487. [DOI] [PMC free article] [PubMed] [Google Scholar]; (e) Jaiswal JK, Mattoussi H, Mauro JM, Simon SM. Nat Biotechnol. 2003;21:47. doi: 10.1038/nbt767. [DOI] [PubMed] [Google Scholar]
- 3.(a) Panchuk–Voloshina N, Haugland RP, Bishop–Stewart J, Bhalgat MK, Millard PJ, Mao F, Leung W-Y, Haugland RP. J Histochem Cytochem. 1999;47(9):1179. doi: 10.1177/002215549904700910. [DOI] [PubMed] [Google Scholar]; (b) Battisti A, Digman MA, Gratton E, Storti B, Beltrama F, Bizzarriz R. Chem Commun. 2012;48:2012. doi: 10.1039/c2cc30373f. [DOI] [PMC free article] [PubMed] [Google Scholar]
- 4.(a) Bruchez M, Jr, Moronne M, Gin P, Weiss S, Alivisatos AP. Science. 1998;281:2013. doi: 10.1126/science.281.5385.2013. [DOI] [PubMed] [Google Scholar]; (b) Chan WCW, Nie S. Science. 1998;281:2016. doi: 10.1126/science.281.5385.2016. [DOI] [PubMed] [Google Scholar]; (c) Klarreich E. Nature. 2001;413:450. doi: 10.1038/35097256. [DOI] [PubMed] [Google Scholar]; (d) Mitchell P. Nat Biotechnol. 2001;19:1013. doi: 10.1038/nbt1101-1013. [DOI] [PubMed] [Google Scholar]; (e) Yong KT, Roy I, Swihart MT, Prasad PN. J Mater Chem. 2009;19:4655. doi: 10.1039/b817667c. [DOI] [PMC free article] [PubMed] [Google Scholar]; (f) Biju V, Itoh T, Ishikawa M. Chem Soc Rev. 2010;39:3031. doi: 10.1039/b926512k. [DOI] [PubMed] [Google Scholar]; (g) Mieszawska AJ, Gianella A, Cormode DP, Zhao Y, Meijerink A, Langer R, Farokhzad OC, Fayada ZA, Mulder WJM. Chem Commun. 2012;48:5835. doi: 10.1039/c2cc32149a. [DOI] [PMC free article] [PubMed] [Google Scholar]
- 5.(a) Chan WCW, Maxwell DJ, Gao X, Bailey RE, Han M, Nie S. Curr Op Biotechnol. 2002;13:40. doi: 10.1016/s0958-1669(02)00282-3. [DOI] [PubMed] [Google Scholar]; (b) Jaiswal1 JK, Mattoussi H, Mauro JM, Simon SM. Nature Biotechnol. 2002;21:47. doi: 10.1038/nbt767. [DOI] [PubMed] [Google Scholar]; (c) Kobayashi H, Hama Y, Koyama Y, Barrett T, Regino CAS, Urano Y, Choyke PL. Nano Lett. 7:1711. doi: 10.1021/nl0707003. [DOI] [PubMed] [Google Scholar]
- 6.(a) Wu XY, Liu HJ, Liu JQ, Haley KN, Treadway JA, Larson JP, Ge NF, Peale F, Bruchez MP. Nat Biotechnol. 2003;21(1):41. doi: 10.1038/nbt764. [DOI] [PubMed] [Google Scholar]; (b) Michalet X, Pinaud FF, Bentolila LA, Tsay JM, Doose S, Li JJ, Sundaresan G, Wu AM, Gambhir SS, Weiss S. Science. 2005;307:538. doi: 10.1126/science.1104274. [DOI] [PMC free article] [PubMed] [Google Scholar]; (c) Doane TL, Burda C. Chem Soc Rev. 2012;41:2885. doi: 10.1039/c2cs15260f. [DOI] [PubMed] [Google Scholar]
- 7.(a) Derfus AM, Chan WCW, Bhatia SN. Nano Lett. 2004;4:11. doi: 10.1021/nl0347334. [DOI] [PMC free article] [PubMed] [Google Scholar]; (b) Yu WW, Chang E, Drezek R, Colvin VL. Biochem Biophys Res Commun. 2006;348:781. doi: 10.1016/j.bbrc.2006.07.160. [DOI] [PubMed] [Google Scholar]; (c) Chang S-q, Dai Y-d, Kang B, Han W, Mao L, Chen D. Toxicol Lett. 2009;188:104. doi: 10.1016/j.toxlet.2009.03.013. [DOI] [PubMed] [Google Scholar]; (d) Guo G, Liu W, Liang J, He Z, Xu H, Yang X. Mater Lett. 2007;61:1641. [Google Scholar]; (e) Tsay JM, Michalet X. Chem Biol. 2005;12:1159. doi: 10.1016/j.chembiol.2005.11.002. [DOI] [PubMed] [Google Scholar]
- 8.Pons T, Pic E, Lequeux N, Cassette E, Bezdetnaya L, Guillemin F, Marchal F, Dubertret B. ACS Nano. 2010;4:2531. doi: 10.1021/nn901421v. [DOI] [PubMed] [Google Scholar]
- 9.(a) Li L, Jean Daou T, Texier I, Kim Chi TT, Liem NQ, Reiss P. Chem Mater. 2009;21:2422. [Google Scholar]; (b) Xie R, Rutherford M, Peng X. J Am Chem Soc. 2009;131:5691. doi: 10.1021/ja9005767. [DOI] [PubMed] [Google Scholar]; (c) Yong KT, Roy I, Hu R, Ding H, Cai H, Zhu J, Zhang X, Bergey EJ, Prasad PN. Integr Biol. 2010;2:121. doi: 10.1039/b916663g. [DOI] [PubMed] [Google Scholar]; (d) Zhang W, Zhong X. Inorg Chem. 2011;50:4065. doi: 10.1021/ic102559e. [DOI] [PubMed] [Google Scholar]
- 10.(a) Tan Z, Zhang Y, Xie C, Su H, Liu J, Zhang C, Dellas N, Mohney SE, Wang Y, Wang J, Xu J. Adv Mater. 2011;23:3553. doi: 10.1002/adma.201100719. [DOI] [PubMed] [Google Scholar]; (b) Sun Q, Wang YA, Li LS, Wang D, Zhu T, Xu J, Yang C, Li Y. Nature Photonics. 2007;1:717. [Google Scholar]
- 11.Chen K, Xie J, Xu H, Behera D, Michalski MH, Biswal S, Wang A, Chen X. Biomaterials. 2009;30:6912. doi: 10.1016/j.biomaterials.2009.08.045. [DOI] [PMC free article] [PubMed] [Google Scholar]
- 12.Li L, Pandey A, Werder DJ, Khanal BP, Pietryga JM, Klimov VI. J Am Chem Soc. 2011;133:1176. doi: 10.1021/ja108261h. [DOI] [PubMed] [Google Scholar]
- 13.Durisic N, Godin AG, Walters D, Grütter P, Wiseman PW, Heyes CD. ACS Nano. 2011;5:9062. doi: 10.1021/nn203272p. [DOI] [PMC free article] [PubMed] [Google Scholar]
- 14.Dahan M, Laurence T, Pinaud F, Chemla DS, Alivisatos AP, Sauer M, Weiss S. Opt Lett. 2001;26:825. doi: 10.1364/ol.26.000825. [DOI] [PubMed] [Google Scholar]
- 15.(a) Liu X, Ye Z, Wei W, Du Y, Yuan J, Ma D. Chem Commun. 2011;47:8139. doi: 10.1039/c1cc11759a. [DOI] [PubMed] [Google Scholar]; (b) Wu J, Wang G, Jin D, Yuan J, Guan Y, Piper J. Chem Commun. 2008:365. doi: 10.1039/b715054g. [DOI] [PubMed] [Google Scholar]
- 16.Wu J, Ye Z, Wang G, Jin D, Yuan J, Guan Y, Piper J. J Mater Chem. 2009;19:1258. [Google Scholar]
Associated Data
This section collects any data citations, data availability statements, or supplementary materials included in this article.