Abstract
The objectives of this study were to evaluate the capability of a novel ultrasound device to clinically estimate bone mineral density (BMD) at the 1/3rd radius. The device rests on a desktop and is portable, and permits real-time evaluation of the radial BMD. The device measures two (2) net time delay (NTD) parameters, NTDDW and NTDCW. NTDDW is defined as the difference between the transit time of an ultrasound pulse to travel through soft-tissue, cortex and medullary cavity, and the transit time through soft tissue only of equal overall distance. NTDCW is defined as the difference between the transit time of an ultrasound pulse to travel through soft-tissue and cortex only, and the transit time through soft tissue only again of equal overall distance. The square root of the product of these two parameters is a measure of the radial BMD at the 1/3rd location as measured by dual-energy x-ray absorptiometry (DXA). A clinical IRB-approved study measured ultrasonically sixty adults at the 1/3rd radius. BMD was also measured at the same anatomical site and time using DXA. A linear regression using NTD produced a linear correlation coefficient of 0.93 (P<0.001). These results are consistent with previously reported simulation and in vitro studies. In conclusion, although x-ray methods are effective in bone mass assessment, osteoporosis remains one of the largest undiagnosed and under-diagnosed diseases in the world today. The research described here should enable significant expansion of diagnosis and monitoring of osteoporosis through a desktop device that ultrasonically assesses bone mass at the 1/3rd radius.
Keywords: osteoporosis, bone mineral density, ultrasound, net time delay, DXA, radius
Introduction
The objective of this study is to enhance the ability of ultrasound to non-invasively assess bone. As is well known, osteoporotic fractures are a major public health problem associated with high degrees of morbidity and mortality [Kanis, 2002; Kanis et al., 2009a]. As stated on the National Osteoporosis Foundation (NOF) website <nof.org>, osteoporosis and low bone mass are currently estimated to be a major public health threat for almost 44 million U.S. women and men aged 50 and older. The 44 million people with either osteoporosis or low bone mass represent 55 percent of the people aged 50 and older in the United States. According to estimated figures, osteoporosis was responsible for more than 2 million fractures in 2005, including approximately 297,000 hip fractures, 547,000 vertebral fractures, 397,000 wrist fractures, 135,000 pelvic fractures and 675,000 fractures at other sites. The number of fractures due to osteoporosis is expected to rise to more than 3 million by 2025. If current trends continue, the number of people affected with osteoporosis or osteopenia will climb to over 61 million by 2020. In 2005, osteoporosis-related fractures were responsible for an estimated $19 billion in costs, and by 2025, it is predicted that these costs will rise to approximately $25.3 billion. The toll both in individual quality of life and in national health care costs of osteoporotic fractures cannot be overstated. Early detection and assessment is crucial to initiating therapeutic interventions as this is the best way to prevent a fracture from occurring [Kanis et al., 2009b].
Presently the gold standard for bone assessment is based on x-ray densitometric techniques, such as with DEXA [Ott et al., 1987; Blake and Fogelman, 2003; Bonnick, 2004; Johnell et al., 2005]. The measurement of bone mass as represented for example by (areal) bone mineral density (BMD) is based on the well established principle that more mass is generally associated with a stronger bone, and a stronger bone is in turn associated with a reduced risk of fracture [Turner, 2006]. Indeed, BMD is the single most important factor in estimating bone strength and fracture risk [Baim and Leslie, 2012]. Notwithstanding these facts, osteoporosis remains one of the world’s most under-diagnosed diseases. Indeed, the NOF estimates that only about 20 percent of the at-risk population has been assessed; indeed the problem of under-diagnosing osteoporosis appears to be getting worse [Lewiecki et al., 2012; Zhang et al., 2012]. The reasons for this are several. First and foremost is perhaps that the vast majority of primary care physicians do not have bone assessment capability available; therefore patients must be referred off-site to specialists for these measurements making them performed less often than necessary. In addition, the relatively high cost of such bone density tests—not always covered by health insurance—and the high costs of the devices themselves—also leads to them being utilized less frequently as needed [King and Fiorentino, 2011]. There is also the issue of ionizing radiation which at least in the minds of some patients, is another reason to avoid the test [Leffall and Kripke, 2009].
Ultrasound has been proposed as an alternative to DEXA [Langton et al., 1984; Laugier, 2008; Krieg et al., 2008]. It is non-ionizing, relatively (to DEXA) inexpensive, and as a mechanical wave may provide information above and beyond mass alone [Kaufman and Einhorn, 1993; Siffert et al., 1996; Njeh et al., 2001; Siffert and Kaufman, 2007; Padilla et al., 2008; Hosokawa, 2010; Souzanchi et al., 2012]. A number of research and/or commercial ultrasonic devices are currently available and operate in one of three basic modalities [Laugier and Haiat, 2011]; these include through transmission methods [Langton et al., 1984; Kaufman & Einhorn, 1993; Wear, 2000], pulse-echo (backscattering methods) [Wear, 2008; Karjalainen et al., 2009; Litniewski et al., 2012], and axial transmission methods [Barkmann et al., 2000; Lefebvre et al., 2002; Talmant et al., 2009; Moilanen, 2008; Kilappa et al., 2011]. Notwithstanding the number of devices and modalities already explored, the impact that ultrasound has had to date on improving bone health and identifying those individuals at increased risk of fracture has been relatively modest. This is due primarily to the fact that performance of present ultrasound technology—and specifically performance in terms of serving as a proxy for BMD—is less than needed to displace the current gold standard, DEXA. ideal. For example, presently approved thru-transmission ultrasound devices designed to measure the calcaneus provide correlations with BMD at the same anatomical site ranging from 0.6 to about 0.8 [Langton and Langton, 2000]. Axial and back-scattering ultrasound methods produce even poorer correlations with BMD [Laugier and Haiat, 2011].
The purpose of this paper is to report on the ability of a new desktop ultrasound device to clinically estimate BMD at the 1/3rd radius. The rest of this paper is organized as follows. The next section describes the ultrasound measurement methodology, including the signal processing algorithm and the clinical study protocol. The results are then provided, followed by a discussion and conclusion that summarizes the findings of this study.
Materials and Methods
Device and Signal Processing
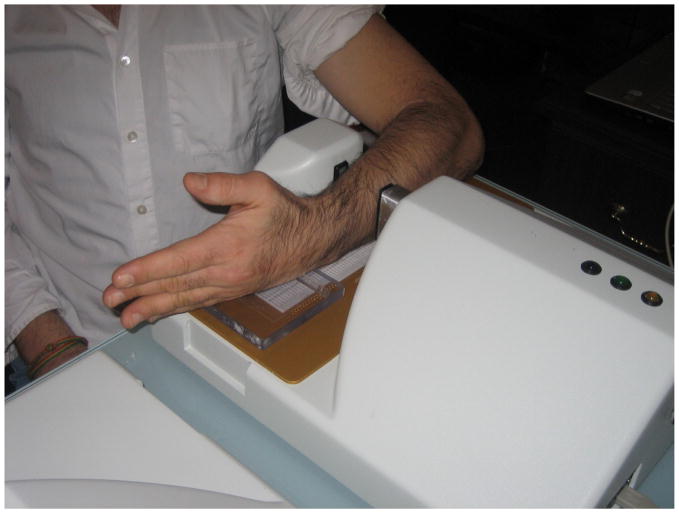
A new desktop device (UltraScan 650, CyberLogic, Inc., New York, NY, USA, Fig. 1) for quantitative real-time bone assessment has been constructed [Kaufman et al., 2009a]. It processes ultrasound signals after propagating through a forearm and displays an estimate of BMD on a laptop computer that is connected via USB. The device is constructed around a 1 cm × 4.8 cm rectangular single element source transducer and a 1 cm × 4.8 cm 64 element array receiver transducer with a pitch of 0.75 mm, and both transducers are flat (unfocussed). The device emits a 3.5 MHz broadband ultrasound signal from the source that propagates through the radius and soft tissue to the array receiver. In water, the received waveform has a nominal center frequency of 3 MHz with a 3 dB bandwidth of 800 kHz.
Fig. 1.
The UltraScan 650 ultrasound bone assessment device.
In operation, the source emits a broadband ultrasonic pulse at a rate of 1 kHz, the receiver waveforms are sampled at a 50 MHz sampling rate, and for each channel sixty-four of the received sampled-waveforms are summed to obtain an averaged set of sixty-four received waveforms. A variable gain under software control (from 0 to 40 dB in 5 dB increments) is set independently for each channel in order to bring the maximum absolute value of each channel as close as possible to the maximum value allowed (without saturation) as input to the analog-to-digital converter (±5 volt). Note that channels associated with propagation of ultrasound through bone required 30–40 dB of gain as compared with propagation of ultrasound solely through soft tissue which required 0 dB of gain. The averaged waveforms are then processed to obtain two ultrasound net time delay (NTD) parameters, NTDDW and NTDCW, Fig. 2. [Kaufman et al., 2009b; LeFloch et al., 2008a; Kaufman et al., 2008; Siffert & Kaufman, 2007; Kaufman et al., 2007]. NTDDW, the DW notating “direct wave”, is defined as the difference between the transit time of an ultrasound pulse through soft-tissue, cortex and medullary cavity, and the transit time through soft tissue only of equal overall distance. NTDCW, the CW denoting “circumferential wave”, is defined as the difference between the transit time of an ultrasound pulse through soft-tissue and cortex only, and the transit time through soft tissue only again of equal overall distance. Measurement of the two NTDs and associated BMD estimate on an individual takes about ten (10) seconds, with no operator post-processing as in DXA required (or allowed).
Fig. 2.
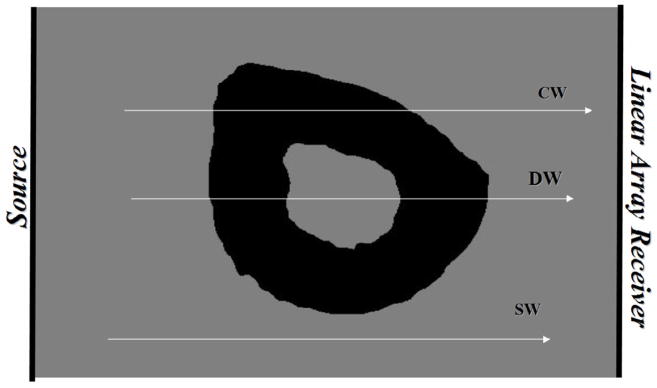
Schematic of radius bone showing three propagation pathways (see text).
As shown in Fig. 2, the ultrasound signal propagates in three distinct pathways. One pathway consists of soft tissue only (a soft-tissue wave or “SW”); clinically, this corresponds to the space between the ulna and the radius at the 1/3rd location. The time delay associated with this pathway is denoted by τSW. Another pathway consists of propagation through soft tissue on both sides of the radius, propagation through two cortices on opposite sides of the radius, and propagation through the marrow-filled medullary cavity as well (a direct wave or (DW”). The time delay associated with this pathway is denoted by τDW. The final pathway consists of propagation through soft tissue on both sides of the radius, and propagation through the radial cortex only (a circumferential wave or “CW”). The time delay associated with this pathway is denoted by τCW. Thus, NTDDW = τSW − τDW and NTDCW = τSW − τCW. Note that the physical separation of the radius and ulna at the 1/3rd location in adults is nominally about 1 cm; therefore the number of receiver elements associated with the soft-tissue only region (away from the bone edges) is about 10, and a SW time delay (i.e., τSW) can be estimated for each of these channels.. A somewhat smaller number of channels (typically 5–10) is associated with propagation primarily though the radius, and from each of these channels a pair of DW and CW time delays (i.e., τDW and τCW) can be estimated. The final estimates of the three time delays are obtained by averaging the set of delays associated with each channel. Note that the SW channels are identified by the large maximum absolute amplitudes associated with the signals that have propagated through soft-tissue only, while the “radius” channels are those whose amplitudes are smallest, adjacent to the soft-tissue only channels, and near the upper portion of the array (regardless of which arm is being measured; see Fig. 1).
Estimation of the time delays associated with the three pathways is described in [Luo & Kaufman, 2012; Luo and Kaufman, 2011]. Briefly, a set of signals associated with the soft tissue only path is first identified using the maximum absolute amplitude as a guide. (The peak absolute amplitudes of the SW signals are typically 30 – 40 dB larger than those associated with the CW and DW signals.) The mean time delay of this set of signals (“τSW”) is obtained by averaging the time delays, τSWi, of each of the soft tissue signals in the identified set by a method of moments, computed over the first half-cycle of each signal:
| (1a) |
and
| (1b) |
In (1a) and (1b), si(t) is a soft tissue signal measured with an individual element (channel) of the array receiver transducer, t0i and t1i are the initial and final time points (linearly interpolated if necessary) of the first half-cycle of the signal si(t), and NSW is the number of receiver channels that are associated with propagation through the soft tissue pathway. As noted above, a typical soft-tissue time delay estimate includes about ten channels (dependent on forearm and bone sizes), and the use of the moment computation serves to reduce the influence of noise due to the integrations in (1a). The determinations of τSW and τDW are done entirely analogously to (1a) and (1b), but utilizing a set of (about 5–10) channels associated with propagation through the radius.
It is hypothesized that each of the two NTD parameters is proportional to the amount of bone (i.e., effectively proportional to BMD as would be measured by DXA) in their respective and distinctive pathways. This has been shown for NTDDW using computational, in vitro and clinical studies [Luo et al., 1999; LeFloch et al., 2008a, LeFloch et al., 2008b; Kaufman et al., 2007; Siffert & Kaufman, 2007]. Using geometrical arguments, NTDCW in combination with NTDDW has also been shown in vitro to provide an ultrasonic-based estimate, BMDUS, of radial DXA BMD at the 1/3rd location, according to the following formula [LeFloch et al., 2008a]:
| (2) |
In (2), a and b are regression parameters to be determined by the method of least squares.
For comparison purposes, an average ultrasound velocity (UV) associated with each subject was also evaluated. UV was defined as d1/3/tDW where d1/3 is the thickness of the forearm at the 1/3 rd location, i.e., the separation of the skin-contacting transducer pair.
Clinical Measurements
Sixty adult subjects were recruited for this study under an IRB approved protocol and informed consent was received from each participant. Pregnancy was excluded in premenopausal women before DXA scans were performed. Each subject was measured three to five times at the 1/3rd radius with the UltraScan 650. Standard off-the-shelf isopropyl alcohol (70%) was used as an ultrasound coupling agent; it was sprayed onto the subject’s forearm and the transducers’ active surfaces. The alcohol also served as an antiseptic and evaporated relatively quickly so that clean-up was minimal (as opposed to using standard coupling gel). The ultrasound device requires a minimum of three independent ultrasound measurements to be made on each person; if the range of both NTD parameters is sufficiently small (viz., the range of both NTD parameters is within ±0.05μs, which on average represents a precision of about 3%), the test ends. Otherwise, up to two more independent NTD measurements were made and the three closest together data sets were averaged and saved to a log file. For each subject radial bone density at the same 1/3rd location was determined using DXA (QDR 4500, Hologic, Inc., Bedford, MA, USA). Finally, an ultrasound reproducibility study was carried out on three additional subjects each with 15 independent measurements, and the percent coefficient of variation (%CV) was evaluated [Bonnick, 2004].
Results
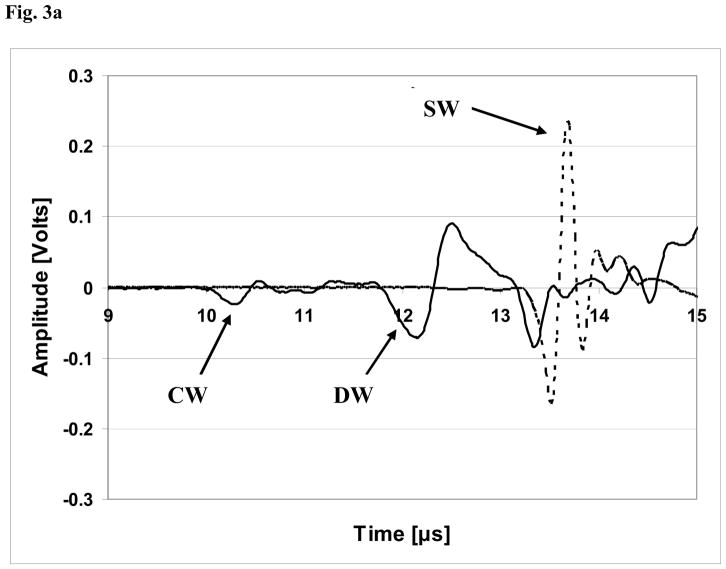
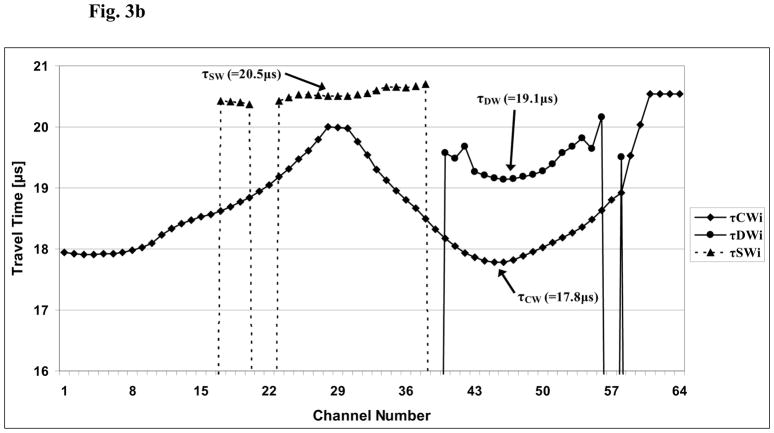
Table 1 lists the demographic and ethnic/racial data on the 60 subjects in this study. A set of received ultrasound waveforms associated with a typical subject is shown in Fig. 3a. Two signals are displayed; one (solid line) is for a channel located largely behind the radius and the other (dotted line) is for a channel located behind a soft tissue only region. For purposes of the plot, the data from the soft tissue channel (“SW”) has been divided by twenty so that the signals associated with propagation through the radius (i.e., the CW and DW) may be clearly observed. Fig. 3b displays the variation of the transit times associated with the three propagation pathways as a function of channel (receiver element) number for a typical study subject. As may be seen, each channel is associated generally with a distinct value of the associated time delay; as noted above (Eq. 1b), the actual estimate for a given time delay is computed as an arithmetic average of a small number of such individual channel delays that are centered around the regions directly behind the radius (indicated in Fig. 3b by the arrows for τCW and τDW) and centered directly behind the region containing only soft tissue (indicated in Fig. 3b by the arrow for τSW).
Table 1.
Demographic statistics for the clinical study group (SD = standard deviation, Min = minimum, and Max = maximum).
| N = 60 (Number of subjects) | Mean (SD) | Min-Max |
|---|---|---|
|
| ||
| Age [Years] | 47 (20) | 22–84 |
|
| ||
| Race | ||
| 62% White | ||
| 7% African American | ||
| 16% Hispanic | ||
| 15% Asian | ||
|
| ||
| Sex (68% female) | ||
|
| ||
| Height [cm] | 167 (11) | 150–198 |
|
| ||
| Weight [kg] | 73 (16) | 50–143 |
|
| ||
| 1/3rd radius BMD [g/cm2] | 0.69 (0.12) | 0.45–0.92 |
Fig. 3.
Fig. 3a. Plot of received waveforms for a typical subject. Two channels are shown; the solid line indicates a channel located largely behind the radius, while the dotted line indicates a channel within the soft tissue only region. For purposes of the plot, the data from the soft tissue channel (“SW”) has been divided by twenty so that the signals associated with propagation through the radius (i.e., the CW and DW) may be clearly observed. Thus, the actual voltage of the soft tissue only signal is approximately 4.6 volts.
Fig. 3b. Plot of the estimates of the three transit times τDWi, τCWi, τSWi associated with the direct, circumferential, and soft-tissue waves, respectively, as a function of channel (array element) number i, i=1,…,64. The actual estimates of the three transit times, τDW, τCW, τSW, are based on an average of 3–5 transit times near the minimum delays associated with each of the three modes, indicated by the arrows, respectively. See also Eq. 1b in the text.
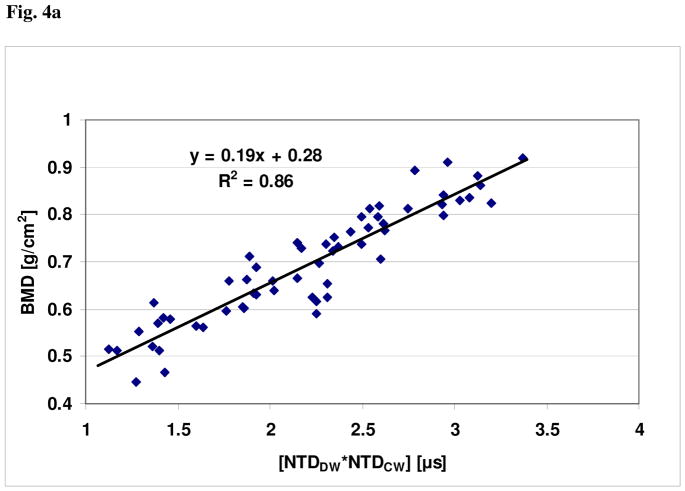
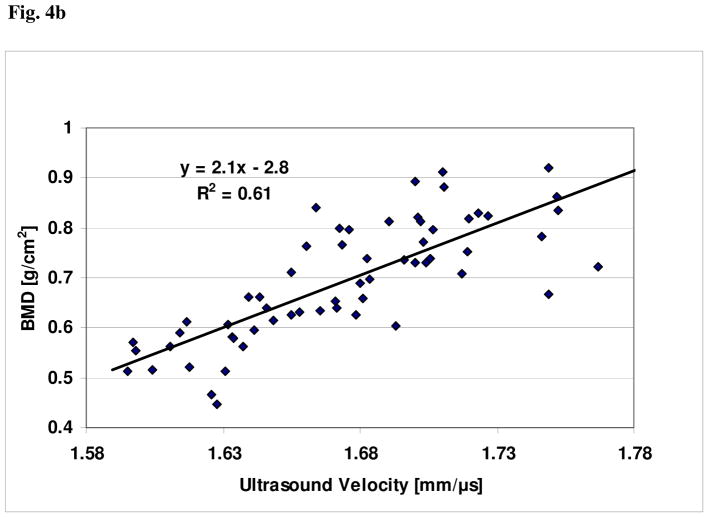
For these clinical data, plots showing the relationships of BMDUS and UV to BMD, together with the respective linear regression curve fits, are shown in Figs. 4a and 4b, respectively. The linear correlation between BMDUS and BMD was r = 0.93 (P<0.001); the linear correlation between UV and BMD was r = 0.78 (P<0.01). The linear univariate regression between BMD and BMDUS produced a standard error of the prediction of 0.043 g/cm2. The linear univariate regression between BMD and UV produced a standard error of the prediction of 0.077 g/cm2. Finally, the percent coefficient of variation in the reproducibility study was found to be 2.1%.
Fig. 4.
Fig. 4a. Plot of BMD vs. [NTDCW * NTDDW]1/2 for the clinical study.
Fig. 4b. Plot of BMD vs. ultrasound velocity (UV) for the clinical study.
Discussion and Conclusion
The data presented demonstrate that the new device and its associated nonlinear function of two ultrasound NTD parameters, NTDDW and NTDCW, is a very good proxy of BMD as measured by DXA at the 1/3rd radius. In contrast, the data show that ultrasound velocity is much less correlated with BMD; this is a result of the variations between people in amount of overlying soft tissue thickness and size of the marrow-containing medullary cavity.
The results reported here are consistent with previously reported computational and in vitro studies. In particular, in a 2D computer simulation study on 20 human radii, NTDDW was shown to have a high correlation (r = 0.99, P<0.001) with cortical thickness [Kaufman et al., 2008]. The data from this simulation study were re-analyzed; the cross-sectional (bone-only) area of each radius was divided by the projected bone width to obtain the simulated BMD, BMDSIM, in this case in units of millimeters of bone. (Note that the actual values of BMDSIM would normally need to be scaled by a factor related to the mineral density of bone, but this is not done here as it is not relevant to this analysis; such a scale factor would only affect the associated regression coefficients.) The relationship between BMDSIM and the two NTDs is assumed to have the same form as in (1). In this case NTDCW and NTDDW are replaced by NTDCW-SIM and NTDDW-SIM, respectively, the latter pair being the simulated values of the two NTD parameters from Kaufman et al. [2008]. Fig. 5 displays the relationship for the simulated data. As may be seen, there is a high degree of correlation (r = 0.96, P<0.001) between BMDSIM and the square root of the product of the two NTDs, similar to the clinical case. It should be noted that the simulation study demonstrated that the CW mode through the radii was similar to a circumferential guided wave through a cylinder that has been characterized analytically by Rose [1999]. It should be noted that the nominal wavelength of the ultrasound propagating in the cortex is on the order of 1 mm (nominal center frequency of 3 MHz, nominal longitudinal velocity of 3000 m/s) which is in the range of cortical thicknesses typically observed (~0.5 – 2 mm). Thus, further studies which examine the dispersion curves of circumferential modes in irregular tubes should provide further insight into this key mode of propagation that is observed in transmission through the radius. An important consideration will be to develop dispersion curves for the case of tubes which are loaded both inside and outside by soft tissue (i.e., outside the radius by muscle and fat, and inside the radius by marrow/blood), in order to appropriately model the clinical reality.
Fig. 5.
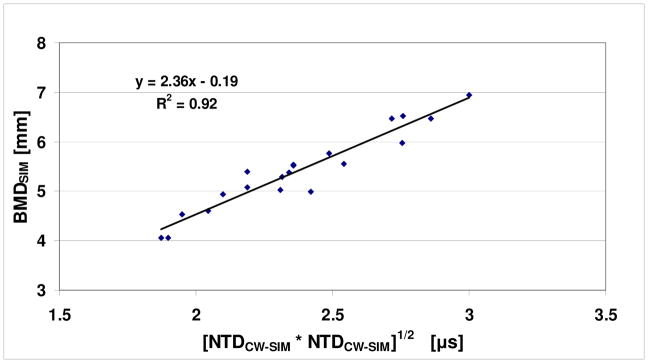
Plot of BMDSIM vs. [NTDCW-SIM * NTDDW-SIM]1/2 for a previous computational study.
The clinical results are also consistent with an in vitro study on the same set (less one) of 20 human radii [LeFloch et al., 2008a]. The radii were scanned in a water tank with a laboratory prototype similar to the clinical UltraScan 650. The two NTD parameters were evaluated and shown to have a correlation (r = 0.95, P<0.001) with the cross-sectional (bone) area [LeFloch et al., 2008a]. To compare the in vitro results with the clinical data of this study, this data was also re-analyzed. The cross-sectional area was converted to an equivalent BMD (by dividing by the associated projected bone width), to obtain BMDInVitro. (Note that BMDInVitro is equal to BMDSIM of the previous paragraph.) The relationship between BMDInVitro and the two NTDs is again assumed to have the same form as in (1). In this case, NTDCW and NTDDW are replaced by NTDCW-InVitro and NTDDW-InVitro, respectively, the latter pair being the in vitro values of the two NTD parameters from LeFloch et al. [2008a]. Fig. 6 displays the relationship for the in vitro data. As may be seen, there is a high degree of correlation (r = 0.92, P<0.001) between BMDInVitro and the square root of the product of the two NTDs, again similar to the clinical case. The remarkably high degree of similarity in the computational, in vitro and clinical data lends strong support to the applicability of the NTD-based methods used for assessing BMD. Further research on extending ultrasound to assessing the ultra-distal radius is also underway [Le Floch et al., 2008b].
Fig. 6.
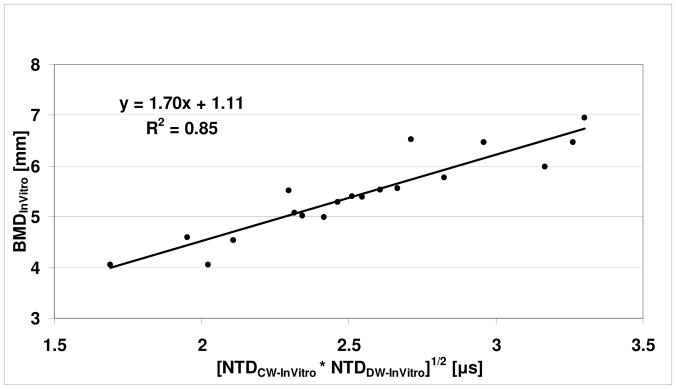
Plot of BMDInVitro vs. [NTDCW-InVitro * NTDDW-InVitro]1/2 for a previous in vitro study.
In summary a new device, the UltraScan 650, has been described that has the potential to enlarge the scope of ultrasound bone assessment in particular and of bone screening in general. The portability and simplicity in use of the radiation-free ultrasound scanner, combined with its high degree of accuracy and precision in estimating radial BMD, provides a basis by which to expand ultrasonic assessment to the primary care setting. This will in turn provide an opportunity to reduce the incidence of osteoporotic fractures through early and timely therapeutic interventions.
Acknowledgments
The kind support of the National Institute of Arthritis and Musculoskeletal and Skin Diseases (Grant Number AR45150) and the National Institute on Aging (Grant Number AG036879) of the National Institutes of Health, through the Small Business Innovative Research Program are gratefully acknowledged. The funders had no role in the design and conduct of the study; collection, management, analysis, and interpretation of the data; and preparation, review, or approval of the manuscript.
Footnotes
Conflict of Interest: One of the authors (Jonathan J. Kaufman) is a principal and CEO of the company (CyberLogic, Inc.) which manufactures the UltraScan 650 device, and another of the authors (Gangming Luo) is an employee of the same company. None of the other authors report any conflicts of interest.
Publisher's Disclaimer: This is a PDF file of an unedited manuscript that has been accepted for publication. As a service to our customers we are providing this early version of the manuscript. The manuscript will undergo copyediting, typesetting, and review of the resulting proof before it is published in its final citable form. Please note that during the production process errors may be discovered which could affect the content, and all legal disclaimers that apply to the journal pertain.
References
- Anonymous. Osteoporosis prevention, diagnosis, and therapy. JAMA. 2001;285:785–95. doi: 10.1001/jama.285.6.785. [DOI] [PubMed] [Google Scholar]
- Baim S, Leslie WD. Assessment of fracture risk. Curr Osteoporos Rep. 2012;10(1):28–41. doi: 10.1007/s11914-011-0093-9. [DOI] [PubMed] [Google Scholar]
- Barkmann R, Kantorovich E, Singal C, Hans D, Genant HK, Heller M, Glüer CC. A new method for quantitative ultrasound measurements at multiple skeletal sites: first results of precision and fracture discrimination. J Clin Densitom. 2000;3(1):1–7. doi: 10.1385/jcd:3:1:001. [DOI] [PubMed] [Google Scholar]
- Blake GM, Fogelman I. Review - DXA scanning and its interpretation in osteoporosis. Hosp Med. 2003;64:521–5. doi: 10.12968/hosp.2003.64.9.2243. [DOI] [PubMed] [Google Scholar]
- Bonnick SL. Application and Interpretation. 2. Totowa, New Jersey: Humana Press; 2004. Bone Densitometry in Clinical Practice. [Google Scholar]
- Hosokawa A. Effect of porosity distribution in the propagation direction on ultrasound waves through cancellous bone. IEEE Trans Ultrason Ferroelectr Freq Control. 2010;57(6):1320–8. doi: 10.1109/TUFFC.2010.1552. [DOI] [PubMed] [Google Scholar]
- Johnell O, Kanis JA, Oden A, Johansson H, De Laet C, Delmas P, Eisman JA, Fujiwara S, Kroger H, Mellstrom D, Meunier PJ, Melton LJ, 3rd, O’Neill T, Pols H, Reeve J, Silman A, Tenenhouse A. Predictive value of BMD for hip and other fractures. J Bone Miner Res. 2005;20:1185–1194. doi: 10.1359/JBMR.050304. [DOI] [PubMed] [Google Scholar]
- Kanis J. Diagnosis of osteoporosis and assessment of fracture risk. The Lancet. 2002;359:1929–1936. doi: 10.1016/S0140-6736(02)08761-5. [DOI] [PubMed] [Google Scholar]
- Kanis JA, Johansson H, Oden A, McCloskey EV. Assessment of fracture risk. Eur J Radiol. 2009a;71(3):392–7. doi: 10.1016/j.ejrad.2008.04.061. [DOI] [PubMed] [Google Scholar]
- Kanis JA, McCloskey EV, Johansson H, Oden A. Approaches to the targeting of treatment for osteoporosis. Nat Rev Rheumatol. 2009b;5(8):425–31. doi: 10.1038/nrrheum.2009.139. [DOI] [PubMed] [Google Scholar]
- Karjalainen JP, Töyräs J, Riekkinen O, Hakulinen M, Jurvelin JS. Ultrasound backscatter imaging provides frequency-dependent information on structure, composition and mechanical properties of human trabecular bone. Ultrasound Med Biol. 2009;35(8):1376–84. doi: 10.1016/j.ultrasmedbio.2009.03.011. [DOI] [PubMed] [Google Scholar]
- Kaufman JJ, Einhorn TE. Review - Ultrasound Assessment of Bone. J Bone Miner Res. 1993;8:517–525. doi: 10.1002/jbmr.5650080502. [DOI] [PubMed] [Google Scholar]
- Kaufman JJ, Siffert RS. Non-invasive assessment of bone integrity. In: Cowin S, editor. Bone mechanics handbook. Boca Raton, FL: CRC Press; 2001. pp. 34.1–34.25. [Google Scholar]
- Kaufman JJ, Luo GM, Siffert RS. A Portable Real-Time Bone Densitometer. Ultrasound in Medicine and Biology. 2007;33(9):1445–52. doi: 10.1016/j.ultrasmedbio.2007.04.007. [DOI] [PMC free article] [PubMed] [Google Scholar]
- Kaufman JJ, Luo GM, Siffert RS. Ultrasound Simulation in Bone (Invited Paper) IEEE Transactions Ultrasonics, Ferroelectrics and Frequency Control, 2008. 2008;56(6):1205–1218. doi: 10.1109/TUFFC.2008.784. [DOI] [PubMed] [Google Scholar]
- Kaufman JJ, Luo GM, Siffert RS. Effect of Arm Dominance on Quantitative Transmission Ultrasound at the Forearm. Journal of Bone and Mineral Research; Supplement: Thirty-first Annual Meeting of the American Society for Bone and Mineral Research; 2009a. p. S319. [Google Scholar]
- Kaufman JJ, Luo GM, Blazy B, Siffert RS. Quantitative Ultrasound Assessment of Tubes and Rods: Comparison of Empirical and Computational Results. Acoustical Imaging; Proceedings of the 29th International Symposium on Acoustical Imaging; New York: Springer; 2009b. pp. 467–472. [Google Scholar]
- Kilappa V, Moilanen P, Xu L, Nicholson PH, Timonen J, Cheng S. Low-frequency axial ultrasound velocity correlates with bone mineral density and cortical thickness in the radius and tibia in pre- and postmenopausal women. Osteoporos Int. 2011;22(4):1103–13. doi: 10.1007/s00198-010-1273-7. [DOI] [PubMed] [Google Scholar]
- King AB, Fiorentino DM. Medicare payment cuts for osteoporosis testing reduced use despite tests’ benefit in reducing fractures. Health Aff (Millwood) 2011;30(12):2362–70. doi: 10.1377/hlthaff.2011.0233. [DOI] [PubMed] [Google Scholar]
- Krieg MA, Barkmann R, Gonnelli S, Stewart A, Bauer DC, Del Rio Barquero L, Kaufman JJ, Lorenc R, Miller PD, Olszynski WP, Poiana C, Schott AM, Lewiecki EM, Hans D. Quantitative Ultrasound in the Management of Osteoporosis: The 2007 ISCD Official Positions. Journal of Clinical Densitometry. 2008;11(1):163–187. doi: 10.1016/j.jocd.2007.12.011. [DOI] [PubMed] [Google Scholar]
- Langton CM, Palmer SB, Porter RW. The measurement of broadband ultrasonic attenuation in cancellous bone. Eng Med. 1984;13(2):89–91. doi: 10.1243/emed_jour_1984_013_022_02. [DOI] [PubMed] [Google Scholar]
- Langton CM, Njeh CF. The Measurement of Broadband Ultrasonic Attenuation in Cancellous Bone—A Review of the Science and Technology. IEEE Transactions Ultrasonics, Ferroelectrics, and Frequency Control. 2008;55(7):1546–1554. doi: 10.1109/TUFFC.2008.831. [DOI] [PubMed] [Google Scholar]
- Langton CM, Langton DK. Comparison of bone mineral density and quantitative ultrasound of the calcaneus: site matched correlation and discrimination of axial BMD status. British Journal of Radiology. 2000;73:31–35. doi: 10.1259/bjr.73.865.10721317. [DOI] [PubMed] [Google Scholar]
- Laugier P. Instrumentation for in vivo ultrasonic characterization of bone strength. IEEE Trans Ultrason Ferroelectr Freq Control. 2008;55(6):1179–96. doi: 10.1109/TUFFC.2008.782. [DOI] [PubMed] [Google Scholar]
- Laugier P, Haiat G, editors. Bone Quantitative Ultrasound. Springer; Dordrecht, Netherlands: 2010. [Google Scholar]
- Lefebvre F, Deblock Y, Campistron P, Ahite D, Fabre JJ. Development of a new ultrasonic technique for bone and biomaterials in vitro characterization. J Biomed Mater Res. 2002;63:441–446. doi: 10.1002/jbm.10261. [DOI] [PubMed] [Google Scholar]
- Leffall LD, Kripke ML. President’s Cancer Panel. National Cancer Institute, National Institutes of Health, U.S. Department of Health And Human Services; Bethesda, Maryland: 2010. Reducing Environmental Cancer Risk: What We Can Do Now? [Google Scholar]
- Le Floch V, Luo GM, Kaufman JJ, Siffert RS. Ultrasonic Assessment of the Radius in Vitro. Ultrasound in Medicine and Biology. 2008a;34(12):1972–1979. doi: 10.1016/j.ultrasmedbio.2008.05.010. [DOI] [PMC free article] [PubMed] [Google Scholar]
- Le Floch V, McMahon DJ, Luo GM, Cohen A, Kaufman JJ, Shane E, Siffert RS. Ultrasound Simulation in the Distal Radius Using Clinical High-Resolution Peripheral-CT Images. Ultrasound in Medicine and Biology. 2008b;34(8):1317–1326. doi: 10.1016/j.ultrasmedbio.2008.01.006. [DOI] [PMC free article] [PubMed] [Google Scholar]
- Lewiecki EM, Laster AJ, Miller PD, Bilezikian JP. More bone density testing is needed, not less. J Bone Miner Res. 2012;27(4):739–42. doi: 10.1002/jbmr.1580. [DOI] [PubMed] [Google Scholar]
- Litniewski J, Cieslik L, Lewandowski M, Tymkiewicz R, Zienkiewicz B, Nowicki A. Ultrasonic scanner for in vivo measurement of cancellous bone properties from backscattered data. IEEE Trans Ultrasonics Ferroelec Freq Control. 2012;59(7):1470–1477. doi: 10.1109/TUFFC.2012.2347. [DOI] [PubMed] [Google Scholar]
- Luo GM, Kaufman JJ, Chiabrera A, Bianco B, Kinney JH, Haupt D, Ryaby JT, Siffert RS. Computational methods for ultrasonic bone assessment. Ultrasound Med Biol. 1999;25:823–830. doi: 10.1016/s0301-5629(99)00026-5. [DOI] [PubMed] [Google Scholar]
- Moilanen P. Ultrasonic guided waves in bone. IEEE Trans Ultrason Ferroelectr Freq Control. 2008;55(6):1277–86. doi: 10.1109/TUFFC.2008.790. [DOI] [PubMed] [Google Scholar]
- Melton LJ., III . Epidemiology of fractures. In: Riggs BL, Melton LJ III, editors. Osteoporosis: etiology, diagnosis, and management. New York, NY: Raven Press; 1988. pp. 133–154. [Google Scholar]
- Miller CW. Survival and ambulation following hip fracture. J Bone Joint Surg. 1978;60A:930–934. [PubMed] [Google Scholar]
- Njeh CF, Fuerst T, Diessel E, Genant HK. Is quantitative ultrasound dependent on bone structure? A reflection. Osteoporos Int. 2001;12(1):1–15. doi: 10.1007/PL00020939. [DOI] [PubMed] [Google Scholar]
- Ott SM, Kilcoyne RF, Chestnut CH., III Ability of four different techniques of measuring bone mass to diagnose vertebral fractures in postmenopausal women. J Bone Min Res. 1987;2:201–210. doi: 10.1002/jbmr.5650020306. [DOI] [PubMed] [Google Scholar]
- Padilla F, Jenson F, Bousson V, Peyrin F, Laugier P. Relationships of trabecular bone structure with quantitative ultrasound parameters: in vitro study on human proximal femur using transmission and backscatter measurements. Bone. 2008;42(6):1193–202. doi: 10.1016/j.bone.2007.10.024. [DOI] [PubMed] [Google Scholar]
- Rose JL. Ultrasonic Waves in Solid Media. Cambridge University Press; Cambridge, UK: 1999. pp. 154–157. see particularly pages. [Google Scholar]
- Siffert RS, Luo GM, Cowin SC, Kaufman JJ. Dynamical relationships of trabecular bone density, architecture and strength in a computational model of osteopenia. Bone. 1996;18:197–206. doi: 10.1016/8756-3282(95)00446-7. [DOI] [PubMed] [Google Scholar]
- Siffert RS, Kaufman JJ. Ultrasonic Bone Assessment: “The Time Has Come. Bone. 2007;40:5–8. doi: 10.1016/j.bone.2006.07.018. [DOI] [PMC free article] [PubMed] [Google Scholar]
- Souzanchi MF, Palacio-Mancheno PE, Borisov Y, Cardoso L, Cowin SC. Microarchitecture and bone quality in the human calcaneus; Local variations of fabric anisotropy. J Bone Miner Res. 2012 Jul 13;2012 doi: 10.1002/jbmr.1710. [Epub ahead of print] [DOI] [PMC free article] [PubMed] [Google Scholar]
- Talmant M, Kolta S, Roux Ch, Haguenauer D, Vedel I, Cassou B, Bossy E, Laugier P. In vivo performance evaluation of bi-directional ultrasonic axial transmission for cortical bone assessment. Ultrasound Med Biol. 2009;35(6):912–9. doi: 10.1016/j.ultrasmedbio.2008.12.008. [DOI] [PubMed] [Google Scholar]
- Turner CH. Bone strength: current concepts. Ann N Y Acad Sci. 2006;1068:429–46. doi: 10.1196/annals.1346.039. [DOI] [PubMed] [Google Scholar]
- Wear KA. Ultrasonic scattering from cancellous bone: a review. IEEE Trans Ultrason Ferroelectr Freq Control. 2008;55(7):1432–41. doi: 10.1109/TUFFC.2008.818. [DOI] [PMC free article] [PubMed] [Google Scholar]
- Zhang J, Delzell E, Zhao H, Laster AJ, Saag KG, Kilgore ML, Morrisey MA, Wright NC, Yun H, Curtis JR. Central DXA utilization shifts from office-based to hospital-based settings among medicare beneficiaries in the wake of reimbursement changes. J Bone Miner Res. 2012;27(4):858–64. doi: 10.1002/jbmr.1534. [DOI] [PubMed] [Google Scholar]


