Abstract
Amino acid side-chain fluctuations play an essential role in the structure and function of proteins. Accordingly, in theoretical studies of proteins it is important to have an accurate description of their conformational properties. Recently, new side-chain torsion parameters were introduced into the CHARMM and Amber additive force fields and evaluated based on the conformational properties of the individual side-chains using protein simulations in explicit solvent. While effective for validation, MD simulations of proteins must be extended into the microsecond regime to obtain full convergence of the side-chain conformations, limiting their use for force field optimization. To address this, we systematically test the utility of explicit solvent simulations of (Ala)4-X-(Ala)4 peptides, where X represents the amino acids, as model systems for the optimization of χ1 and χ2 side-chain parameters. The effect of (Ala)4-X-(Ala)4 backbone conformation was tested by constraining the backbone in the α-helical, C5, C7eq and PPII conformations and performing exhaustive sampling using Hamiltonian replica exchange simulations. Rotamer distributions from protein and the (Ala)4-X-(Ala)4 simulations showed the highest correlation for the C7eq and PPII conformations, though agreement was best for the α-helical conformation for Asn. Hydrogen bond analysis indicate the utility of the C7eq and PPII conformations to be due to specific side-chain-backbone hydrogen bonds not being oversampled, thereby allowing sampling of a range of side-chain conformations consistent with the distributions occurring in full proteins. It is anticipated that the (Ala)4-X-(Ala)4 model system will allow for iterative force field optimization targeting condensed phase conformational distributions of side-chains.
Introduction
Experiments to understand the structure and dynamics of proteins are often coupled with computer simulations to investigate atomic scale phenomena related to biological function1,2. Atomistic details of protein folding processes3, ligand-binding pathways4, and dynamical events contributing to catalysis5 are some examples where computer simulations have yielded novel insights into protein function. To achieve these successes proper conformational sampling in the computer simulations plays a critical role.
Sampling of conformational space of proteins in MD simulations based on empirical energy functions depends on the force field. In protein force fields significant effort has been made to improve the peptide backbone parameters to achieve the correct conformational sampling in polypeptides6–12. These typically include additional optimization of the φ and ψ dihedral angle parameters, including adjustments to the CMAP 2D dihedral energy correction map used in the CHARMM6,8 and AMOEBA force fields13, targeting the reproduction of NMR data for (Ala)5 and related peptides. However, concerted efforts to improve the parameters associated with the side-chain conformational properties have been limited despite the important role of side-chains. Most force fields, such as OPLS-AA14,15, Amber16, and CHARMM17,18, parametrized individual side-chains focusing on model compounds. This allowed optimization of the both non-bond and bonded terms targeting small molecule (e.g. ethanol in the case of serine) quantum mechanical (QM) and experimental data. The obtained parameters were then applied directly to the amino acid side-chains sharing the same dihedral angle parameters. However, this approach has been shown to yield relatively poor agreement with experimentally observed conformational properties of side-chains in full protein simulations19–21. Therefore, improvements in the treatment of side-chain conformational properties in proteins via additional dihedral angle parameter optimization are anticipated to improve the accuracy of force fields.
An early effort to address limitations in the χ1 and χ2 torsion parameters was undertaken in the context of the OPLS-AA force field15 and later validated via the prediction of side-chain conformations in condensed phase properties on 36 proteins22. During the optimization process, implicit solvent was used for computational efficiency and local minima of χ1 and χ2 were found by energy minimization. Although the optimization procedure only minimized one residue while the conformation of the remaining residues were fixed, it led to improved accuracy of the force field. More recently, new χ1 torsion parameters in the Amber 99SB force field for selected residues were presented19. The parameters were optimized based on the model system (Ala)4-X-(Ala)4, where X represents one of 17 amino acids. In MD simulations of the (Ala)4-X-(Ala)4 peptides the backbone was restrained to the alpha helical conformation to focus on sampling of χ1 and the peptides subjected to MD simulations of over 700 ns to obtain adequate sampling of the targeted dihedral. Populations of χ1 from both the (Ala)4-X-(Ala)4 peptides and protein simulations were compared with PDB statistics. Four residues, Ile, Leu, Asp, and Asn, which showed large differences in χ1 sampling from a PDB survey of rotamer distributions were selected, and the relevant dihedral parameters optimized against QM energies, followed by evaluation with extended MD simulations of four proteins. Protein NMR data for the proteins showed the new parameters to yield improved agreement with the experimental data. Given the importance of proper sampling of χ1 and χ2 and the need to optimize the associated parameters, at least in part, based on condensed phase simulations, the selection of computationally accessible model systems is very important.
Ideal reference for parameter optimization would be a condensed phase system, as most force fields are intended for use in explicit solvent simulations. There is a large amount of NMR data on side-chain conformations in folded proteins. However, in many cases, the data can be explained by only a single rotamer being predominantly occupied due to the constraints of the surrounding protein. Thus, this data is not the most stringent test of “intrinsic” rotamer preferences, and moreover the protein environment introduces a dependency on the energy of side-chain interactions. Better models for comparison are unfolded or disordered peptides, where the side-chains may adopt any allowed rotamer. For example, experimental data is available for a number of unfolded proteins in chemical denaturant. In choosing computational model systems to be used in simulations for side-chain parameter optimization, dipeptides may be considered the smallest system to check condensed-phase properties. Of course, unfolded protein simulations in explicit solvent allow the most rigorous comparison with experiment, but they may be considered computationally inaccessible when multiple iterations of parameter optimization are required.
Between the two extremes, (Ala)4-X-(Ala)4 peptides are interesting models as they are small and their simulation requires relatively short times to converge when using enhanced sampling methodologies. Importantly, (Ala)4-X-(Ala)4 will be more representative of the experimental regimen than dipeptides, since the side-chains can have interactions with the backbone beyond the adjacent peptide bonds. In the present work, we build on the use of (Ala)4-X-(Ala)4 as a model system for χ1 and χ2 sampling19 by systematically evaluating the utility of the model to reproduce sampling in the full unfolded proteins for all the amino acids excluding Gly, Ala, Val, and Pro. These tests included the role of backbone conformation on the sampling and of a Hamiltonian Replica Exchange23,24 approach exploiting the CMAP utility6 in CHARMM18 to achieve converged sampling in a computationally accessible amount of computer and real time.
Methods
Empirical force field calculations were performed using the program CHARMM18 with the CHARMM22/CMAP6,17,25 and the recently developed CHARMM368 additive protein force fields. All calculations on (Ala)4-X-(Ala)4 included backbone restraints on ϕ and ψ to values listed below using a harmonic restraining force of 103 kcal/mol/rad2. Hamiltonian replica exchange (HREX) simulations were performed using the REPDSTR module in CHARMM. Molecular dynamics (MD) simulations were conducted at 300K with the equations of motion integrated using the Leap-Frog integrator26 with a 1 fs integration time step for a total of 6 or10 ns, according to convergence (see below), with coordinates saved every 1 ps for analysis. Covalent bonds involving hydrogen atoms were constrained to their equilibrium bond length by the SHAKE algorithm27. (Ala)4-X-(Ala)4 was immersed in a 32 Å cubic TIP3P28 water box and waters with the oxygen within 2.8 Å of the peptide deleted resulting in approximately 1000 water molecules. Periodic boundary conditions29 were used and an isotropic long-range correction30,31 was used to account for Lennard Jones (LJ) interactions beyond the cutoff distance of 12 Å with force switching32 over the last 2 Å. Electrostatic interactions were calculated using the particle mesh Ewald method33 with a real space cutoff of 12 Å using a kappa value of 0.34 on an approximately 1 Å grid with a 6th order spline. The system was minimized via the steepest descent and adopted basis Newton-Raphson methods for 1500 steps and then simulated in the NPT ensemble (300K, 1atm) using the Nosé-Hoover thermostat and Langevin piston34–37 to control the pressure with a piston mass of 400 amu and collision frequency of 20 ps−1.
Different parts of the Hamiltonian in the HREX simulations were modified according to the amino acid side-chain. First, for all residues a χ1, χ2 2-dimensional (2D) potential energy surface (PES) was calculated for the amino acid dipeptide with the backbone conformation restrained in one of the four targeted conformations. The energies were determined in 15° increments of χ1 and χ2 from −180° to 180°. On each grid point a harmonic restoring force of 105 kcal/mol/rad2 was applied to the χ1 and χ2 dihedrals and the energy was minimized to a gradient of 10−5 kcal/mol/Å. Based on the respective PES, 2D χ1, χ2 grid-based energy correction maps analogous to those previously developed for the ϕ, ψ backbone dihedrals6 were created, called χ-CMAP herein, yielding an inverted PES (i.e. the change in energy as a function of χ1, χ2 was inverted from the unmodified CHARMM surface) and applied using the CMAP utility. The λ=0 state (χ-CMAPλ=0) was the absence of the χ-CMAP (i.e. standard CHARMM potential) and the fully perturbed state (χ-CMAPλ=1) was the inverted 2D (χ1, χ2) PES. For the HREX calculations there were 9 replicas with λ=0.00, 0.09, 0.18, 0.27, 0.36, 0.45, 0.54, 0.63, and 0.72. For polar residues it was necessary to overcome strong electrostatic interactions such as hydrogen bonding between the side-chains and backbone or water. Therefore scaling was performed to neutralize the partial atomic charges (i.e. side-chain charges set to 0.0 in the λ'=1 state) with λ'=0.00, 0.15, 0.30, 0.45, 0.60, 0.75, 0.90, 1.05 and 1.20. At λ'=1.05 and 1.20 the partial charges of the side-chain atoms have the opposite signs to the original charges. Charge scaling is feasible with charged residues although the sum of charges becomes non-integer for the intermediate λ' values. One difference made in scaling charges of cationic or anionic residues was that charges were modified more gradually across replicas by using λ'=0.0, 0.1, 0.2, 0.3, 0.4, 0.5, 0.6, 0.7 and 0.8 as required to achieve appropriate exchange acceptance ratios. Replicas were exchanged every 1 ps and, as shown below, convergence could be obtained in 6 ns for most residues and 10 ns for charged residues and those containing rings. It should be noted that the present HREX scheme does not represent a 2D perturbation as the two aspects of the energy function being altered were changed in a synchronous fashion, such that in replica 2, the first excited state, the CMAP and charge (neutral case) lambda's were 0.09 and 0.15, respectively, in replica 3 they were 0.18 and 0.30 and in the highest replica they were 0.72 and 1.20 for neutral residues.
Two parameter sets C22/CMAP and CHARMM36 (C36) were used to compare the effect of different side-chain parameters. Conformations from the λ=0 state replica alone were subjected to analyses and χ1 and χ2 torsions and their probability of population to be in −180 (trans, or t), −60 (gauche−, or g−), and 60 (gauche+, or g+) conformations were calculated. g+ is defined as 0° ≤ χ < 120°, t as 120° ≤ χ < 240° and g− as 240° ≤ χ < 360°. To check convergence of the MD simulations t, g−, and g+ rotamer populations were evaluated as a function of simulation time. 10ns simulations were divided into five 2ns segments and the changes of populations were monitored and compared with the average population over 10ns. All (Ala)4-X-(Ala)4 simulations were performed using CHARMM C36a3 or a revised version of C36a2. Local computer clusters and XSEDE supercomputing resources were used where it takes approximately 1 to 3 days to obtain (6ns × 9replicas) on 72 processors depending on the resource.
Protein simulation results were obtained from the recent study by Best et. al8. Proteins used for unfolded state simulations were Ubiquitin (UB) and the B1 domain of G protein (GB1). 200 ns unfolded simulations were performed in the presence of 8 M urea, the same concentration used in the NMR experimental study38, in a 70 Å truncated octahedron cell. Sampling was enhanced using the solute tempering replica exchange method39,40 in a modified version of GROMACS 4.5.341. Folded state simulations were performed on Ubiquitin (UBQ, PDB ID:1UBQ), Bovine pancreatic trypsin inhibitor (BPTI, 5PTI), B3 domain of G protein (GB3, 1P7E) and Hen egg white lysozyme (HEWL, 6LYT). Folded protein simulations were run for 200 ns using explicit solvent MD at 300K and 1bar using GROMACS. Results from simulations with both C22/CMAP and C36 were used for the comparison with the (Ala)4-X-(Ala)4 simulations.
Results and Discussion
The populations of χ1 and χ2 are dependent on the local (ϕ ψ) secondary structure42. As a result, amino acids have different propensities for secondary structures and show different populations of rotamers depending on the environment43. For example, Met, Gln, Glu, Lys and Leu favor helix formation and are found in helices with a high probability. In contrast the remaining amino acids favor either the extended or disordered backbone conformations or show no significant preference for secondary structure. Although movements of side-chains and the backbone are correlated, in a simple model system, such as (Ala)4-X-(Ala)4, designed to reproduce side-chain conformational preferences, it is efficient to have a restrained backbone conformation, thereby eliminating those degrees of freedom while focusing on full conformational sampling of the side-chains; this also facilitates comparison with data from the PDB. Accordingly, four backbone conformations were considered including the C7eq and PPII conformations, which are involved in turns or loops, with the latter dominating the sampling of small peptides in solution, C5 as an extended conformation, and the right-handed alpha helix (αR). Representative (φ, ψ) angles were C7eq (−82.8, 77.9), C5 (−155.0, 150.0), PPII (−75.0, 150.0), and αR (−63.0, −45.0)6. Amino acids tested in the present study include charged residues, Arg, Asp, Glu and Lys, the polar residues Asn, Cys, His, Gln, Ser, Thr, Trp and Tyr and the hydrophobic residues Ile, Leu, Met and Phe. With four different backbone conformations and two force fields, the total number of systems simulated was 128.
The convergence of conformational sampling was checked by analyzing the χ1 and χ2 populations as a function of time in the HREX simulations. Rotamer distributions were computed every 2 ns and within 6 ns most residues achieved equilibrium in sampling (Table S1, Figure S1, Supporting Information). In many of the shorter, neutral amino acids, such as Asn, and Ile, convergence is achieved within 2 ns of HREX sampling. However, in most cases more extensive sampling is required, with extreme cases being the charged or aromatic amino acids. With χ2 a similar pattern was observed with respect to the type of amino acid (Table S2, Figure S2, Supporting Information), with convergence typically occurring with less sampling as compared to χ1 due to higher transition rates between the low energy conformations. After inspecting the results from the C22/CMAP (Ala)4-X-(Ala)4 simulations for all the backbone conformations, 10 ns for charged residues (Arg, Asp, Glu, Lys) and ring-containing residues (His, Phe, Trp, Tyr) and 6 ns for other residues were deemed adequate to obtain convergence; this extent of sampling was also used in the C36 FF calculations.
An example of the ability of the HREX method to improve sampling over standard MD is shown in Figure 1 for Asn. Results are presented for both 6 ns HREX simulations and 6 ns of standard MD with only the backbone restraints. The increased sampling in the HREX simulation over the standard MD is evident. In particular, sampling of χ1 was significantly improved in the HREX simulations. While the HREX results were obtained over 72 cores versus 8 for the MD simulation, it is evident that extended standard MD simulations would be required to obtain adequate convergence. In previous work, MD simulations were extended to 720 ns to obtain converged results19. Thus, HREX simulations, which can take advantage of local computer clusters, can produce adequately converged results in a time frame appropriate for iterative parameter optimization as required to reproduce condensed phase data.
Figure 1.
Sampling of the Asn χ1 and χ2 torsions (°) from (a) HREX MD and (b) standard MD simulations. From top to bottom, panels show results in four different backbone conformation of (Ala)4-Asn-(Ala)4 simulated with the C22/CMAP FF.
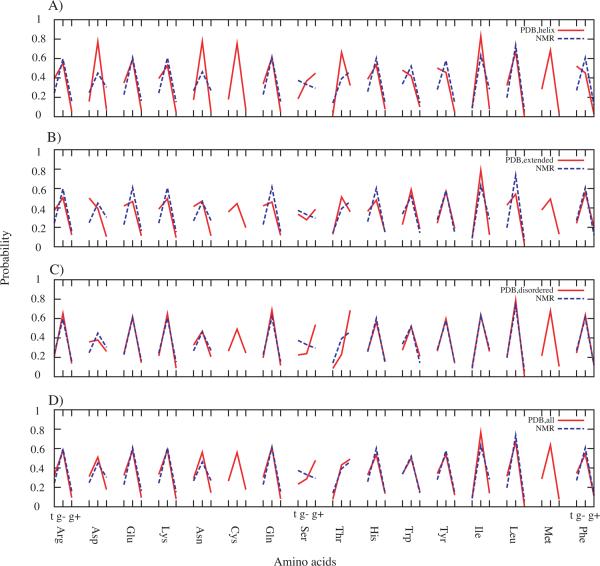
As the primary goal of the present study was the development of a model for optimization of side-chain dihedral parameters, analysis focused on the comparison of rotamer distributions from protein simulations using the same force field with those from the (Ala)4-X-(Ala)4 model system simulations. However, the question arises as to what is the ideal state of the protein to consider when performing parameter optimization; unfolded (denatured) or folded (native). For example, it may be most appropriate to target sampling of χ1 and χ2 in the unfolded states, which would limit biases associated with different types of secondary structure. Alternatively, folded proteins may be considered ideal as they do include secondary structure contributions that impact sampling of χ1 and χ2. To address this issue, we compared χ1 rotamer probability distributions from NMR studies of denatured proteins38 and from our recent survey of the PDB44. Presented in Figure 2 are the rotamer populations from the two sets of experimental data. In Figure 2A through C, PDB survey data were divided into helical, extended and disordered conformations according to the secondary structure definition by STRIDE. Figure 2D is without such classification. Although the rotamer distributions obtained from extended or disordered secondary structures in the PDB are more similar to those inferred from NMR studies of denatured proteins, notable is the overall similarity of the χ1 distributions between the unfolded and folded states regardless of secondary structures. The only significant difference occurs for Ser. Previously, this difference was suggested to be due to urea hindering the side-chain from hydrogen bonding with the backbone for the χ1 g+ rotamer in unfolded proteins38. However, the deviation may simply be based on the limited number of Ser residues in the NMR study, as discussed below. In addition, other studies of unfolded proteins45–47 reported good agreement between unfolded and folded states, including for Ser. Thus, the degree of similarity between sampling of χ1 in both unfolded and folded proteins indicates that using either state of the protein when evaluating (Ala)4-X-(Ala)4 as a model system is appropriate.
Figure 2.
Probability of t, g− and g+ χ1 rotamers in the 16 amino acids from the PDB survey and NMR denatured protein experiments. PDB survey was sub-grouped into A) helical secondary structures, B) extended structures, C) disordered structures (e.g. loops and turns) and D) including all secondary structures. Missing data for Cys is due to its absence in the proteins used in the NMR experiments.
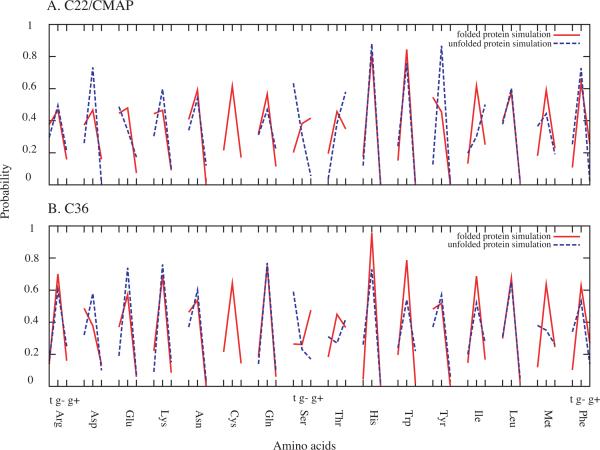
Sampling of different rotamers for the amino acids from the unfolded and folded protein simulations8 using both force fields are shown in Figure 3. Overall, the patterns are similar with respect to unfolded versus folded proteins and between the two force fields. For the majority of amino acids, the g− rotamer dominates with the most notable exceptions occurring with Ser. Some differences between C22/CMAP and C36 occur with most amino acids, associated with the additional optimization of the χ1 and χ2 dihedral parameters in C36. However, the overall trends are similar between the calculated results from the two force fields and from the folded and unfolded proteins (which is consistent with the experimental data for the folded and unfolded proteins (Figure 2)), indicating that the use of protein simulation data for validation of (Ala)4-X-(Ala)4 as a model is appropriate.
Figure 3.
Comparison of calculated rotamer distributions between unfolded and folded protein simulations for the A) C22/CMAP and B) C36 MD simulations.
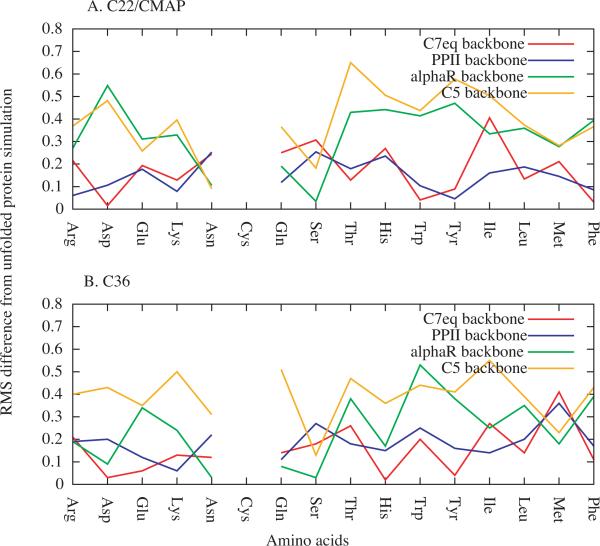
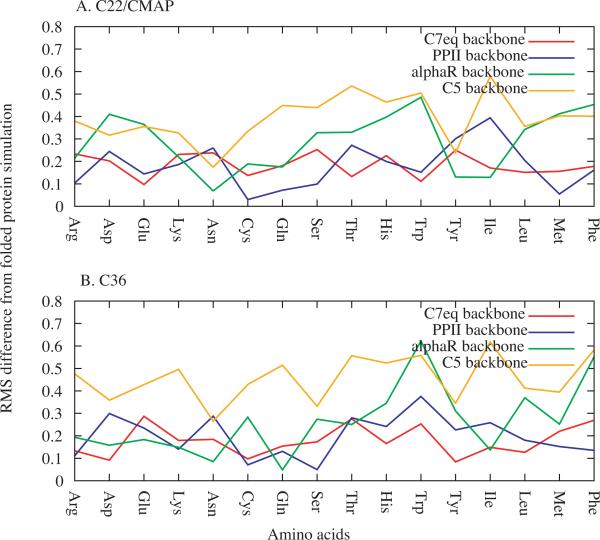
Analysis of the ability of (Ala)4-X-(Ala)4 to act as a model system for χ parameter optimization involved the RMS differences of the t, g+ and g− rotamer populations between the (Ala)4-X-(Ala)4 simulations and both the unfolded protein (Figure 4) and folded protein (Figure 5) simulations. Comparison of the percent sampling of the three rotamers as a function of amino acid from the (Ala)4-X-(Ala)4 simulations and the unfolded protein simulations for C22/CMAP and C36 are shown in Figures S3 and S4 of the Supporting Information, respectively. Analysis of the RMS differences in Figure 4 and 5 show significant variation as a function of backbone conformation and residue type. However, for both FFs and with respect to both the unfolded and folded protein simulations, there is a tendency for the C7eq and PPII backbone conformations to give the smallest RMS differences.
Figure 4.
RMS differences of t, g−, and g+ populations between the (Ala)4-X-(Ala)4 and unfolded protein simulations as a function of residue type in the A) C22/CMAP and B) C36 FFs.
Figure 5.
RMS differences of t, g−, and g+ populations between the (Ala)4-X-(Ala)4 and folded protein simulations as a function of residue type in the A) C22 and B) C36 FFs.
RMS differences and correlation coefficients between the (Ala)4-X-(Ala)4 and protein simulations over all the amino acids studied for the four backbone conformations are presented in Table 1. With respect to the unfolded protein simulations for the four backbone conformations, overall agreement of the (Ala)4-X-(Ala)4 χ1 results are good for both the C7eq and PPII backbone conformations. With C7eq, the average of the RMS differences are 0.18 and 0.15 in C22/CMAP and C36, respectively, and the correlation coefficients are 0.74 and 0.85, while for the PPII conformation the RMS differences are 0.15 and 0.18 and the correlation coefficients are 0.80 and 0.79, respectively. With the folded protein simulations, the RMS differences are 0.18 and 0.18 with C7eq for the C22/CMAP and C36 FF, respectively, and 0.18 and 0.20 with the PPII backbone. Correlation coefficients are 0.79 and 0.83 with C7eq and 0.64 and 0.71 with PPII. Notably, C7eq and PPII backbone conformations yield the best overall agreement for the χ1 distributions with respect to both the unfolded and folded protein simulations.
Table 1.
RMS differences and correlation coefficients between (Ala)4-X-(Ala)4 χ1, χ2 rotamer distributions and those of folded and unfolded proteins, for the different backbone conformations of (Ala)4-X-(Ala)4 over all the studied amino acids.
| Average RMSD | Correlation coefficients | |||||||
|---|---|---|---|---|---|---|---|---|
| C22/CMAP | C36 | C22/CMAP | C36 | |||||
| χ 1 | χ 2 | χ 1 | χ 2 | χ 1 | χ 2 | χ 1 | χ 2 | |
| Unfolded Protein Simulations | ||||||||
| C5 | 0.39 | 0.16 | 0.39 | 0.20 | −0.25 | 0.76 | −0.18 | 0.43 |
| PPII | 0.15 | 0.14 | 0.18 | 0.13 | 0.80 | 0.74 | 0.79 | 0.67 |
| C7eq | 0.18 | 0.16 | 0.15 | 0.18 | 0.74 | 0.68 | 0.85 | 0.54 |
| αR | 0.33 | 0.16 | 0.24 | 0.17 | 0.23 | 0.67 | 0.45 | 0.44 |
|
| ||||||||
| Folded Protein Simulations | ||||||||
| C5 | 0.39 | 0.14 | 0.46 | 0.21 | −0.35 | 0.80 | −0.27 | 0.43 |
| PPII | 0.18 | 0.13 | 0.20 | 0.20 | 0.64 | 0.77 | 0.71 | 0.44 |
| C7eq | 0.18 | 0.16 | 0.18 | 0.22 | 0.79 | 0.71 | 0.83 | 0.44 |
| αR | 0.29 | 0.16 | 0.26 | 0.18 | 0.33 | 0.72 | 0.43 | 0.48 |
χ2 distributions in the (Ala)4-X-(Ala)4 simulations also produced good agreement with those from the protein simulations in the C7eq and PPII backbone conformations. RMS differences from unfolded protein simulations were 0.16 and 0.14 for C22/CMAP and 0.18 and 0.13 for C36 with C7eq and PPII, respectively, and correlation coefficients were 0.68 and 0.74 for C22/CMAP and 0.54 and 0.67 for C36. However, χ2 sampling was less dependent on backbone conformations than χ1, showing similar correlations for all four backbone conformations, with only the C7eq conformation with C36 showing some improvement. The similarity of the (Ala)4-X-(Ala)4 χ2 results for all four backbone conformations is, to some extent, expected given that χ2 is one bond removed from the peptide backbone as compared to χ1. Thus, when considering both χ1 and χ2 and all the amino acids together both the C7eq and PPII conformations yield the best overall agreement with the protein simulations.
That the PPII conformation of (Ala)4-X-(Ala)4 is in good agreement with the unfolded protein simulations is not surprising as in those conditions it may be anticipated that the protein backbone samples significant amounts of that conformation48–50. However, the PPII conformation also gives good agreement for folded proteins even though it is not as highly populated as compared to extended and αR conformations. The good agreement for C7eq, which is not sampled significantly in either unfolded or folded proteins was somewhat surprising, but its ϕ, ψ values are similar to that of PPII (see below). In contrast, the C5 conformation gives the largest RMS differences and negative correlation coefficients. As this conformation corresponds to that occurring in beta sheets the result is not unexpected; in sheets the backbone N-H and carbonyl moieties are typically hydrogen bonding with other peptide bonds and not available for interactions with the side-chains. While this scenario is more relevant for folded proteins, it appears to also apply with the unfolded proteins. Finally, the sampling of χ1 in the αR conformation is also in poor agreement with that occurring in both the unfolded and folded proteins. This would again be suggested to be due to the lack of helical secondary structure in denatured proteins; however, the level of agreement is similarly poor with respect to the folded protein results. Additional analysis was therefore undertaken to better understand the nature of the interactions of the side-chains with the backbone leading to the differential ability of the studied backbone conformations to reproduce rotamer sampling seen in the protein simulations.
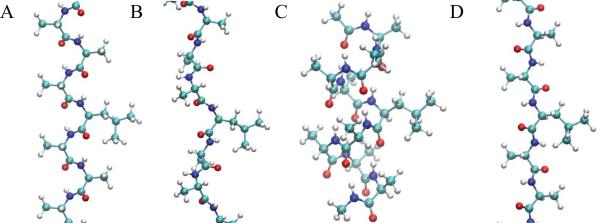
Differences in the sampling of χ1 in the four backbone conformations of (Ala)4-X-(Ala)4 are expected to be due to changes in the ability of NH and O atoms in the peptide bonds to interact with their environment. Shown in Figure 6 are images of the central region of the (Ala)4-Leu-(Ala)4 peptide in the four backbone conformations. The C7eq, PPII and C5 conformations have higher solvent exposure of the NH and O atoms in the peptide backbone as compared to the αR conformation, where they are participating in the classical intrabackbone i to i+4 hydrogen bonds. Thus, in αR hydrogen bonding with the environment is expected to be perturbed. However, the significant difference in the agreement between the (Ala)4-X-(Ala)4 and protein results for C7eq, PPII and C5 is somewhat surprising, as significant hydrogen bonding interactions with the environment are possible in all three cases. Towards understanding this effect, the percentage of side-chain rotamer conformations involved in hydrogen bonds with the backbone based on a 3.5 Å cutoff criteria for non-hydrogen atoms was calculated for all polar and charged amino acids (Table S5 of the Supporting Information). While smaller percentages are seen with Asp and His for αR, significant trends between the backbone conformations are not present based on this simple analysis.
Figure 6.
Structures of the central region of (Ala)4-Leu-(Ala)4 in the A) C7eq, B) PPII, C) αR and D) C5 backbone conformations.
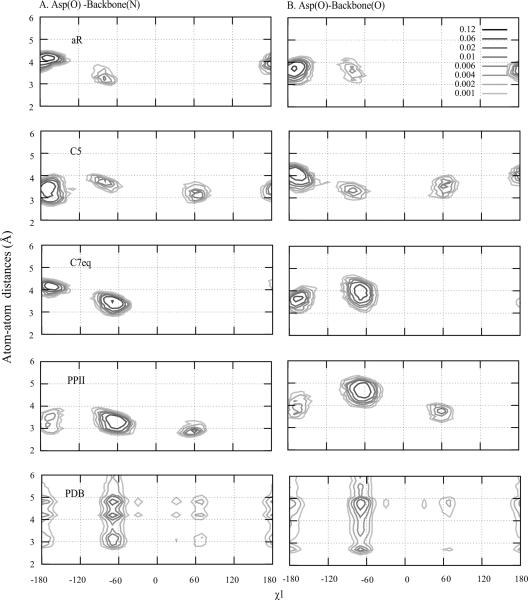
Further analysis involved probability distributions of side-chain to backbone polar atom distances as a function of χ1 for the different backbone conformations. In addition, the distance distributions were obtained for the individual residues from the PDB survey. Figure 7 shows the distance probability distribution for Asp. Analysis of the PDB data at the bottom of the figure shows the interactions between the side-chain and the backbone to occur to varying degrees from all three χ1 rotamers, with those involving g− being the most populated. In the C7eq and PPII (Ala)4-X-(Ala)4 C22/CMAP simulations significant hydrogen bonding also occurs with the g− rotamer, leading to that rotamer dominating the sampling and the good agreement with the protein data (Figure 4). With PPII hydrogen bonding in the g− rotamer dominates, with some sampling of both t and g+, while with C7eq no significant sampling in the g+ rotamer is present. In the αR and C5 backbone conformations significant interactions occurs with the t conformation while significant sampling in g+ also occurs with C5. This trend, where side-chain-backbone interactions from the g− rotamer dominate with C7eq and PPII, while t and/or g+ interactions dominate in the aR and C5 conformations is a trend seen with the majority of amino acids (Figure S5 of the Supporting Information). Indeed, it is these favorable interactions involving the g− rotamer that lead to enhanced sampling of that conformation in proteins (Figure 2), such that the C7eq and PPII backbone conformations are the most representative of side-chain sampling in proteins.
Figure 7.
Probability distribution of atom-atom distances (Å) of Asp as a function of χ1 for the four backbone conformations of (Ala)4-Asp-(Ala)4 with the C22/CMAP force field and from a survey of the PDB. Distances between A) oxygen of Asp and nitrogen of backbone and B) between oxygen of Asp and oxygen of backbone are shown.
Sampling of the C5 backbone conformations of (Ala)4-X-(Ala)4 showed large deviations from denatured protein simulations, with the negative correlations being due to undersampling of the g− state (Figures S3 and S4, Supporting Information). This was typically due to oversampling of the t state associated with side-chain-backbone interactions in that rotamer (Figure 7 and S5), though with Arg, Gln and Lys the g+ rotamer was oversampled. It is known that in beta sheets when the side-chain of residue i assumes the g− rotamer, it has a steric clash with the side-chain of residue i−251; however, this cannot occur with (Ala)4-X-(Ala)4. Rather the dominant contributor to oversampling of the t state, or g+ in the case of Arg, Gln, and Lys, is hydrogen bonding of the side-chain with the backbone (Figure S5). This effect is particularly dominant with the shorter polar side-chains, Asp, Asn, and Ser, though with the latter a high level of the t rotamer is present in the unfolded proteins UBQ and GB1. Thus, the enhanced sampling of the t and g+ rotamers with C5 is due to the orientation of the peptide bonds in the extended conformation allowing significant hydrogen bonding with those rotamers, while the more “helical” character of the C7eq and PPII conformations (Figure 6) disallows those interactions from dominating rotamer sampling.
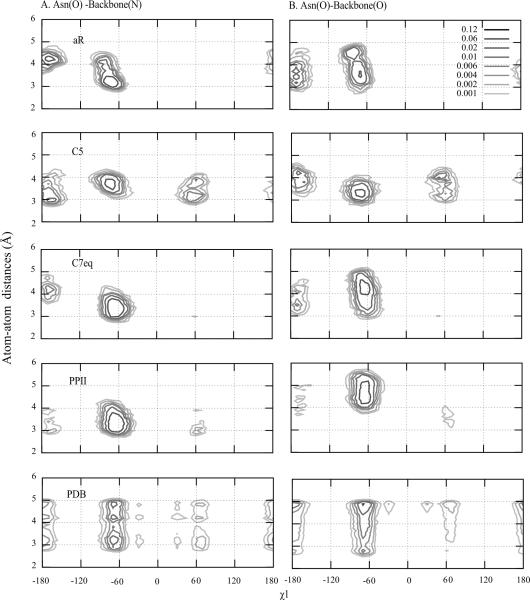
The poor agreement of the αR backbone conformation with the protein simulation results was also due to dominant sampling of t rotamers in (Ala)4-X-(Ala)4. As mentioned above, the disagreement is reasonable given the nature of unfolded protein simulations. However, it is interesting that (Ala)4-X-(Ala)4 simulations with the helical backbone were sampling high populations of t, which are found in the PDB to occur predominately in alpha helical secondary structures51. The large population of t is due to steric clashes occurring in the g+ and g− conformations as well as the favorable hydrogen bonding with the backbone (Figure S5). The even larger t populations in the (Ala)4-X-(Ala)4 simulations is suggested to be due to a lack of interactions with other side-chains in the surrounding protein environment that would compete for hydrogen bonding with the backbone. However, there are some notable results that are consistent between the calculated data for selected amino acids with the αR backbone conformation. For Asn and Ser the αR conformation of (Ala)4-X-(Ala)4 is predicted to be the most representative for the denatured proteins (Figure 4). This is also true for Asn with respect to the folded protein simulations (Figure 5). To explain this we investigated interactions of the Asn side-chain with the peptide backbone. Figure 8 shows probability distributions of distances between the side-chain and backbone heteroatoms of Asn as a function of χ1. The majority of hydrogen bonding occurs from the g− state in the PDB survey followed by the t rotamer while only a minimal amount of hydrogen bonding occurs in the g+ rotamer, though some sampling is evident. This is consistent with the relative populations of the three rotamers in the PDB survey (Figure 2). However, in the protein simulations virtually no sampling of the g+ rotamer occurs (Figure 3). This trend is reproduced in the (Ala)4-X-(Ala)4 simulations with the aR backbone conformation (Figures S3 and S4) leading to that conformation appearing to be the most appropriate for χ dihedral parameter optimization. However, this conclusion should be taken with caution in that the amount of g+ sampling is significantly underestimated in the protein simulations (Figure 3) such that the apparent quality of the aR backbone conformation may be due to FF effects.
Figure 8.
Probability distribution of atom-atom distances (Å) of Asn as a function of χ1 for the four backbone conformations of (Ala)4-Asn-(Ala)4 with the C22/CMAP force field and from a survey of the PDB. Distances between A) side-chain oxygen of Asn and nitrogen of backbone and B) between side-chain oxygen of Asn and oxygen of backbone are shown.
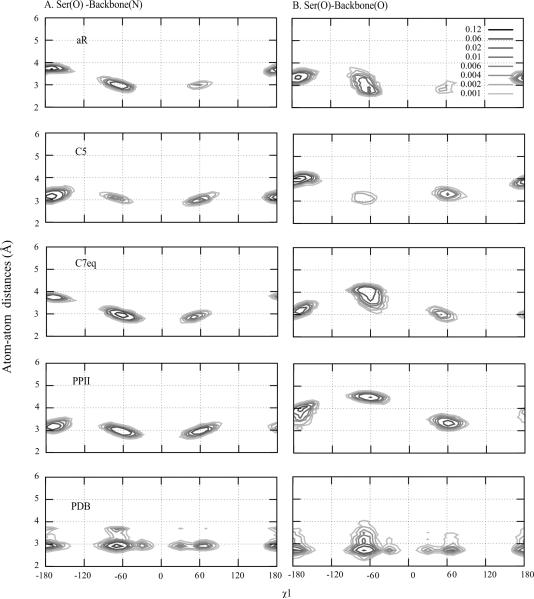
The change in the RMS differences between the unfolded and folded proteins in the case of Ser is interesting (Figure 3). Analysis of Figure 2 shows this to be the only amino acid in which the pattern of χ1 rotamer sampling changes significantly between the NMR and PDB data, though this difference is based on the limited Ser sample size in the NMR data set (Table S6). While disallowing general conclusion, this sampling matches that occurring in the unfolded protein simulations of UBQ and GB1 where the t state dominates followed by the g− and g+ states, consistent with the NMR experiments. To understand details of the rotamer sampling, analysis of side-chain-backbone interactions was undertaken (Figure 9). Ser formed strong hydrogen bonds with the backbone in the t and g− rotamers in the PDB survey. Given the size of the Ser side-chain such that the hydroxyl and backbone are in close proximity, these “intramolecular” hydrogen bonds dominate in the absence of well-defined interactions with the surrounding environment, as occurs in the denatured states of proteins investigated in the NMR experiments and in the (Ala)4-X-(Ala)4 simulations. Upon folding of proteins, additional interactions with the environment can occur, leading to lower sampling of the t rotamer, consistent with the PDB survey data. For example, Ser47 in BPTI forms a strong hydrogen bond with Asp50 in the g+ conformation. While the generality of these results are limited by the number of specific residue types in the NMR experiments as well as the protein simulations, the analysis suggests that for the majority of amino acids the environment of the side-chains is similar enough in the unfolded and folded states that the change in environment does not significantly impact the rotatmer sampling. Only in the case of Ser and, to some extent Thr, where hydrogen bonding between the side-chain and backbone is also favored does the loss of the more structured 3D environment in the unfolded states lead to more interactions with the backbone thereby changing the rotatmer populations.
Figure 9.
Probability distribution of atom-atom distances (Å) of Ser as a function of χ1 for the four backbone conformations of (Ala)4-Ser-(Ala)4 with the C22/CMAP force field and from a survey of the PDB. Distances between A) side-chain oxygen of Ser and nitrogen of backbone and B) between side-chain oxygen of Ser and oxygen of backbone are shown.
As stated above, there are some inconsistencies between the two C22/CMAP and C36 data sets and comparison of Figures 3 and 4 show inconsistencies between the unfolded and folded protein results. These inconsistencies are, in part, due to the relatively small number of selected side-chains in the protein data set (Table S6). For example, there are only 4 Arg, 2 Met, 1 His, 3 Ser and 1 Trp side-chains in the unfolded protein set. The overall representation is better in the folded proteins, although there are only 5 Met and 2 His residues. The inconsistencies can also be due to the lack of sampling in the protein simulation. Depending on the residue and the FF, the standard deviations of t, g− and g+ populations are different (Table S3). The average standard deviation and standard error over all amino acids in C22/CMAP FF were 0.13 and 0.05, respectively, versus 0.10 and 0.04 for the C36 FF. As the C22/CMAP and C36 simulations were performed for 150 ns, the problems with convergence further indicate that the (Ala)4-X-(Ala)4 model system can complement full protein simulations especially in their ability to obtain adequately converged data as required for FF optimization.
It should be noted that in the folded protein simulations higher standard deviations occur as compared to the unfolded state despite the larger number of each side-chain. The average standard deviation and standard error were 0.32 and 0.09 in the C22/CMAP FF and 0.31 and 0.08 in the C36 FF (Table S4). This is due to the difficulty of obtaining full sampling of the χ1 and χ2 rotamers in standard MD simulations of folded proteins, despite the simulation time being longer for the folded vs. unfolded simulations. For example, as Table S7 shows, Tyr (11 occurrences) or Phe (11 occurrences) residues usually remain in one rotamer, either t or g−, leading to the standard deviations for these residues being greater than 0.49. This phenomena may occur to a greater extent for Tyr and Phe as these residues are typically buried in the protein interior, thereby undergoing less conformational averaging than surface residues.52,53
Conclusions
In the present study (Ala)4-X-(Ala)4 model peptides were evaluated for use in the optimization of side-chain torsion parameters. This small system in combination with the applied HREX methods achieves convergence of sampling in an accessible time for iterative parameter optimization. Comparison of rotamer sampling in four backbone conformations of (Ala)4-X-(Ala)4 with that from simulations of unfolded and folded proteins was performed to identify the conformations most suitable for use as a model system for parameter optimization. Overall, this analysis indicated that (Ala)4-X-(Ala)4 simulations performed with either the PPII or C7eq backbone conformations yielded better agreement with the protein simulations and either would be suitable for use in the application of (Ala)4-X-(Ala)4 as a model system for χ1/χ2 dihedral parameter optimization. The only possible exception occurs with Asn, where the aR backbone conformation is indicated to be the most suitable. In particular, in the PPII backbone conformation the probability of hydrogen bonding with the protein backbone as a function of χ1 rotamer is most similar to that occurring in proteins, further indicating this to be the preferable conformation for using (Ala)4-X-(Ala)4 as a model system for side-chain sampling. It is anticipated that optimization of side-chain parameters in the condensed phase can be aided by the (Ala)4-X-(Ala)4 model system, facilitating further improvements in protein force fields. This would be achieved, for example, by simulating the (Ala)4-X-(Ala)4 model system with a given force field, comparing the resulting χ1 and χ2 distributions with experimental data from full proteins and then empirically optimizing the associated dihedral parameters to better improve the agreement with the target distribution (eg. lower the potential energy of a given side chain conformer whose conformation is underpopulated in the (Ala)4-X-(Ala)4 model system). Indeed, this approach was applied in the optimization of selected side chain dihedral parameters in the C36 protein force field.8 Furthermore, the use of analogous model systems in experimental studies would further help in the direct comparison of simulation with experimental data, as has been done with NMR backbone scalar couplings in oligo-alanine peptides6–12.
Supplementary Material
Acknowledgements
Financial support from the NIH to ADM (DA13583, GM051501 and GM072558) and computational support from the Computer-Aided Drug Design Center, School of Pharmacy, University of Maryland, Baltimore and the Extreme Science and Engineering Discovery Environment (XSEDE), which is supported by National Science Foundation grant number OCI-1053575, are acknowledged. RB is supported by a Royal Society University Research Fellowship.
References
- 1.Karplus M, Kuriyan J. Proc. Natl. Acad. Sci. U. S. A. 2005;102(19):6679–6685. doi: 10.1073/pnas.0408930102. [DOI] [PMC free article] [PubMed] [Google Scholar]
- 2.Karplus M, McCammon JA. Nat. Struct. Mol. Biol. 2002;9(9):646–652. doi: 10.1038/nsb0902-646. [DOI] [PubMed] [Google Scholar]
- 3.Shea JE, Brooks CL., 3rd Annu. Rev. Phys. Chem. 2001;52:499–535. doi: 10.1146/annurev.physchem.52.1.499. [DOI] [PubMed] [Google Scholar]
- 4.Gallicchio E, Levy RM. Curr. Opin. Struct. Biol. 2010;21(2):161–166. doi: 10.1016/j.sbi.2011.01.010. [DOI] [PMC free article] [PubMed] [Google Scholar]
- 5.McGeagh JD, Ranaghan KE, Mulholland AJ. Biochim. Biophys. Acta. 2011;1814(8):1077–1092. doi: 10.1016/j.bbapap.2010.12.002. [DOI] [PubMed] [Google Scholar]
- 6.MacKerell AD, Jr., Feig M, Brooks CL. J. Comput. Chem. 2004;25(11):1400–1415. doi: 10.1002/jcc.20065. [DOI] [PubMed] [Google Scholar]
- 7.Best RB, Hummer G. J. Phys. Chem. B. 2009;113(26):9004–9015. doi: 10.1021/jp901540t. [DOI] [PMC free article] [PubMed] [Google Scholar]
- 8.Best RB, Zhu X, Shim J, Lopes P, Mittal J, Feig M, MacKerell AD., Jr. J. Chem. Theory Comput. 2012 doi: 10.1021/ct300400x. DOI:10.1021/ct300400x. [DOI] [PMC free article] [PubMed] [Google Scholar]
- 9.Hornak V, Abel R, Okur A, Strockbine B, Roitberg A, Simmerling C. Proteins. 2006;65(3):712–725. doi: 10.1002/prot.21123. [DOI] [PMC free article] [PubMed] [Google Scholar]
- 10.Li DW, Brueschweiler R. J. Chem. Theory Comput. 2011;7(6):1773–1782. doi: 10.1021/ct200094b. [DOI] [PubMed] [Google Scholar]
- 11.Piana S, Lindorff-Larsen K, Shaw DE. Biophys. J. 2011;100(9):L47–49. L47–49. doi: 10.1016/j.bpj.2011.03.051. [DOI] [PMC free article] [PubMed] [Google Scholar]
- 12.Sakae Y, Okamoto Y. Mol. Simul. 2010;36(2):138–158. [Google Scholar]
- 13.Ponder JW, Wu C, Ren P, Pande VS, Chodera JD, Schnieders MJ, Haque I, Mobley DL, Lambrecht DS, DiStasio RA, Head-Gordon M, Clark GNI, Johnson ME, Head-Gordon T. J. Phys. Chem. B. 2010;114(8):2549–2564. doi: 10.1021/jp910674d. [DOI] [PMC free article] [PubMed] [Google Scholar]
- 14.Jorgensen WL, Maxwell DS, Tirado-Rives J. J. Am. Chem. Soc. 1996;118(45):11225–11236. [Google Scholar]
- 15.Kaminski GA, Friesner RA, Tirado-Rives J, Jorgensen WL. J. Phys. Chem. B. 2001;105(28):6474–6487. [Google Scholar]
- 16.Case DA, Cheatham TE, Darden T, Gohlke H, Luo R, Merz KM, Onufriev A, Simmerling C, Wang B, Woods RJ. J. Comput. Chem. 2005;26(16):1668–1688. doi: 10.1002/jcc.20290. [DOI] [PMC free article] [PubMed] [Google Scholar]
- 17.MacKerell AD, Jr., Brooks B, Brooks CLI, Nilsson L, Roux B, Won Y, Karplus M. CHARMM: The Energy Function and Its Parameterization with an Overview of the Program. Vol. 1. John Wiley & Sons; Chichester: 1998. pp. 271–277. [Google Scholar]
- 18.Brooks BR, Brooks CL, MacKerell AD, Jr., Nilsson L, Petrella RJ, Roux B, Won Y, Archontis G, Bartels C, Boresch S, Caflisch A, Caves L, Cui Q, Dinner AR, Feig M, Fischer S, Gao J, Hodoscek M, Im W, Kuczera K, Lazaridis T, Ma J, Ovchinnikov V, Paci E, Pastor RW, Post CB, Pu JZ, Schaefer M, Tidor B, Venable RM, Woodcock HL, Wu X, Yang W, York DM, Karplus M. J. Comput. Chem. 2009;30(10):1545–1614. doi: 10.1002/jcc.21287. [DOI] [PMC free article] [PubMed] [Google Scholar]
- 19.Lindorff-Larsen K, Piana S, Palmo K, Maragakis P, Klepeis JL, Dror RO, Shaw DE. Proteins. 2010;78(8):1950–1958. doi: 10.1002/prot.22711. [DOI] [PMC free article] [PubMed] [Google Scholar]
- 20.Petrella RJ, Karplus M. J. Mol. Biol. 2001;312(5):1161–1175. doi: 10.1006/jmbi.2001.4965. [DOI] [PubMed] [Google Scholar]
- 21.Renfrew PD, Butterfoss GL, Kuhlman B. Proteins. 2008;71(4):1637–1646. doi: 10.1002/prot.21845. [DOI] [PMC free article] [PubMed] [Google Scholar]
- 22.Jacobson MP, Kaminski GA, Friesner RA, Rapp CS. J. Phys. Chem. B. 2002;106(44):11673–11680. [Google Scholar]
- 23.Sugita Y, Kitao A, Okamoto Y. J. Chem. Phys. 2000;113(15):6042–6051. [Google Scholar]
- 24.Sugita Y, Okamoto Y. Chem. Phys. Lett. 2000;329(3–4):261–270. [Google Scholar]
- 25.MacKerell AD, Jr., Bashford D, Bellott Dunbrack, Evanseck JD, Field MJ, Fischer S, Gao J, Guo H, Ha S, Joseph-McCarthy D, Kuchnir L, Kuczera K, Lau FTK, Mattos C, Michnick S, Ngo T, Nguyen DT, Prodhom B, Reiher WE, Roux B, Schlenkrich M, Smith JC, Stote R, Straub J, Watanabe M, Wiorkiewicz-Kuczera J, Yin D, Karplus M. J. Phys. Chem. B. 1998;102(18):3586–3616. doi: 10.1021/jp973084f. [DOI] [PubMed] [Google Scholar]
- 26.Hockney RW. Methods Comput Phys. 1970;9:136–211. [Google Scholar]
- 27.Ryckaert JP, Ciccotti G, Berendsen HJC. J. Comput. Phys. 1977;23(3):327–341. [Google Scholar]
- 28.Jorgensen WL, Chandrasekhar J, Madura JD, Impey RW, Klein ML. J. Chem. Phys. 1983;79(2):926–926. [Google Scholar]
- 29.Allen MP, Tildesley DJ. Computer Simulation of Liquids. Vol. 1. Oxford University Press; USA: 1989. pp. 1–408. [Google Scholar]
- 30.Pitman MC, Suits F, MacKerell AD, Jr., Feller SE. Biochemistry. 2004;43(49):15318–15328. doi: 10.1021/bi048231w. [DOI] [PubMed] [Google Scholar]
- 31.Klauda JB, Wu X, Pastor RW, Brooks BR. J. Phys. Chem. B. 2007;111(17):4393–4400. doi: 10.1021/jp068767m. [DOI] [PMC free article] [PubMed] [Google Scholar]
- 32.Steinbach PJ, Brooks BR. J. Comput. Chem. 1994;15(7):667–683. [Google Scholar]
- 33.Darden T, York D, Pedersen L. J. Chem. Phys. 1993;98(12):10089–10092. [Google Scholar]
- 34.Andersen HC. J. Chem. Phys. 1980;72(4):2384–2384. [Google Scholar]
- 35.Feller SE, Zhang Y, Pastor RW, Brooks BR. J. Chem. Phys. 1995;103(11):4613–4613. [Google Scholar]
- 36.Hoover WG. Phys. Rev. A. 1985;31(3):1695–1695. doi: 10.1103/physreva.31.1695. [DOI] [PubMed] [Google Scholar]
- 37.Nosé S, Klein ML. Molecular Physics: An International Journal at the Interface Between Chemistry and Physics. 1983;50(5):1055–1055. [Google Scholar]
- 38.Vajpai N, Gentner M, Huang JR, Blackledge M, Grzesiek S. J. Am. Chem. Soc. 2010;132(9):3196–3203. doi: 10.1021/ja910331t. [DOI] [PubMed] [Google Scholar]
- 39.Camilloni C, Provasi D, Tiana G, Broglia RA. Proteins. 2008;71(4):1647–1654. doi: 10.1002/prot.21852. [DOI] [PubMed] [Google Scholar]
- 40.Liu P, Kim B, Friesner RA, Berne BJ. Proc. Natl. Acad. Sci. U. S. A. 2005;102(39):13749–13754. doi: 10.1073/pnas.0506346102. [DOI] [PMC free article] [PubMed] [Google Scholar]
- 41.Hess B, Kutzner C, van der Spoel D, Lindahl E. J. Chem. Theory Comput. 2008;4(3):435–447. doi: 10.1021/ct700301q. [DOI] [PubMed] [Google Scholar]
- 42.Dunbrack RL, Jr., Karplus M. J. Mol. Biol. 1993;230(2):543–574. doi: 10.1006/jmbi.1993.1170. [DOI] [PubMed] [Google Scholar]
- 43.McGregor MJ, Islam SA, Sternberg MJ. J. Mol. Biol. 1987;198(2):295–310. doi: 10.1016/0022-2836(87)90314-7. [DOI] [PubMed] [Google Scholar]
- 44.Zhu X, Lopes PEM, Shim J, MacKerell AD., Jr. J. Chem. Inf. Model. 2012;52(6):1559–1572. doi: 10.1021/ci300079j. [DOI] [PMC free article] [PubMed] [Google Scholar]
- 45.West NJ, Smith LJ. J. Mol. Biol. 1998;280(5):867–877. doi: 10.1006/jmbi.1998.1911. [DOI] [PubMed] [Google Scholar]
- 46.Hennig M, Bermel W, Spencer A, Dobson CM, Smith LJ, Schwalbe H. J. Mol. Biol. 1999;288(4):705–723. doi: 10.1006/jmbi.1999.2722. [DOI] [PubMed] [Google Scholar]
- 47.Mathieson SI, Penkett CJ, Smith LJ. Pacific Symposium on Biocomputing. Pacific Symposium on Biocomputing. 1999:542–553. doi: 10.1142/9789814447300_0054. [DOI] [PubMed] [Google Scholar]
- 48.Shi Z, Woody RW, Kallenbach NR. Adv. Prot. Chem. 2002;62:163–240. doi: 10.1016/s0065-3233(02)62008-x. [DOI] [PubMed] [Google Scholar]
- 49.Whittington SJ, Chellgren BW, Hermann VM, Creamer TP. Biochemistry. 2005;44(16):6269–6275. doi: 10.1021/bi050124u. [DOI] [PubMed] [Google Scholar]
- 50.Schweitzer-Stenner R, Measey T, Kakalis L, Jordan F, Pizzanelli S, Forte C, Griebenow K. Biochemistry. 2007;46(6):1587–1596. doi: 10.1021/bi062224l. [DOI] [PubMed] [Google Scholar]
- 51.Shapovalov MV, Dunbrack RL., Jr. Structure (London, England: 1993) 2011;19(6):844–858. doi: 10.1016/j.str.2011.03.019. [DOI] [PMC free article] [PubMed] [Google Scholar]
- 52.Smith LJ, Sutcliffe MJ, Redfield C, Dobson CM. Biochemistry. 1991;30(4):986–996. doi: 10.1021/bi00218a015. [DOI] [PubMed] [Google Scholar]
- 53.Lindorff-Larsen K, Best RB, Depristo MA, Dobson CM, Vendruscolo M. Nature. 2005;433(7022):128–132. doi: 10.1038/nature03199. [DOI] [PubMed] [Google Scholar]
Associated Data
This section collects any data citations, data availability statements, or supplementary materials included in this article.


