Abstract
Butyltins (BTs) have been in widespread use. Tributyltin (TBT) has been used as a biocide in a variety of applications and is found in human blood samples. Dibutyltin (DBT) has been used as a stabilizer in polyvinyl chloride plastics and as a de-worming agent in poultry. DBT, like TBT, is found in human blood. Human natural killer (NK) cells are the earliest defense against tumors and viral infections and secrete the cytokine tumor necrosis factor (TNF) alpha (α). TNFα is an important regulator of adaptive and innate immune responses. TNFα promotes inflammation and an association between malignant transformation and inflammation has been established. Previously, we have shown that TBT and DBT were able to interfere with the ability of NK cells to lyse tumor target cells. Here we show that BTs alter cytokine secretion by NK cells as well as a mixture of T and NK lymphocytes (T/NK cells). We examined 24 h, 48 h, and 6 day exposures to TBT (200- 2.5 nM) and DBT (5- 0.05 µM) on TNFα secretion by highly enriched human NK cells and T/NK cells. The results indicate that TBT (200 - 2.5 nM) decreased TNFα secretion from NK cells. In the T/NK cells 200 nM TBT decreased secretion while 100-5 nM TBT increased secretion of TNFα. NK cells or T/NK cells exposed to higher concentrations of DBT showed decreased TNFα secretion while lower concentrations showed increased secretion. The effects of BTs on TNFα secretion are seen at concentrations present in human blood.
INTRODUCTION
Tumor necrosis alpha (TNFα) is a cytokine that regulates the function of both the innate and adaptive immune system. It is initially produced as a 26 kD transmembrane protein that is then released from the membrane as a 17kD protein. It is secreted by a wide array of cells including T cells, natural killer (NK) cells, and monocytes (Goetz et al., 2004). It activates the inflammatory immune response, and is able to causes apoptosis as well as cell proliferation (Guicciardi and Gores, 2009; Silke, 2011). TNFα is a potent inflammatory stimulus and as such has the capacity to cause chronic inflammation. There is a well established connection between chronic inflammation and certain cancers such as gastrointestinal cancers (Macarthur et al., 2004). Thus, it important that TNFα levels in the body are carefully regulated to prevent either a loss of immune competency or the risks that occur due to chronic inflammation.
Natural killer (NK) cells (CD16+/CD56+, CD3−) are the earliest defense against tumors and viral infections and interference with their function increases susceptibility to cancer and viruses (Lotzova, 1993; Lanier., 2008; Kiessling and Haller, 1978; Hanna, 1980; Fleisher et al., 1982; Biron et al., 1989). Their importance in preventing cancers and viral infections has been shown both in humans and in animal models (Ortaldo, et al., 1992; Purdy and Campbell, 2009; Ballas et al., 1990; Fulton et al., 1984; Makrigiannis and Anderson, 2003; Mishra et al., 2010). They are known to secrete TNFα as well as other cytokines and this is also a significant part of their important immune function. For instance, secretion of TNFα by NK cells is important in the maturation of dendritic cells whose antigen presenting function is needed in the immune response (Andoniou et al., 2008).
The butyltins, (BTs) tributyltin (TBT) and dibutyltin (DBT), have been used in a wide variety of industrial applications including as an ingredient in antifouling paints (TBT), as an antifungal agent in a variety of products (TBT), and in the case of DBT as a stabilizer in plastics (Crowe, 1987; Takahashi et al., 1999; Gipperth, 2009; Roper, 1992; Kannan et al., 1995). TBT’s use in marine antifouling paints has been banned since 2008 but it will continue to contaminate the environment for many years due to its chemical stability, non-marine uses, applications to ships prior to the ban, and marine uses in spite of the ban (Gipperth, 2009). TBT is found in fish (Kannan et al., 1995) and DBT is found in drinking water (Sadiki et al., 1996). TBT is found in human blood at levels ranging as high as 261 nM (85 ng/mL) and DBT at levels as high as 300 nM (94 ng/mL) (Whalen et al., 1999; Kannan et al., 1999). TBT-exposed mammals show increased incidences of tumors (Wester et al., 1990) and decreased NK cell function (Ghoneum et al., 1990). We have established that TBT and DBT decrease human NK lytic function, target-binding function, cell-surface protein expression, and cytolytic protein expression at levels that are in the range found in human blood (Whalen et al., 1999; Dudimah et al., 2007a,b ,Whalen et al., 2002; Odman-Ghazi et al., 2003; Thomas et al., 2004; Catlin et al., 2005). A rapid activation of a portion of the signaling pathway(s) that regulates NK lytic function (beginning with protein kinase C through mitogen-activated protein kinases (MAPKs)) accompanies the loss of lytic function (Aluoch and Whalen, 2005; Aluoch et al., 2006; Aluoch et al., 2007; Odman-Ghazi et al., 2010; Abraha et al., 2010).
Although we have found that both TBT and DBT have dramatic effects on the ability of human NK cells to destroy tumor cells we have not previously investigated whether these compounds might also effect the secretion of TNFα by NK cells. TNFα has effects on immune system cells, as well as on other cell types (Goetz et al., 2004), thus, it essential to determine if its secretion by NK cells is also altered by exposures to these compounds.
In this study we examined whether exposures of NK cells to TBT and DBT could alter their secretion of TNFα. In addition to examining the effects of TBT and DBT on the secretion of TNFα by a highly purified preparation of NK cells, we also looked at their effects on a preparation that contained both NK cells and T cells. This is a more reconstituted system which allowed us to examine whether there were differences in the effects of the BTs between the purified NK system and the more complex system of immune cells.
MATERIALS AND METHODS
Preparation of NK cells
Peripheral blood from healthy adult (male and female) volunteer donors was used for this study. Buffy coats (source leukocytes) obtained from Key Biologics, LLC (Memphis, TN) were used to prepare NK cells. Highly purified NK cells were obtained using a rosetting procedure. Buffy coats were mixed with 0.6–0.8 mL of RosetteSep human NK cell enrichment antibody cocktail (StemCell Technologies, Vancouver, British Columbia, Canada) per 45 mL of buffy coat. The mixture was incubated for 25 min at room temperature (~ 25° C). Following the incubation, 7–8 mL of the mixture was layered onto 4 mL of Ficoll-Hypaque (1.077 g/mL) (MP Biomedicals, Irvine, CA) and centrifuged at 1200 g for 30–50 min. The cell layer was collected and washed twice with phosphate buffered saline (PBS) pH 7.2 and stored in complete media (RPMI-1640 supplemented with 10% heat-inactivated bovine calf serum (BCS), 2 mM L-glutamine and 50 U penicillin G with 50 µg streptomycin/ml) at 1 million cells/mL at 37 °C and air/CO2, 19:1.
Preparation of T/NK cells
Preparations of T cells and NK cells were isolated from Leukocyte filters (PALL- RCPL) obtained from the Red Cross Blood Bank Facility (Nashville, TN) as described in Meyer et al., 2005. A unit of blood is put through these filters to remove leukocytes. The leukocytes can be retrieved from the filters by back-flushing them with an elution medium and collecting the eluent. The elution medium is sterile PBS containing 5 mM disodium EDTA and 2.5% [w/v] sucrose. The resulting eluent contains the leukocytes with some red cell contamination. The eluent is layered onto Ficoll-Hypaque (1.077g/mL) and centrifuged as described above. The granulocytes and red cells form a pellet at the bottom of the tube while the lymphocytes and monocytes float on the Ficoll-Hypaque. Mononuclear cells were collected from the Ficoll-Hypaque and washed twice (250 g, 10 min.) with PBS. The pellet was resuspended in PBS and the process was repeated. The cells were then suspended in complete medium which consisted of RPMI-1640 supplemented with 10% heat-inactivated BCS, 2 mM L-glutamine and 50 U penicillin G with 50 µg streptomycin/mL. Non adherent cells (10–20% CD16+, 10–20 % CD56+, 70–80% CD3+, 3–5% CD19+, 2–20% CD14+) were prepared by incubating the cells in glass Petri dishes (150 ×15 mm) at 37 °C and air/CO2, 19:1 for 1 h. This cell preparation is referred to as T/NK cells.
Chemical preparation
TBT and DBT were purchased from (Sigma-Aldrich, St. Louis, MO). TBT was a neat standard, dissolved initially in deionized water to give a 1 mM solution. A DBT stock solution was prepared by dissolving DBT in dimethylsulfoxide (DMSO). Desired concentrations of either TBT or DBT were prepared by dilution of the stock into complete media. The final concentration of DMSO for DBT exposures did not exceed 0.01%. Appropriate DMSO controls were run.
Cell treatments
NK cells or T/NK cells (at a concentration of 1.5 million cells/ mL) were treated with TBT (or appropriate control) at concentrations of 2.5–200 nM for 24 h, 48 h, or 6 days. Cells were treated with DBT at concentrations of 0.05–5 µM for the same lengths of incubation as used with TBT. Following the incubations the cells were pelleted and the supernatants were collected and frozen at −50°C until assay.
Cell viability
Cell viability was assessed at the beginning and end of each exposure period. Viability was determined using the trypan blue exclusion method. Briefly, cells were mixed with trypan blue and counted using a hemocytometer. The total number of cells and the total number of live cells were determined for both control and treated cells to determine the percent viable cells. Results are shown in tables 1 and 2.
Table 1.
Effects of exposures to TBT for 24 h, 48 h, and 6 days on the viability of human NK cells and human T/NK cells.
| Percent viability | ||||||||
|---|---|---|---|---|---|---|---|---|
| Concentration of TBT | ||||||||
| 0 | 2.5 | 5 | 10 | 25 | 50 | 100 | 200 nM | |
| Length of exposure of purified NK cells to TBT | ||||||||
| 24 h | 97±1 | 96±3 | 97±1 | 97±2 | 98±1 | 97±1 | 96±1 | 90± 7 |
| 48 h | 96±1 | 98±1 | 97±2 | 97±2 | 95±3 | 96±2 | 93±3 | 81±6* |
| 6 d | 80±7 | 83±6 | 84±1 | 81±6 | 78±4 | 77±5 | 68±11 | 63±1* |
| Length of exposure of T/NK cells to TBT | ||||||||
| 24 h | 99±1 | 99±1 | 99±1 | 98±1 | 99±1 | 99±1 | 99±1 | 94±3* |
| 48 h | 98±2 | 99±1 | 99±1 | 98±1 | 98±1 | 96±1 | 95±4 | 85±9* |
| 6 d | 91±7 | 91± 8 | 88±10 | 90±5 | 89±8 | 86±7 | 78±10* | 63±13* |
Indicates a significant decrease in viability compared to control cells
Table 2.
Effects of exposures to DBT for 24 h, 48 h, and 6 days on the viability of human NK cells and human T/NK cells.
| Percent viability | ||||||||
|---|---|---|---|---|---|---|---|---|
| Concentration of DBT | ||||||||
| 0 | 0.05 | 0.1 | 0.25 | 0.5 | 1 | 2.5 | 5 µM | |
| Length of exposure of purified NK cells to DBT | ||||||||
| 24 h | 95±4 | 96±4 | 95±5 | 94±6 | 95±4 | 89±8 | 86±8* | 84± 8* |
| 48 h | 93±7 | 94±6 | 92±9 | 92±4 | 89±7 | 75±12* | 64±5* | 63±12* |
| 6 d | 84±6 | 80±6 | 84±10 | 76±12 | 68±5* | 69±6* | 65±14 | 66±4* |
| Length of exposure of T/NK cells to DBT | ||||||||
| 24 h | 97±3 | 98±3 | 98±3 | 97±2 | 98±3 | 93±7 | 86±7* | 86±8* |
| 48 h | 98±2 | 97±3 | 97±1 | 97±3 | 95±6 | 86±6* | 74±6* | 75±4* |
| 6 d | 94±4 | 92±5 | 93±8 | 89±7 | 76±3* | 63±9* | 60±7* | 60±12* |
Indicates a significant decrease in viability compared to control cells
TNFα secretion assay
Supernatants from cells (exposed as described above) were collected and stored at −50°C until being assayed for TNFα levels. TNFα levels were measured using the OptEIA™ enzyme-linked immunosorbent assay (ELISA) human TNFα kit (BD-Pharmingen, San Diego, CA). A 96 well flat-bottom microwell plate specifically designed for ELISA (Fisher, St.Louis MO) was coated with capture antibody diluted in coating buffer. The plate was incubated with the capture antibody overnight at 4°C. Following this incubation the plate was washed three times with wash buffer (PBS with 0.05% Tween-20). Blocking buffer was then applied to each well and the plate was sealed and incubated at room temperature for 1 h. The plate was then washed three times and cell supernatants and TNFα standards were applied to the wells and the plate was sealed and incubated at room temperature for 2 h. Following the incubation with samples and standards the plate was washed five times and detection antibody was then added to the wells and incubated for 1 h at room temperature. Detection antibody was removed by washing 7 times and a substrate solution was added to each well and incubated for 30 min at room temperature. The absorbance was measured at 450 nm on a Thermo Labsystems Multiskan MCC/340 plate reader (Fisher Scientific).
Statistical analysis
Statistical analysis of the data was carried out utilizing ANOVA and Student's t test. Data were initially compared within a given experimental setup by ANOVA. A significant ANOVA was followed by pair wise analysis of control versus exposed data using Student’s t test, a p value of less than 0.05 was considered significant.
RESULTS
Viability of NK cells exposed to TBT
Table 1 shows that when NK cells were exposed to 2.5–200 nM TBT for 24 h there was no effect on the viability of the cells as compared to control NK cells. This indicated that there was not a generalized toxicity of the compound on the cells. A 48 h exposure to these same concentrations caused a small decrease in viability it at 200 nM TBT (~15%), while all other concentrations of TBT caused no decrease in viability. A 6 day exposure to 200 nM TBT also caused some decrease in viability as compared to control cells however no other concentrations affected viability.
Effects of TBT exposures on secretion of TNFα by NK cells
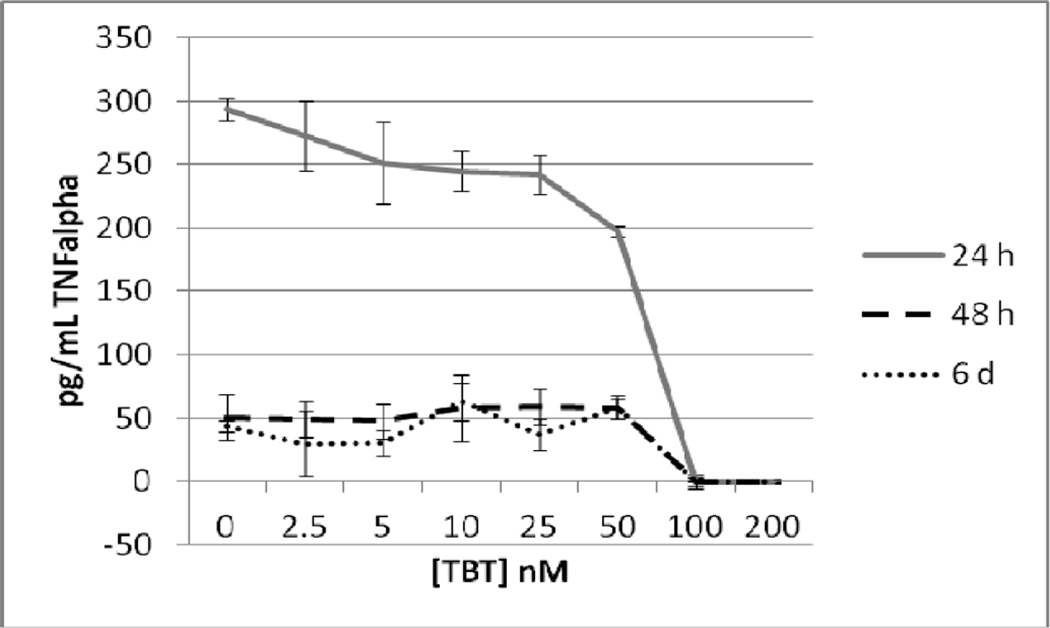
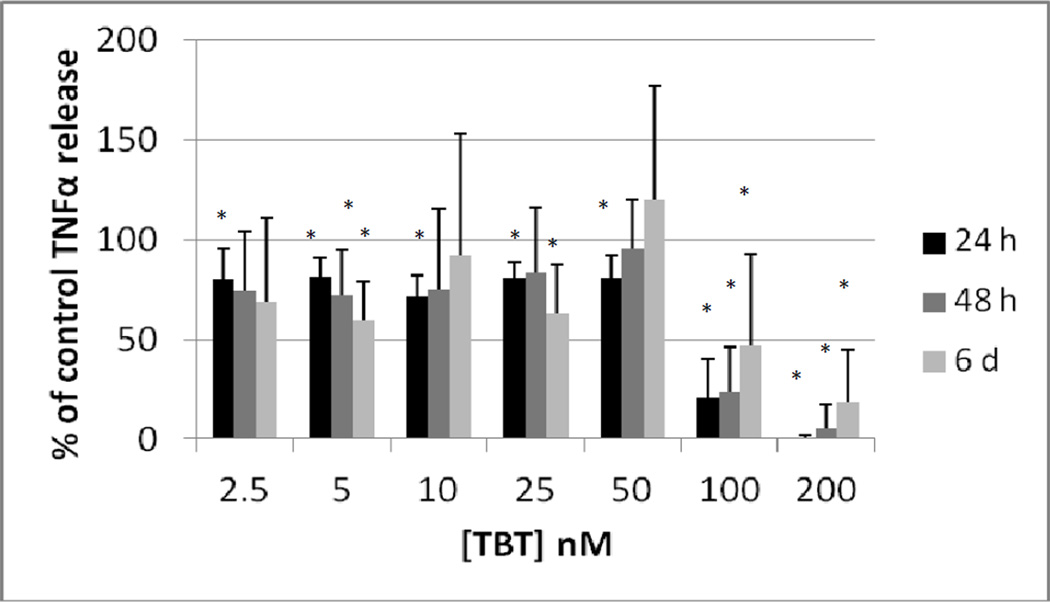
Highly purified NK cells were exposed to 0, 2.5, 5, 10, 25, 50, 100 and 200 nM TBT for 24 h, 48 h, and 6 days. Following the exposures the supernatants from the cell suspension were collected and TNFα levels were measure. A minimum of 3 different cell preparations from different donors were used for each time point. Figure 1 shows the effects of these exposures in cells prepared from an individual donor. The data indicate that after a 24 h exposure to TBT there was a significant decrease (p<0.05) in TNFα secretion at all of the concentrations tested except 2.5 nM. The longer incubations of 48 h and 6 d showed statistically significant decreases in TNFα secretion only at the 2 highest concentrations of 100 and 200 nM for NK cells from this donor. In order to combine data from different donors, the secretion of TNFα in the treated cells were normalized to their respective control cells. The data is presented then as percent of control secretion of TNF α. Figure 2 shows that when experiments from different donors were combined that there was a significant decrease in TNFα secretion at every concentration of TBT when NK cells were exposed for 24h. Exposures to TBT for 48 h or 6 d caused significant decreased in TNFα secretion only at the 2 highest concentrations of TBT as was seen when looking at data from NK cells from an individual donor.
Figure 1.
Secretion of TNFα in pg/mL from purified human NK cells from an individual donor exposed to tributyltin for 24h, 48 h, and 6 days. NK cells were exposed to concentrations of TBT of 0, 2.5,5, 10, 25, 50, 100, and 200 nM for 24 h, 48, h or 6 days. Data are the secretion of TNFα in pg/mL from the cells of an individual donor. Each sample was tested in triplicate (n=3). Values are mean±S.D at each concentration for each length of incubation.
Figure 2.
Secretion of TNFα (as percent of control) from purified human NK cells exposed to tributyltin for 24h, 48 h, and 6 days. Concentrations of TBT were the same as in Figure 1. Data were combined from NK cells from a minimum of 3 different donors (n=9). In order to combine data from different donors, the secretion of TNFα in the treated cells were normalized to their respective control cells. The data is presented as percent of control secretion of TNF α. Values are mean±S.D., * indicates a significant difference from control values (control arbitrarily = 100%), p<0.05.
Viability of T/NK cells exposed to TBT
When T/NK cells were exposed to TBT for 24 h there was a very small effect of the 200 nM concentration on viability (Table 1). Viability was decreased from 99% in the control to 94% in the cells treated with 200 nM TBT. There was also a decrease in viability with the 200 nM TBT exposure after 48 h. 6 day exposures to both 200 and 100 nM TBT caused a decrease in T/NK cell viability (however the majority of cells were viable in both cases) (Table 1).
Effects of TBT exposures on secretion of TNFα by T/NK cells
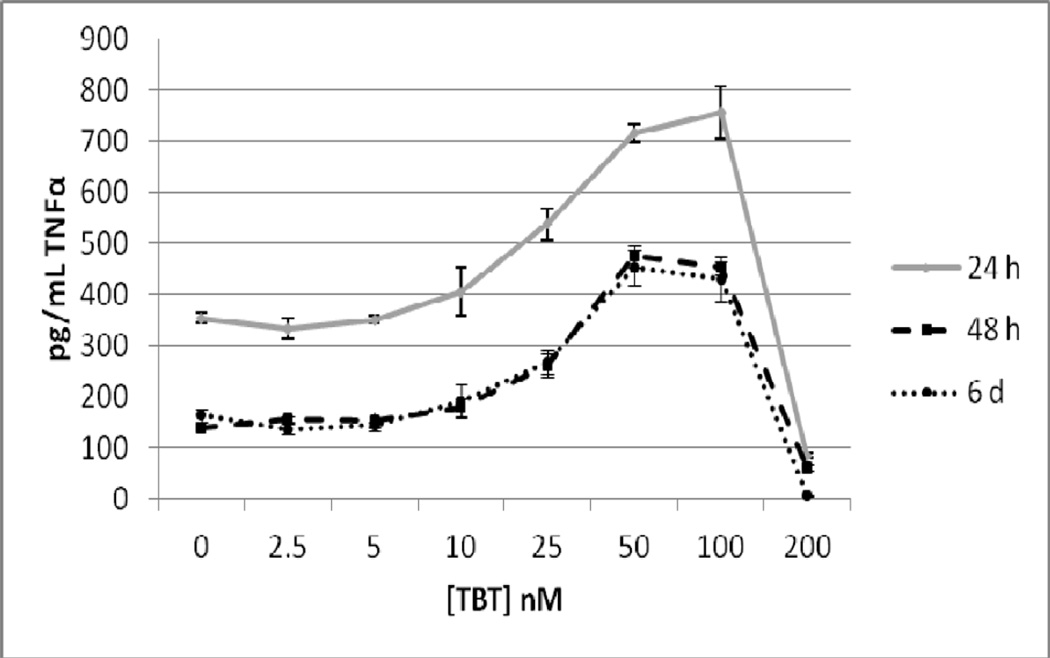
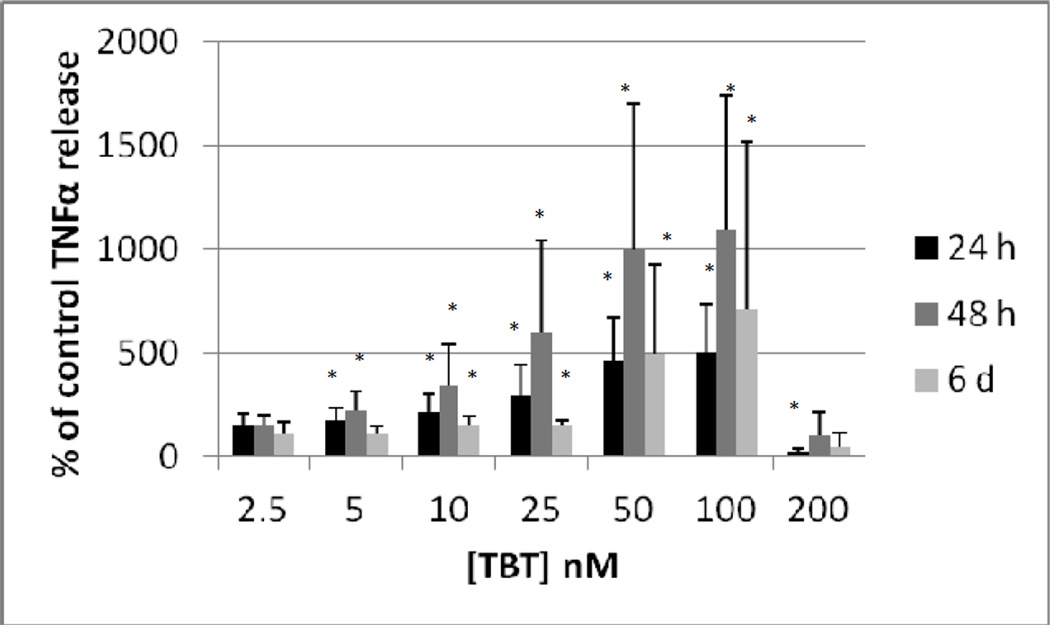
As T cells are also able to secrete TNFα, we examined whether their presence in the cell preparation would alter the effects of TBT on TNFα secretion from that seen with purified NK cells. Although we refer to this preparation as T/NK cells there were also some monocytes in the preparation (although they had been significantly depleted). The T/NK cell preparation was treated with 2.5, 5, 10, 25, 50, 100 and 200 nM TBT for 24 h, 48 h, and 6 days and TNFα levels in the supernatants from these incubations were measured. The data from cells prepared from an individual donor are shown in Figure 3. As was seen with the purified NK cells, exposure to 200 nM TBT for 24 h caused a nearly complete loss of TNFα secretion. However, a 24 h exposure to 25, 50, and 100 nM TBT caused significant increases in TNFα secretion as compared to the control cells. The greatest increase (2.16 fold) was seen with a 100 nM TBT exposure. A 48 h exposure to TBT also caused an essentially compete block of TNFα secretion from T/NK cells. Exposure from 5 –100 nM caused significant increases in the secretion of TNFα from the T/NK cell preparation. A 48 h exposure to 50 nM TBT caused the greatest fold increase (3.4 fold) above control cells. The effect of 6 d exposures to TBT in the cells from this donor looked very similar to what was seen at 48 h (Figure 3). The effects on TNFα secretion seen when the data from all donors was combined (as described above) is shown in Figure 4. As was seen with the purified NK cells an exposure to 200 nM TBT for 24 h decreased the secretion of TNFα from the T/NK cells almost completely. However, concentrations of TBT from 10 to 100 mM all caused significant increases in secretion of TNFα when data was combined as compared with the effects seen in cells from an individual donor where 25 nM was the lowest concentration to cause a significant increase. The greatest increase was seen at 100 nM in the combined data as was true in the data from an individual, however the average fold increase was somewhat higher at 3.5 fold (Figure 4). When data from all experiments were combined the 48 h exposures to TBT showed increases at 5 to 100 nM (Figure 4). Unlike the 24 h exposures there was no significant decrease at the 200 nM exposure, this was due to the large variability of the results from cells isolated from different donors. The greatest average increase in TNFα secretion seen at 48 h in the combined data was also at the 100 nM concentration (average of 7.6 fold). Again, there was a large amount of variation from one donor to the next under this condition, with the lowest increase being 3 fold and the highest increase 18 fold. Result of the combined experiments after a 6 d exposure were similar to those seen at 48 h only the fold increases were considerably lower that they were at 48 h (Figure 4).
Figure 3.
Secretion of TNFα in pg/mL from a mixture of human T and NK cells from an individual donor exposed to tributyltin for 24h, 48 h, and 6 days. NK cells were exposed to concentrations of TBT of 0, 2.5,5, 10, 25, 50, 100, and 200 nM for 24 h, 48, h or 6 days. Data are the secretion of TNFα in pg/mL from the cells of an individual donor. Each sample was tested in triplicate (n=3). Values are mean±S.D at each concentration for each length of incubation.
Figure 4.
Secretion of TNFα (as percent of control) from a mixture of human T and NK cells exposed to tributyltin for 24h, 48 h, and 6 days. Concentrations of TBT were the same as in Figure 3. Data were combined from NK cells from a minimum of 3 different donors (n=9). In order to combine data from different donors, the secretion of TNFα in the treated cells were normalized to their respective control cells. The data is presented as percent of control secretion of TNF α. Values are mean±S.D., * indicates a significant difference from control values (control arbitrarily = 100%), p<0.05.
Viability of NK cells exposed to DBT
NK cells exposed to DBT for 24 h showed decreased viability compared to control cells at the 5 and 2.5 µM concentrations. The decreases were small with the 5 µM DBT showing 84% viability while control cells were 95% viable. Cells exposed to 2.5 µM DBT for 24 h were 86% viable as compared to controls (95%) (Table 2). Viability of NK cells exposed to 5, 2.5, 1, and 0.5 µM DBT for both 48 h and 6 days was somewhat decreased as compared to controls (Table 2).
Effects of DBT exposures on secretion of TNFα by NK cells
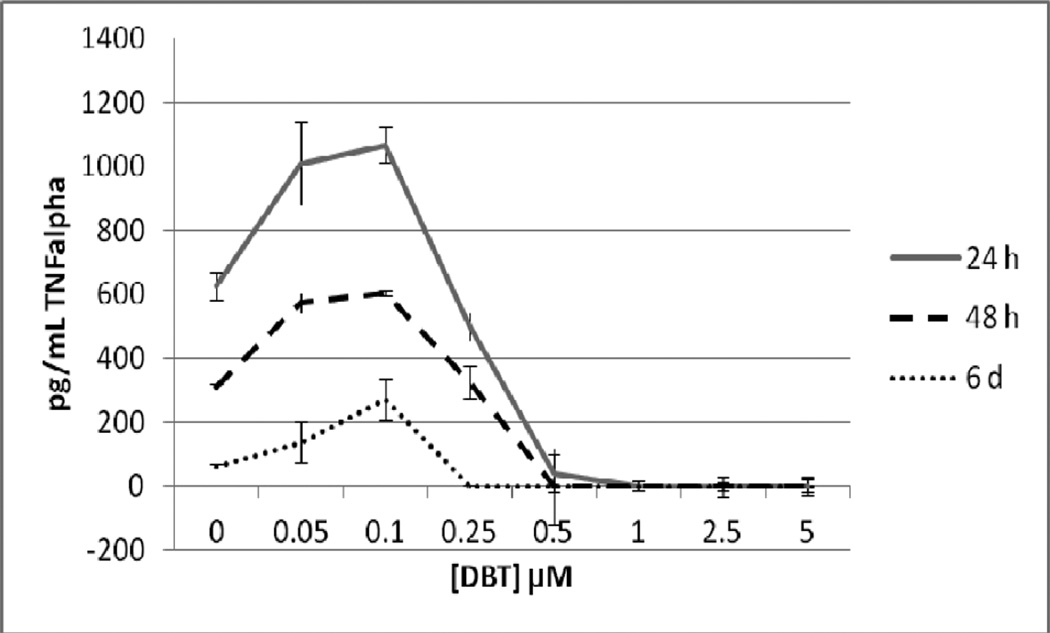
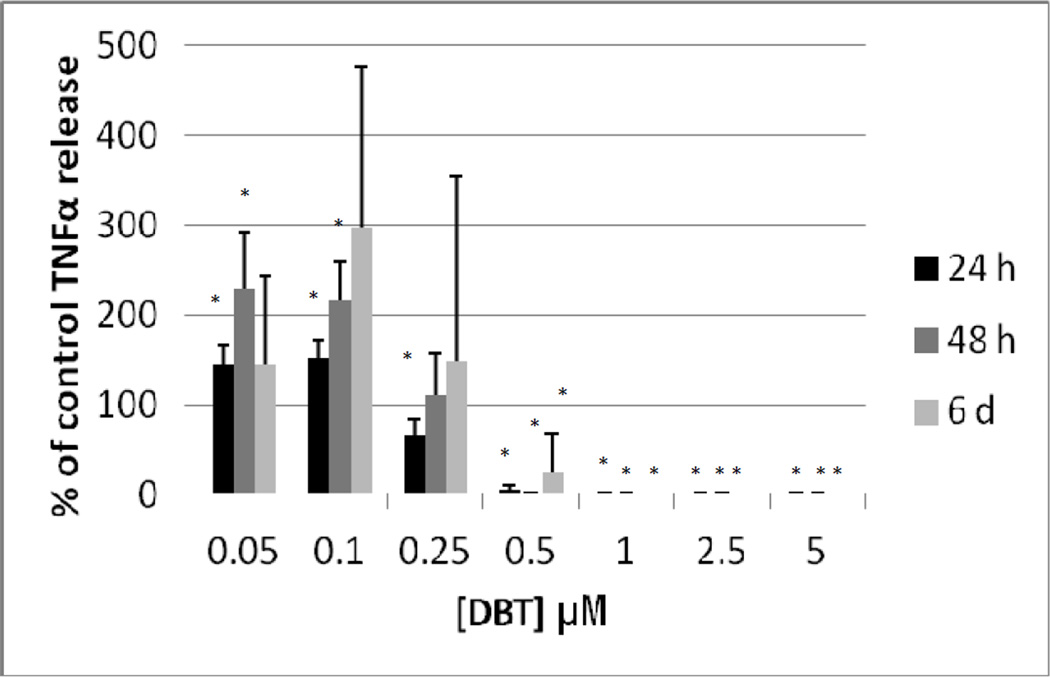
Figure 5 shows the effects of exposures to 0, 0.05, 0.1, 0.25, 0.5, 1, 2.5, and 5 µM DBT for 24 h, 48 h, and 6 d on highly purified NK cells prepared from an individual donor. After a 24 h exposure to DBT there was a complete loss of TNFα secretion at 0.5 to 5 µM DBT exposures (P<0.05). There was also a significant decrease of about 20% at the 0.25 µM exposure. The lower concentrations of DBT 0.05 and 0.1µM each caused an increase in secretion of TNFα as compared to control cell after a 24 h exposure (1.6 and 1.7 fold, respectively) (Figure 5). 48 h exposures to 0.5 to 5 µM DBT caused a total loss of TNFα secretion from highly purified NK cells from this individual. Exposure to 0.25 µM DBT caused no significant change in TNFα secretion while 0.05 and 0.1 µM DBT caused increases in TNFα secretion of 1.8 and 1.9 fold, respectively (Figure 5). Exposure to 0.25 to 5 µM DBT for 6 d completely blocked TNFα secretion in the NK cells from this donor while 0.1 µM DBT caused an approximately 4 fold increase in secretion and 0.05 µM caused no significant change as compared to the control cells (Figure 5). As described above, data from different donors was combined by normalizing the secretion seen at each of the treatments to their respective control cells and then combining the data as percent of control secretion of TNFα. Figure 6 shows that when experiments from different donors were combined that the decreases were similar to those seen in the individual experiment for cells exposed to DBT for 24h. Exposures to DBT for 48 h caused a total block in TNFα secretion at 0.5 to 5 µM and significant increases at 0.1 and 0.05 µM DBT. These increases averaged around 2 fold (Figure 6), which was similar to the increase seen in the individual experiment (Figure 5). 6 d exposures to DBT in the combined experiments showed the same general trends as were seen with the individual experiment but with a much larger variability (Figure 6).
Figure 5.
Secretion of TNFα in pg/mL from purified human NK cells from an individual donor exposed to dibutyltin for 24h, 48 h, and 6 days. NK cells were exposed to concentrations of DBT of 0, 0.05, 0.1, 0.25, 0.5, 1, 2.5 and 5 µM for 24 h, 48, h or 6 days. Data are the secretion of TNFα in pg/mL from the cells of an individual donor. Each sample was tested in triplicate (n=3). Values are mean±S.D at each concentration for each length of incubation.
Figure 6.
Secretion of TNFα (as percent of control) from purified human NK cells exposed to dibutyltin for 24h, 48 h, and 6 days. Concentrations of DBT were the same as in Figure 5. Data were combined from NK cells from a minimum of 3 different donors (n=9). In order to combine data from different donors, the secretion of TNFα in the treated cells were normalized to their respective control cells. The data is presented as percent of control secretion of TNF α. Values are mean±S.D., * indicates a significant difference from control values (control arbitrarily = 100%), p<0.05.
Viability of T/NK cells exposed to DBT
Table 2 shows the effects of 5–0.05 µM DBT exposures for 24 h, 48 h, and 6 days on the viability of T/NK cells. The results for TNK cells were very similar to those seen with highly purified NK cells (Table 2).
Effects of DBT exposures on secretion of TNFα by T/NK cells
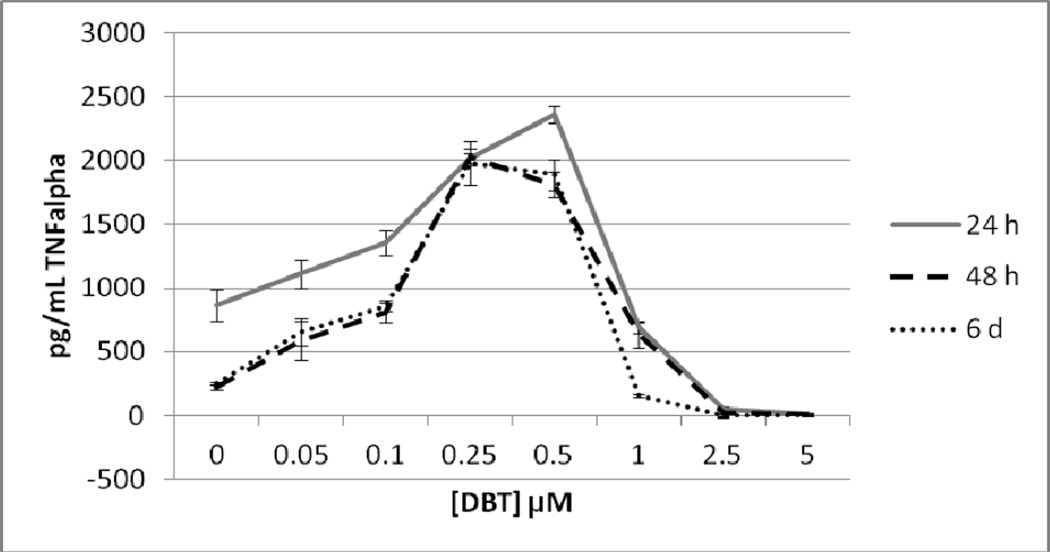
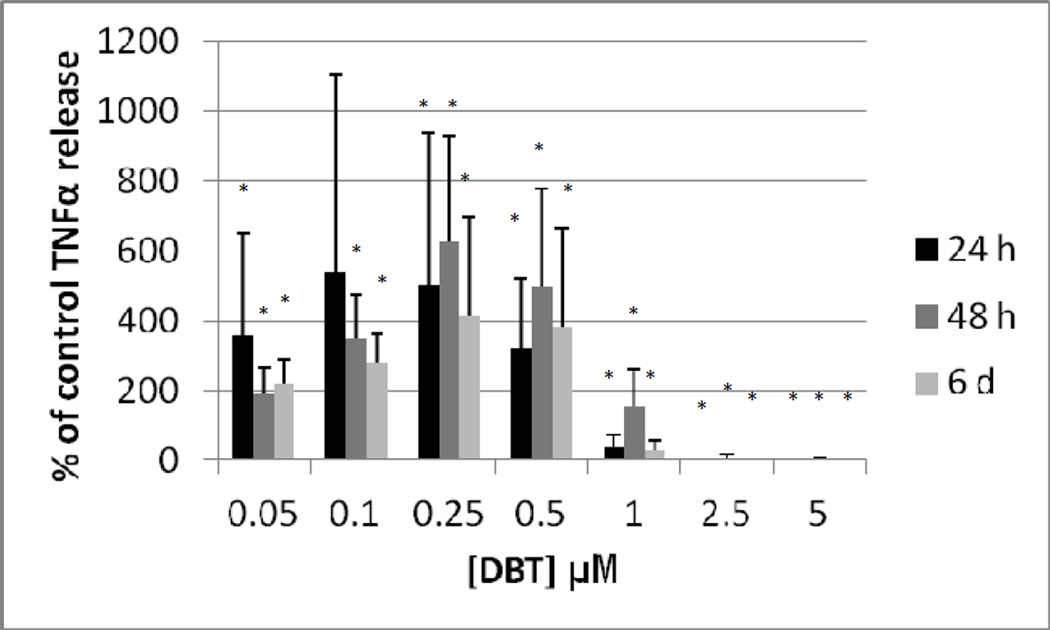
Figure 7 shows the effects of exposures to 0, 0.05, 0.1, 0.25, 0.5, 1, 2.5, and 5 µM DBT for 24 h, 48 h, and 6 d on T/NK cells prepared from an individual donor. A 24 h exposure to DBT caused a complete loss of TNFα secretion at 2.5 and 5 µM DBT exposures (P<0.01). Concentrations of DBT 0.1, 0.25, and 0.5µM each caused an increase in secretion of TNFα as compared to control cells after a 24 h exposure (1.6 fold at 0.1 µM; 2.3 fold at 0.25 µM and 2.7 fold at 0.5 µM, p<0.01 for all values) (Figure 7). 48 h exposures to 2.5 and 5 µM DBT caused an essentially total loss of TNFα secretion from T/NK cells in this individual. In contrast, exposures to 0.05 up to 1 µM DBT each caused significant increases in TNFα secretion. The fold increases were as follows: 2.7 fold at 0.05 µM (p<0.05) ; 3.6 fold at 0.1 µM (p<0.01); 9.2 fold (p<0.01) at 0.25 µM; 8.2 fold at 0.5 µM (p<0.01) and 2.9 fold at 1 µM (p<0.02) (Figure 7). A 6 day exposure to 2.5 to 5 µM DBT for 6 d completely blocked TNFα secretion in the T/NK cells from this donor while 1 µM DBT caused a 38% decrease in secretion (p<0.001 in all cases) (Figure 7). Exposure to 0.05 µM DBT increased secretion of TNFα by 2.6 fold (p<0.05), 0.1, 0.25, and 0.5 µM DBT caused increases of 3.4, 7.9, and 7.6 fold, respectively (p<0.01) (Figure 7). Figure 8 shows that when experiments from different donors were combined that the decreases were similar to those seen in the individual experiment for cells exposed to 2.5 and 5 µM DBT at each of the lengths of exposure. The increases in TNFα secretion seen with exposures to 0.05 up to 0.5 µM DBT in the individual were also seen in all other donors although the magnitude of the increase varied among donors (Figure 8).
Figure 7.
Secretion of TNFα in pg/mL from a mixture of human T and NK cells from an individual donor exposed to dibutyltin for 24h, 48 h, and 6 days. NK cells were exposed to concentrations of DBT of 0, 0.05, 0.1, 0.25, 0.5, 1, 2.5 and 5 µM for 24 h, 48, h or 6 days. Data are the secretion of TNFα in pg/mL from the cells of an individual donor. Each sample was tested in triplicate (n=3). Values are mean±S.D at each concentration for each length of incubation.
Figure 8.
Secretion of TNFα (as percent of control) from a mixture of human T and NK cells exposed to dibutyltin for 24h, 48 h, and 6 days. Concentrations of DBT were the same as in Figure 5. Data were combined from NK cells from a minimum of 3 different donors (n=9). In order to combine data from different donors, the secretion of TNFα in the treated cells were normalized to their respective control cells. The data is presented as percent of control secretion of TNF α. Values are mean±S.D., * indicates a significant difference from control values (control arbitrarily = 100%), p<0.05.
DISCUSSION
TNFα is an inflammatory cytokine and contributes to many of the negative effects seen with chronic inflammation. Elevated levels of TNFα are associated with rheumatoid arthritis, Crohn’s disease and the wasting seen with cancer (Shurety et al., 2000). TNFα is produced by NK cells, T cells, and monocytes (Goetz et al., 2004). In monocytes, TNFα stimulates their cytotoxicity against targets as well as their ability to synthesize more TNFα (Philip et al., 1986). As mentioned in the introduction, TNFα is synthesized as a 26 kD transmembrane protein that is then released from the membrane as a 17kD protein (Goetz et al., 2004). Release from the membrane is catalyzed by membrane-associated metalloproteinases such as TNFα converting enzyme (TACE) (Black, R.A., et al., 1997). TNFα also effects lipid metabolism (Chen et al., 2009) and may have a significant role in insulin resistance seen in obesity (Goetz et al., 2004).
Due to its importance in regulating both immune and other cellular functions, it is important to determine whether environmental contaminants, especially those found in human blood and tissues such as the BTs (Whalen et al., 1999; Kannan et al., 1999), are able to effect the secretion of this potent regulator. Thus, the current study examines the effects of both TBT and DBT on the ability of immune system cells to secrete TNFα.
The effects of both BTs (TBT and DBT) differed depending on the cell population tested. When highly purified NK cells were exposed to TBT for 24 h there was a decrease in their ability to secrete TNFα at every concentration tested and this decrease was not due to a generalized toxicity of TBT as cell viability was unaffected by the TBT exposures (Table 1). Concentrations as low as 2.5 nM caused on average a 20% decrease in secretion and this was seen at levels of TBT of 50-5 nM as well. This same general pattern of effect on TNFα secretion maintained out to 6 days of exposure to TBT (Figure 2). When a cell preparation that was primarily T and NK cells (T/NK cells) was exposed to TBT for 24 h, a markedly different effect on TNFα secretion was seen (Figure 4). There was a decrease in secretion of TNFα at the 200 nM exposure to TBT, but there was a significant increase in TNFα at 5–100 nM exposures to TBT. The increases averaged about 5 fold at the 50 and 100 nM exposures to TBT, 3 fold at 25 nM, and 2 fold at both 5 and 10 nM. The concentrations of TBT that dysregulate TNFα secretion in both purified NK cells and in T/NK cells are well below concentrations of TBT that have been found in some human blood samples (Whalen et al., 1999; Kannan et al., 1999). Levels detected in human blood ranged from undetectable to about 260 nM, with 69% of the 38 samples tested showing levels of 10 nM and above. Here we see decreases in TNFα secretion of 20% at 10 nM TBT from NK cells and increases of 2 fold in secretion from T/NK cells. Thus, the effects on TNFα secretion seen in these studies have implications for individuals exposed to TBT. Decreases in TNFα secretion seen in TBT-exposed purified NK cells indicates the potential for a deficit in NK-mediated signaling to other immune cells in TBT-exposed individuals, such as the maturation of dendritic cells whose antigen presenting function is needed in the immune response (Andoniou et al., 2008). Increases in TNFα secretion as were seen when T cells are present suggests that TBT has the capacity to aberrantly stimulate the inflammatory response. Inappropriate increases in inflammatory factors such as TNFα lead to a number of diseases including rheumatoid arthritis, Crohn’s disease, insulin resistance, and cancer (Shurety et al., 2000; Chen et al., 2009; Grivennikov and Karin, 2012).
Exposure of purified NK cells to DBT for 24 h caused a nearly complete block of TNFα secretion when the concentrations of DBT were 0.5 to 5 µM. Although there was a small decrease in NK cell viability at the 2.5 and 5 µM exposures (Table 2) the decrease was not large enough to account for the complete loss of TNFα secretion seen at these exposures. Further, a complete block of TNFα secretion was seen at the 0.5 and 1 µM DBT with no decrease in cell viability (Table 2). Thus, decreases in TNFα secretion seen at 24 h were not due to a generalized toxicity of DBT. Exposure to 0.25 µM DBT caused significant decreases in TNFα secretion which was averaged 35%. In contrast to TBT, exposures of purified NK cells to 0.05 and 0.1 µM DBT for 24 h caused significant increases in TNFα secretion (1.4 and 1.5 fold, respectively). Exposures of purified NK cells to 0.5 to 5 µM DBT for 48 h prevented secretion of TNFα, while exposures to 0.05 and 0.1 µM DBT increased secretion (0.05 µM averaged 2.3 fold, 0.1 µM averaged 2.2 fold). The pattern of TNFα secretion after 6 day exposures to DBT was similar to that seen at the other lengths of exposure except that no significant increases were seen with exposures of 0.05 and 0.1 µM DBT. When T/NK cells were exposed to DBT at the same concentrations there was an increase in TNFα secretion in response to 0.05 (on average 3.5 fold after 24 h), 0.1 (on average 5.3 fold, after 24 h), 0.25 (on average 5.0 fold, 24 h), and 0.5 µM DBT (on average3.2 fold) while highly purified NK cells only showed increases (which were much smaller) at the 0.05 and 0.1 concentrations of DBT. DBT levels measured in human blood range from undetectable to 0.310 µM (Whalen et al., 1999; Kannan et al., 1999). Of the 38 individuals examined 79% had levels at 0.01 µM or above with 34% having levels of 0.025–0.31 µM. We saw very significant increases in TNFα secretion from T/NK cells in this concentration range. Thus, as with TBT, very significant increases of TNFα secretion are occurring at levels of DBT that are found in a significant proportion of human blood samples. Again, these increases in TNFα secretion could increase the incidence of inappropriate inflammation in DBT-exposed individuals, which could result in the diseases mentioned above in the discussion of TBT elevations of TNFα secretion. Thus, the current data have implications for the effect of demonstrated DBT exposures on human health.
The current study indicates that both BTs have very significant effects on TNFα from human white blood cells. They show that these contaminants are able to both block and stimulate the secretion of TNFα and that this is dependent on the composition of the cell population being tested. TBT caused decreased secretion of TNFα when a highly enriched population of NK cells was tested while DBT decreased secretion at higher concentrations and increased it at lower concentrations in this cell preparation. Both BTs were able to stimulate secretion of TNFα at certain levels in a more complex mixture of cells (which was predominantly T cells and NK cells). The results indicate the other cell types have a response to BT exposures that is distinct from that of the NK cells. It will be important to further investigate the mechanisms of regulation of TNFα secretion in both the NK cells and T cells (and possibly monocytes) in future studies.
In our previous studies of the effect of BTs on NK cells, we have shown that both TBT and DBT are able to activate mitogen-activated protein kinases (Aluoch and Whalen, 2005; Aluoch et al., 2006; Aluoch et al., 2007; Odman-Ghazi et al., 2010). Both ERK1/2 and p38 have been shown to be activated by BTs (Aluoch and Whalen, 2005; Aluoch et al., 2006; Aluoch et al., 2007; Odman-Ghazi et al., 2010). p38 activation has been shown to stabilize TNF mRNA in myeloid cells (Mahtani et al., 2001) and to increase TNFα mRNA translation in murine dendritic cells (Gais et al., 2010). Thus, it is possible that a part of the mechanism by which BTs are increasing TNFα secretion is due to their effect on p38 activation. Activation of ERK1/2 (p44/42) has also been shown to play a role in secretion of TNFα from rat Kupffer cells (Cubero, F.J., Nieto, N. 2012)
The current study shows that secretion of TNFα is altered by BT exposures. It will be important to determine whether this effect is on secretion only or also on production of the TNFα protein by the immune cells. It has been shown in a murine macrophage cell line that TBT exposures increased the levels of TNF alpha mRNA (Nakano et al. 2004). Additionally, TBT could be effecting the function of membrane metalloproteinases such as TACE which will also need to be examined in the future.
Acknowledgement
T. Hurd-Brown was supported by 1U54CA163066-01 from the National Institutes of Health
REFERENCES
- Abraha A, Rana K, Whalen MM. Role of protein kinase C in the TBT-induced inhibition of lytic function and MAPK activation in human natural killer cells. Arch. Environ. Cont. Toxicol. 2010;59:661–669. doi: 10.1007/s00244-010-9520-7. [DOI] [PMC free article] [PubMed] [Google Scholar]
- Aluoch A, Whalen MM. Tributyltin-induced effects on MAP kinases p38 and p44/42 in human natural killer cells. Toxicology. 2005;209:263–277. doi: 10.1016/j.tox.2004.12.034. [DOI] [PubMed] [Google Scholar]
- Aluoch AO, Odman-Ghazi SO, Whalen MM. Alteration of an essential NK cell signaling pathway by low doses of tributyltin in human natural killer cells. Toxicology. 2006;224:229–237. doi: 10.1016/j.tox.2006.05.002. [DOI] [PubMed] [Google Scholar]
- Aluoch AO, Odman-Ghazi SO, Whalen MM. Pattern of MAP kinases p44/42 and JNK activation by non-lethal doses of tributyltin in human natural killer cells. Arch. Toxicol. 2007;81:271–277. doi: 10.1007/s00204-006-0155-4. [DOI] [PubMed] [Google Scholar]
- Andoniou CE, Coudert JD, Degli-Esposti MA. Cross talk between NK cells and adaptive immune cells. Killers and beyond: NK-cell-mediated control of immune responses. Eur. J. Immunol. 2008;38:2927–2968. doi: 10.1002/eji.200838882. [DOI] [PubMed] [Google Scholar]
- Ballas ZK, Turner JM, Turner DA, Goetzman EA, Kemp JD. A patient with simultaneous absence of “classical”- natural killer cells (CD3−, CD16+, and NKH1+) and expansion of CD3+, CD4−, CD8−, NKH1+ subset. J. Allergy Clin. Immunol. 1990;85:453–459. doi: 10.1016/0091-6749(90)90155-w. [DOI] [PubMed] [Google Scholar]
- Biron CA, Byron KS, Sullivan JL. Severe herpes virus in an adolescent without natural killer cells. New Engl. J. Med. 1989;320:1731–1735. doi: 10.1056/NEJM198906293202605. [DOI] [PubMed] [Google Scholar]
- Black RA, Rauch CT, Kozlosky CJ, Peshcon JJ, Slack JL, Wolfson MF, Castner BJ, Stocking KL, Reddy P, Srinivasan S, Nelson N, Boiani N, Schooley KA, Gerhart M, Davis R, Fitzner JN, Johnson RS, Paxton RJ, March CJ, Cerretti DP. A metalloproteinase disintegrin that releases tumor necrosis factor-α from cells. Nature. 1997;385:729–733. doi: 10.1038/385729a0. [DOI] [PubMed] [Google Scholar]
- Catlin R, Shah H, Bankhurst AD, Whalen MM. Dibutyltin exposure decreases granzyme B and perforin in human natural killer cells. Environmental Toxicology and Pharmacology. 2005;20:395–403. doi: 10.1016/j.etap.2005.03.012. [DOI] [PubMed] [Google Scholar]
- Chen X, Xun K, Chen L, Wang Y. TNF-alpha, a potent lipid metabolism regulator. Cell. Biochem. Funct. 2009;27:407–416. doi: 10.1002/cbf.1596. [DOI] [PubMed] [Google Scholar]
- Crowe AJ. Organotin compounds in agriculture since 1980. Part 1. Fungicidal, bactericidal and herbicidal properties. Appl. Organomet. Chem. 1987;1:143–155. [Google Scholar]
- Cubero FJ, Nieto N. Arachidonic acid stimulates TNFα production in Kupffer cells via a reactive oxygen species-pERK1/2-Egr-1-dependent mechanism. Am. J. Physiol. Gastrointest Liver Physiol. 2012 Apr 26; doi: 10.1152/ajpgi.00465.2011. (epub ahead of print) [DOI] [PMC free article] [PubMed] [Google Scholar]
- Dudimah FD, Odman-Ghazi SO, Hatcher F, Whalen MM. Effect of Tributyltin (TBT) on the ATP levels in human natural killer cells: Relationship to TBT- induced decreases in NK function. J. Appl. Toxicol. 2007a;27:86–94. doi: 10.1002/jat.1202. [DOI] [PubMed] [Google Scholar]
- Dudimah FD, Gibson C, Whalen MM. Effect of Dibutyltin (DBT) on ATP levels in human natural killer cells. Environ. Toxicol. 2007b;22:117–123. doi: 10.1002/tox.20252. [DOI] [PubMed] [Google Scholar]
- Fleisher G, Koven N, Kamiya H, Henle W. A non-X-linked syndrome with susceptibility to severe Epstein-Bar virus infections. J. Pediatr. 1982;100:727–730. doi: 10.1016/s0022-3476(82)80572-6. [DOI] [PubMed] [Google Scholar]
- Fulton A, Heppner G, Roi L, Howard L, Russo J, Brennan M. Relationship of natural killer cytotoxicity to clinical and biochemical parameters of primary human breast cancer. Breast Cancer Res. Treat. 1984;4:109–116. doi: 10.1007/BF01806393. [DOI] [PubMed] [Google Scholar]
- Gais P, Tiedje C, Altmayr F, Gaestel M, Weighardt H, Holzmann B. TRIF signaling stimulates translation of TNF-alpha mRNA via prolonged activation of MK2. J. Immunol. 2010;184:5842–5848. doi: 10.4049/jimmunol.0902456. [DOI] [PubMed] [Google Scholar]
- Ghoneum M, Hussein AE, Gill G, Alfred LJ. Suppression of murine natural killer cell activity by tributyltin: In vivo and in vitro assessment. Environ. Res. 1990;52:178–186. doi: 10.1016/s0013-9351(05)80252-x. [DOI] [PubMed] [Google Scholar]
- Gipperth L. The legal design of the international and European Union ban on tributyltin antifouling paint: Direct and indirect effects. J. Environ. Management. 2009;90:S86–S95. doi: 10.1016/j.jenvman.2008.08.013. [DOI] [PubMed] [Google Scholar]
- Goetz FW, Planas JV, MacKenzie S. Tumor Necrosis Factors. Develop. and Comp. Immunol. 2004;28:487–497. doi: 10.1016/j.dci.2003.09.008. [DOI] [PubMed] [Google Scholar]
- Grivennikov SI, Karin M. Inflammatory cytokines in cancer: tumor necrosis factor and interleukin 6 take the stage. Ann. Rheum. Dis. 2011;70(Suppl.1):i104–i108. doi: 10.1136/ard.2010.140145. [DOI] [PubMed] [Google Scholar]
- Guicciardi ME, Gores GJ. Life and death by death receptors. FASEB J. 2009;23:1625–1637. doi: 10.1096/fj.08-111005. [DOI] [PMC free article] [PubMed] [Google Scholar]
- Hanna N. Expression of metastatic potential of tumor cells in young nude mice is correlated with low levels of natural-killer cell-mediated cytotoxicity. Int. J. Cancer. 1980;26:675–690. doi: 10.1002/ijc.2910260521. [DOI] [PubMed] [Google Scholar]
- Kannan K, Senthilkumar K, Giesy JP. Occurrence of butyltin compounds in human blood. Environ. Sci. Technol. 1999;33:1776–1779. [Google Scholar]
- Kannan K, Tanabe S, Tatsukawa R. Occurrence of butyltin residues in certain foodstuffs. Bull. Environ. Contam. Toxicol. 1995;55:510–516. doi: 10.1007/BF00196029. [DOI] [PubMed] [Google Scholar]
- Kiessling R, Haller O. Natural killer cells in the mouse, an alternative surveillance mechanism? Contemp. Topics Immunobiol. 1978;8:171–201. doi: 10.1007/978-1-4684-0922-2_6. [DOI] [PubMed] [Google Scholar]
- Lanier LL. Up on a tightrope: natural killer cell activation and inhibition. Nature Immunol. 2008;9:495–502. doi: 10.1038/ni1581. [DOI] [PMC free article] [PubMed] [Google Scholar]
- Lotzova E. Definition and function of natural killer cells. Nat. Immunol. 1993;12:177–193. [PubMed] [Google Scholar]
- Macarthur M, Hold GL, El-Omar EM. Inflammation and Cancer II. Role of chronic inflammation and cytokine gene polymorphisms in the pathogenesis of gastrointestinal maliganancy. Am. J. Physiol. Gastrointest. Liver Physiol. 2004;286:G515–G520. doi: 10.1152/ajpgi.00475.2003. [DOI] [PubMed] [Google Scholar]
- Mahtani KR, Brook M, Dean JL, Sully G, Saklatvala J, Clark AR. Mitogen-activated protein kinase p38 controls the expression and posttranslational modification of tristetraprolin, a regulator of tumor necrosis factor alpha mRNA stability. Mol. Cell Biol. 2001;21:6461–6469. doi: 10.1128/MCB.21.9.6461-6469.2001. [DOI] [PMC free article] [PubMed] [Google Scholar]
- Makrigiannis AP, Anderson SK. Regulation of natural killer cell function. Cancer Biol. Ther. 2003;2:610–616. [PubMed] [Google Scholar]
- Meyer TPH, Zehnter I, Hofmann B, Zaisserer J, Burkhart J, Rapp S, Weinauer F, Schmitz J, Illert WE. Filter buffy coats (FBC): A source of peripheral blood leukocytes recovered from leukocyte depletion filters. J. Immunol. Meth. 2005;307:150–166. doi: 10.1016/j.jim.2005.10.004. [DOI] [PubMed] [Google Scholar]
- Mishra R, Chen AT, Welsh RM, Szomolanyi-Tsuda E. NK Cells and γδ T cells mediate resistance to polyomavirus-induced tumors. PLoS Pathogens. 6:1–13. doi: 10.1371/journal.ppat.1000924. e10000924. [DOI] [PMC free article] [PubMed] [Google Scholar]
- Nakano K, Tsunoda M, Konno N. Tributyltin (TBT) increases TNFα mRNA expression and induces apoptosis in the murine macrophage cell line in vitro. Environ. Heath and Prev. Med. 2004;9:266–271. doi: 10.1007/BF02898141. [DOI] [PMC free article] [PubMed] [Google Scholar]
- Odman-Ghazi SO, Hatcher F, Whalen MM. Expression of Functionally Relevant Cell Surface Markers in Dibutyltin-exposed Human Natural Killer Cells. Chemico-Biological Interactions. 2003;146:1–18. doi: 10.1016/s0009-2797(03)00069-3. [DOI] [PubMed] [Google Scholar]
- Odman-Ghazi SO, Abraha A, Isom ET, Whalen MM. Dibutyltin activates MAP kinases in human natural killer cells, in vitro. Cell Biology and Toxicology. 2010;26:469–479. doi: 10.1007/s10565-010-9157-3. PMCID: PMC2892640. [DOI] [PMC free article] [PubMed] [Google Scholar]
- Ortaldo JR, Glenn GM, Young HA, Frey JL. Natural killer (NK) cell lytic dysfunction and putative NK cell receptor expression abnormality in member of a family with chromosome 3p-linked von Hippel-Lindau disease. J. Natl. Cancer Inst. 1992;84:1897–1903. doi: 10.1093/jnci/84.24.1897. [DOI] [PubMed] [Google Scholar]
- Philip R, Epstein LB. Tumor necrosis factor as immunomodulator and mediator of monocyte cytotoxicity induced by itself, gamma-interferron and interleukin-1. Nature. 1986;323:86–89. doi: 10.1038/323086a0. [DOI] [PubMed] [Google Scholar]
- Purdy AK, Campbell KS. Natural killer cells and cancer: regulation by the killer cell Ig-like receptors (KIR) Cancer Biol. Ther. 2009;8:13–22. doi: 10.4161/cbt.8.23.10455. [DOI] [PMC free article] [PubMed] [Google Scholar]
- Roper WL. “Toxicological profile for tin”. U.S department of health and human services, agency for toxic substances and disease registry. 1992 [Google Scholar]
- Sadiki A-I, Williams DT, Carrier R, Thomas B. Pilot study on the contamination of drinking water by organotin compounds from PVC materials. Chemosphere. 1996;32:2389–2398. doi: 10.1016/0045-6535(96)00134-8. [DOI] [PubMed] [Google Scholar]
- Shurety W, Merino-Trigo A, Brown D, Hume DA, Stow JL. Localization and post-golgi trafficking of tumor necrosis factor α in macrophages. J. Interferon and Cytokine Res. 2000;20:427–438. doi: 10.1089/107999000312379. [DOI] [PubMed] [Google Scholar]
- Silke J. The regulation of TNF signaling: what a tangled web we weave. Current Opinion in Immunol. 2011;23:620–626. doi: 10.1016/j.coi.2011.08.002. [DOI] [PubMed] [Google Scholar]
- Takahashi S, Mukai H, Tanabe S, Sakayama K, Miyazaki T, Masuno H. Butyltin residues in the liver of humans and wild terrestrial mammals and in the plastic products. Environ. Pollut. 1999;106:213–218. doi: 10.1016/s0269-7491(99)00068-8. [DOI] [PubMed] [Google Scholar]
- Thomas LD, Shah H, Green SA, Bankhurst AD, Whalen MM. Tributyltin exposure causes decreased granzyme B and perforin levels in human natural killer cells. Toxicology. 2004;200:221–233. doi: 10.1016/j.tox.2004.04.002. [DOI] [PubMed] [Google Scholar]
- Wester PW, Krajnc EI, van Leeuwen FX, Loeber JG, van der Heijden CA, Vaessen HA, Helleman PW. Chronic toxicity and carcinogenicity of bis(tri-n-butyltin)oxide (TBTO) in the rat. Food Chem. Toxicol. 1990;28:179–196. doi: 10.1016/0278-6915(90)90006-9. [DOI] [PubMed] [Google Scholar]
- Whalen MM, Loganathan BG, Kannan K. Immunotoxicity of environmentally relevant concentrations of butyltins on human natural killer (NK) cells in vitro. Environ. Res. 1999;81:108–116. doi: 10.1006/enrs.1999.3968. [DOI] [PubMed] [Google Scholar]
- Whalen MM, Ghazi S, Loganathan BG, Hatcher F. Expression of CD16, CD18 and CD56 in Tributyltin-exposed human natural killer cells. Chemico-Biol. Interact. 2002;139:159–176. doi: 10.1016/s0009-2797(01)00297-6. [DOI] [PubMed] [Google Scholar]


