Abstract
Accurately measuring the volume of tissue damage in experimental lesion models is crucial to adequately control for the extent and location of the lesion, variables that can dramatically bias the outcome of preclinical studies. Many of the current commonly used techniques for this assessment, such as measuring the lesion volume with primitive software macros and plotting the lesion location manually using atlases, are time-consuming and offer limited precision. Here we present an easy to use semi-automated computational method for determining lesion volume and location, designed to increase precision and reduce the manual labor required. We compared this novel method to currently used methods and demonstrate that this tool is comparable or superior to current techniques in terms of precision and has distinct advantages with respect to user interface, labor intensiveness and quality of data presentation.
Keywords: lesion volume, stroke, traumatic brain injury, cell death, lesion estimation, computational method
1. Introduction
The assessment of lesion volume (LV) and lesion location is pivotal in both clinical and experimental settings. Clinically, this practice is used for many purposes, including prognostic assessment of stroke (Merino et al., 2007; Rivers et al., 2006), multiple sclerosis (Bagnato et al., 2011; Zivadinov et al., 2012), traumatic brain injury (Darling et al., 2011; Di Stefano et al., 2000), and atrophy of the hippocampus in epileptic patients (Wieshmann et al., 1997). In research, LV is often the most important control variable when assessing the efficacy of novel interventions for post-stroke neurorehabilitation, including emerging biological therapies (Chen et al., 2001), electrical stimulation (Adkins-Muir and Jones, 2003; Brown et al., 2003; Kleim et al., 2003), and physical therapy (Wolf et al., 2006). Unfortunately, current methods to assess LV either lack precision or require extensive labor. Given the critical relevance of LV and the need for frequent measurements of this variable in the course of preclinical experimentation, it is important to develop a method that is both precise and time efficient. Here we report a novel semi-automated method for estimation of LV and compare its precision and efficiency to currently used methods.
Commonly employed techniques for LV measurement include adapted use of imaging software (i.e. Adobe Photoshop CS ©, ImageJ) to manually outline the lesion with a tracing mechanism, such as the free-form or edge-detection selector tools (Di Stefano et al., 2000; Lee et al., 1996; Zivadinov et al., 2012). The metric area is then calculated based on the resolution of the image. A ruler or object of known size can be included in all images or in an index figure in order to establish a firm correlation between metric distance and pixels for the specific imaging modality (i.e. flat bed slide scanning) (Machado et al., 2009). There are several variations to this approach. The choice of imaging methodologies represents a compromise between data accuracy and time efficiency. The higher-precision lesion selection tools tend to require extensive user input. In these cases, the total time required to measure stroke volume for an entire experiment can become prohibitive. Computational algorithms and macros, often custom built to reduce user effort, may undermine the precision of area estimation. For example, hemispheric comparison, though less manual and therefore less time-consuming, is a low-precision method and can be particularly prone to error, especially when lesion sizes are small.
Methods employed once areas of cross-sections are measured must represent the actual volume. Although Simpson’s rule (Lee et al., 1996) is frequently used to estimate the volume size from slices in parallel planes, it does not provide a method for visual reconstruction of three dimensional volumes. Moreover, the volume reconstruction by cylindrical approximation (Goldberg et al., 1995) is crude and non-continuous.
In order to facilitate a time-efficient and accurate means of determining LV, we devised semi-automated software that calculates the area of multiple cross sections of the lesion and then creates a three-dimensional model of the LV, named Serial Lesion Image Computed Estimation (SLICE). The LV determination process is facilitated by a custom-designed MATLAB© interface that cycles through the images, calculates LVs, reconstructs the lesion in 3D space, and stores the results for analysis. Furthermore, it also has a novel feature for projecting lesion volumes onto a rodent stereotactic atlas (Paxinos and Watson, 1998) saving the user considerable time in creating lesion-representative figures.
2. Materials and Methods
Methods for measuring the stroke volume were compared utilizing histology from the brain of rats that had undergone cortical ischemia induced by intracortical injections of endothelin. Since the true size of a natural lesion cannot be calculated with absolute accuracy - all methods aim at best estimating the size of a lesion - we also utilized two hundred computer generated images with artificially created lesions to compare the methods. The animal experiments were performed using male Sprague-Dawley rats (250–350g). The animals were housed in an Association for Assessment and Accreditation of Laboratory Animal Care (AAALAC)-approved animal facility in a climate controlled environment that included a 12-h light/dark cycle and free access to water. All procedures were approved by the Institutional Animal Care and Use Committee (IACUC) of the Cleveland Clinic.
2.1 Endothelin injections
Anesthesia and stereotactic procedures were performed as previously described (Baker et al., 2010; Machado et al., 2009). Anesthesia was initiated in a chamber saturated with isoflurane and then maintained under mechanical ventilation. The rat was positioned on a stereotactic frame (David Kopf, Tujunga, CA) and fixed at the external auditory canals and maxilla. A midline incision was opened over the calvaria. Three bur holes were created for injecting one dose of endothelin-1 (800 pmol each) at the following coordinates in relation to bregma (depth 2.3mm): 1) AP= −1.0 mm, ML= 2.5 mm, 2) AP= +1.0 mm, ML= 2.5 mm and 3) AP= +3.0 mm, ML= 2.5 mm (Windle et al., 2006). Animals were monitored during recovery from anesthesia, with food and water provided ad libitum. Pain was alleviated post-operatively with buprenorphine (0.05mg/kg twice daily) subcutaneously. Animals were sacrificed after seven weeks.
2.2 Histology and image preparation
All rats were transcardially perfused with 0.1M phosphate-buffered saline (PBS) followed by 500ml of 4% paraformaldehyde in PBS. The tissue was then sent for histological processing (Neuroscience Associates, Knoxville, TN) and prepared according to the following protocol (modified from Neuroscience Associates):
Brains were treated with 20% glycerol + 2% dimethylsulfoxide
Brains were then fixed in agelatin matrix (MultiBrain Technology™, NeuroScience Associates).
The block was cured and quickly frozen (−70°C isopentane chilled with crushed dry ice) and placed on the freezing stage of a sliding microtome (AO-860; American Optical, Buffalo, NY).
The block was sectioned in the coronal plane at 40μm and sequentially collected into a 4×6 array of containers with Antigen Preserve solution (50% ethylene glycol, 49% PBS pH 7.0, 1% polyvinyl pyrrolidone).
One of every 24th section was slice mounted. Therefore, The inter-slice distance was 24×40μm = 960 μm.
Each of the large sections cut from the block was a composite holding individual sections from each of the brains embedded in the block so that uniformity of staining was achieved across treatment groups (MultiBrain technology).
Sections were placed onto gelatinized slides for Nissl staining.
Sections were dehydrated through alcohols prior to defatting in a chloroform/ether/alcohol solution and rehydrated and stained with 0.05% Thionine/0.08M acetate buffer, pH 4.5.
Following deionized water rinses, the sections were differentiated in 95% alcohol/acetic acid, dehydrated in a standard alcohol series, cleared in xylenes, and coverslipped.
Histological sections were scanned to a computer at 2400 dpi with multiple coronal cerebral sections on each slide. Images containing the lesion area were then cropped and organized into folders by animal.
2.3 Description of programs used
The estimation of lesion volumes is divided into three stages. The first stage is the measurement of the lesion area in each slice and the second stage is the measurement of the lesion volume using the interpolation of the lesion area. In the final stage, lesion volumes and their percentile in relation to the whole group were overlaid onto the rat brain atlas.
2.3.1 Lesion area measurement
There are two traditional methods for estimating lesion area. One is the hemisphere comparison method and the other is the tracing method. In the hemisphere comparison method, the lesion area is estimated by the difference between the hemispheres. The hemisphere comparison method assumes symmetry of the brain after histological preparation of the lesioned tissue and absence of major slicing artifacts. This method may be ineffective, particularly for sections that may have asymmetry caused by damage during slice preparation and different shrinkage rates in fixation solutions (figure 1). In contrast, with the tracing method, the user delineates the perimeter of the desired region based on the expected perimeter of a non-lesioned brain and the corresponding boundary coordinates are determined and stored by the program. A commonly used tracing software tool is the free-form selector tool or Lasso tool available in Adobe Photoshop CS©; however other software packages can be used such as ImageJ and GIMP. Once regions of the lesion have been traced, the numerical value for the number of pixels in the selection are obtained and manually entered into a spreadsheet. From these values, the areas of each selection are calculated by dividing the number of pixels per unit area. However, in cases where lesion size is large and missing a substantial cortical boundary, the investigator must arbitrarily estimate the original boundary from the preserved boundary. This limitation is obviously prone to increase the estimation error. In order to evaluate the precision of our method, we compared results obtained from both the hemisphere comparison method and the Lasso tracing method (using the Lasso tool available in Adobe Photoshop CS©) to those obtained using our new method.
Figure 1.
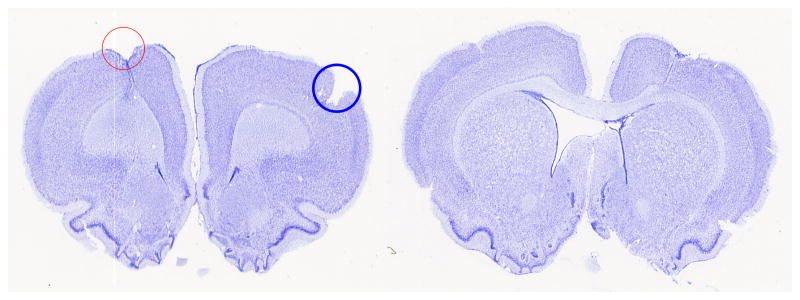
Examples of brain sections that clearly show the drawbacks of using hemispheric comparison. (a) The red in the left hemisphere contains the stroke lesion while the blue circle in the right hemisphere contains an artifact of preparation. In the hemisphere comparison method, the stroke lesion area will be cancelled out with the slice preparation error causing inaccuracy in the stroke lesion area estimation. (b) The right lateral ventricle was flattened while the left lateral ventricle was expanded.
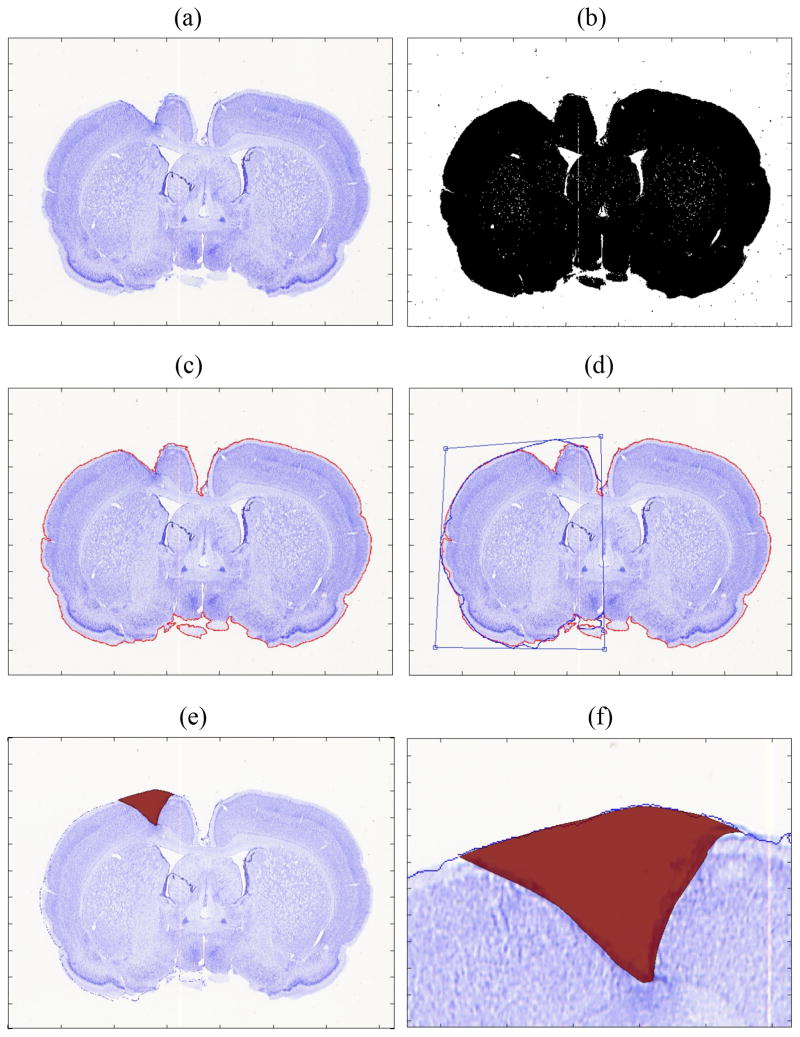
The novel SLICE method combines the advantages while minimizing the disadvantages of these two methods. SLICE is a tracing method with a boundary guideline. The boundary guideline is a flipped contour of the hemisphere without a lesion to the one with a lesion. However, unlike the traditional hemisphere comparison method, the user can reshape the flipped contours to correct any sectioning artifacts and match the existing boundary of the lesioned hemisphere. The software calculates the lesion area traced with lines or Bezier curves accounting for the image resolution and stores the result automatically. The detailed procedure is described as follows (figure 2).
Figure 2.
(a) Original brain slice image stained with Nissl. (b) Converted black and white image before filtering. (c) Edge delineated and marked with red line. (d) Contour of the nonlesion (right) hemisphere was flipped to the lesioned hemisphere (left) and adjusted. (e) Traced lesion area is shown in red. (f) close-up view of the lesion area.
2.3.2 Lesion area estimation
1) Convert to black and white image
The RGB image was converted to a gray scale image to find the border of the brain image. The conversion was made by finding the luminance in gray scale as follows:
where Y, R, G, and B are luminance, red, green and blue intensity values between 0 and 1. Then, the gray scale image was converted to a black and white image. Since the background image is white, pixels with luminance value less than or equal to a threshold value are converted to black and the remaining pixels are converted to white. The threshold can be changed depending on the staining method and the luminance of slices. In our examples of Nissl-stained rat brain slices, values between 0.90 and 0.92 were used as the threshold.
2) Filter noise
Once a black and white image was obtained, the image was filtered to remove the noise. Noise filtering was performed using both local median filter and pixel connectedness check, in sequence. First, the median filter smoothed the image where each pixel of the output image was the median value in the 5×5 neighborhood pixels around the corresponding pixel. Then, the connectedness of each pixel was checked. Those pixels that had less than 5000 connected pixels were considered noise and filtered out. The adequate number for pixel connectedness will vary depending on image size and resolution.
3) Find boundary
The boundary of the filtered image was obtained by removing all the interior pixels of the filtered black and white image. An interior pixel was defined as one whose neighboring pixels were part of the brain.
4) Flip image
The non-lesioned hemisphere was flipped onto the lesioned hemisphere to estimate the border. Perspective transform was used to stretch the boundary line to compensate for asymmetry due to the different shrink ratio in the non-lesioned hemisphere and lesioned hemisphere as well as artifacts in slice preparation. The perspective transform reshapes the border image by mapping the four corners of the original flipped image and the reshaped target image (Criminisi et al., 1999).
5) Trace the image
Tracing the stroke lesion can be done either by polygons or Bezier curves. Using Bezier curves, the same tracing accuracy can be obtained with a smaller number of data points. The Bezier curve B(t) starting at P0 moving toward P1 and P2, and arriving at P3 is expressed as follows.
The area enclosed by a Bezier curve was calculated by dividing each Bezier curve into connected straight lines and then by calculating the area inside a polygon.
2.3.3 Lesion volume estimation
Once the lesion area in each slice was estimated, the lesion volume was calculated with different methods for comparison. These included the cylindrical computation rule, the trapezoidal computation rule, the application of Simpson’s rule, and the fit computation method based on the shape of the lesion (shape based rule), which is integrated into SLICE.
1) Cylindrical rule
Cylindrical computation fits the selected region to a circle using diameter vectors. It then finds the volume of the cylinder generated between each cross section and adds the volumes. It follows the proceeding formula:
2) Trapezoidal rule
The volume is calculated by the multiplication of the average lesion area and the distance as follows.
, where f(x) is the cross-sectional area at x.
Since the total volume is the summation of all the interpolated volume between slices, the trapezoidal computation method generates the same result as the cylindrical computation method for the total volume calculation.
3) Simpson’s rule
While the trapezoidal rule is a linear approximation method, Simpson’s rule is a quadratic polynomial approximation method as follows.
4) Shape based rule
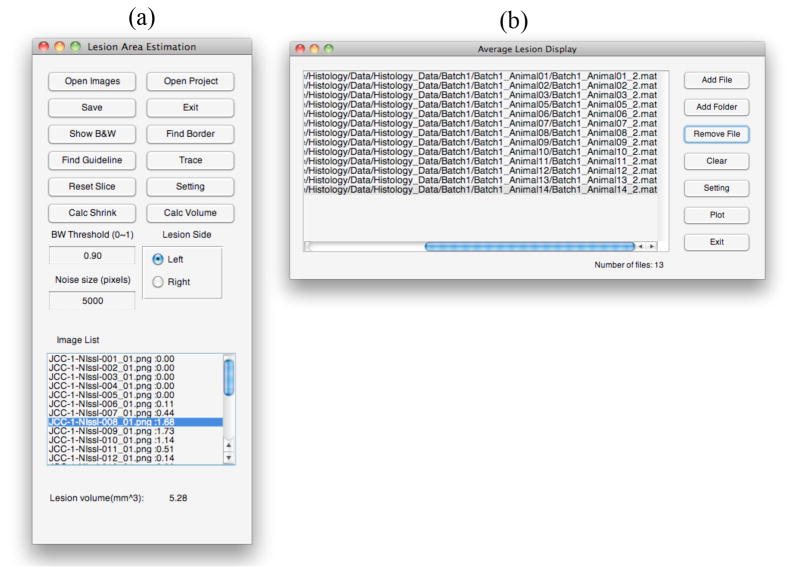
All of the above methods assume that the lesion boundaries follow a definite mathematical law. Therefore, previous estimation methods do not account for larger changes in the shape of the stroke lesion in each slice. The novel shape based computation method maps out the lesion in 3D space while taking irregularities in the shape of the lesion into account. There are many methods to interpolate polygons in parallel planes. In this study, we adopted minimizing the surface area of the reconstructed 3D volume as a metric function for interpolation (Cook et al., 1980; Meyers et al., 1992). The method to calculate the volume size of the reconstructed 3D geometry is explained Cook’s paper (Cook et al., 1980). The software will also calculate the difference between lesion areas in the adjacent parallel planes so that when a certain value (e.g. 10%) is detected, intermediate planes can be inserted with smaller inter-slice distances proportional to the ratio of areas. The user interfaces for the LV estimation and display are shown in figure 3.
Figure 3.
(a) User interface to calculate lesion volume. (b) User interface to display averaged lesion volume on top of a brain atlas.
2.4 Method comparison
2.4.1 Comparison of lesion area estimation methods
The different lesion area estimation methods were compared in a data set of artificially generated lesions (n=200), illustrated in figure 4. The artificial lesions were generated by deletion of part of intact brain slice images. The 200 slices were traced by the three different methods: hemisphere comparison method, Photoshop Lasso tracing method and SLICE.
Figure 4.
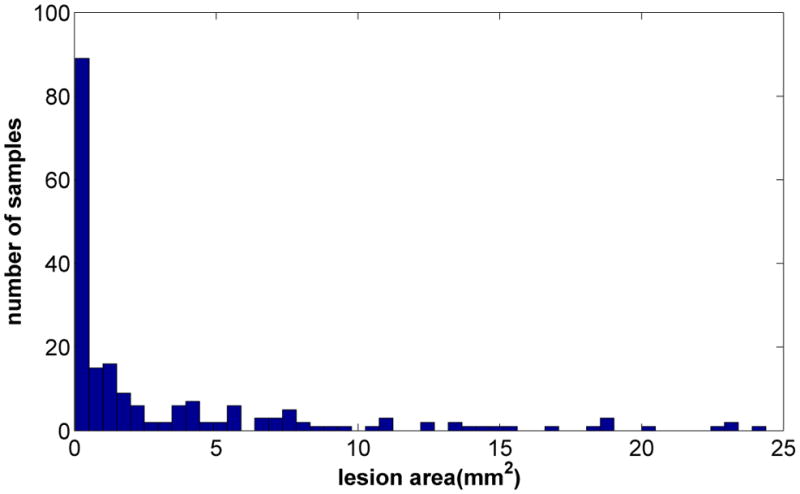
Histogram of the lesion area of the artificially generated lesion data. The average lesion area was 3.4±5.3 (mm2).
2.4.2 Consistency of lesion area estimation
Since the consistency of the lesion estimation is important not only in each individual but also across different users, the consistency test was performed using multiple replicates of lesion slides. For this purpose, three individual users were asked to estimate four duplicates of 75 different slides sorted in random order. Then the intra- and inter-rater consistency for the same slides was measured.
2.4.3 Comparison of lesion volume estimation methods
The volume estimation methods were compared in a sample of slices from the brain histology of 29 animals with strokes induced by endothelin-1 as described above. Although the results of the volume estimation methods can be compared with one another, the accuracy of each method cannot be truly measured because of the unknown true lesion volume. Therefore, for the accuracy test of each method, brain slides of additional two animals with strokes were prepared with very small inter-slice distance to assess true volume with small error. The inter-slice distance for these two animals was 60μm and the slice thickness was 10 μm. The accuracy of each lesion volume estimation method was tested by increasing inter-slice interval from 60μm to 1200 μm. The accuracy in shape and localization of the lesion volume estimation was measured using the following metric.
In the above equation, Vtrue and Vmeasured are the true volume and the measured volume respectively. The first term in the equation is the ratio of the measured volume inside the true volume, and the second term is the ratio of the measured volume outside the true volume. If the measured volume aligned perfectly with the true volume, the score is 1. In the opposite case where there is no overlap between the measured volume and the true volume the score becomes −1.
3. Results
3.1 Area estimation
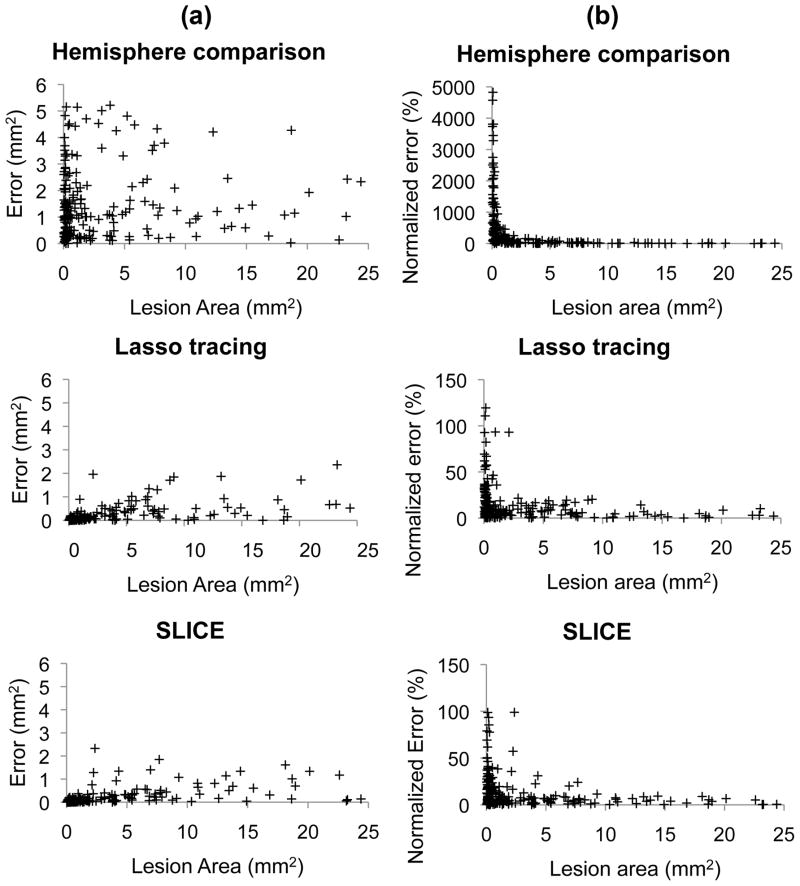
The area distribution of the artificially generated lesion data (n=200) is shown in figure 4. The average lesion area was 3.4±5.3 (mm2). The errors in lesion area estimation are shown in figure 5. The average errors for the hemisphere comparison method, SLICE and Photoshop lasso method were 1.5±1.3, 0.2±0.4, and 0.2±0.4 (mm2) respectively, and the corresponding normalized errors were 509±999, 14±18, and 15±20 (%) respectively. Both the SLICE and the Lasso tracing method in Photoshop were more accurate (p<0.001) than the hemisphere comparison method in estimating the lesion area, but there was no significant difference between SLICE and the Lasso tracing method. Slices with small lesions had higher normalized errors compared to larger lesions.
Figure 5.
Results for 200 artificially generated brain slices with lesion. (a) Average errors for hemisphere comparison method, SLICE method, and Lasso tracing method were 1.5±1.3, 0.2±0.4, and 0.2±0.4 (mm2), respectively. (b) The corresponding normalized errors were 509±999, 14±18, and 15±20 (%), respectively. Both the SLICE method and the Lasso tracing method were more accurate (p<0.001) than the hemisphere comparison method in estimating the lesion area, but there was no significant difference between the SLICE method and the Lasso tracing method.
3.2 Lesion area estimation consistency
The consistency of the lesion estimation was tested using 75 different slides with four replicates. The consistency was measured by the deviation from the average values of four trials in each slide. The average lesion areas measured by each user were 1.49±1.51 mm2, 1.52±1.46 mm2, and 1.53±1.41 mm2 respectively. The average standard deviations for each of three individual users were 0.19±0.25 mm2, 0.18±0.21 mm2 and 0.24±0.27 mm2 respectively, and the normalized average standard deviation was 13.9±13.4%, 12.0±8.5% and 15.7±11.7% for each user. As for the individual consistency for four duplicate images, Friedman analysis showed that user1 had no significant difference (p>0.3), while user2 and user3 showed significant difference for the duplicate images (p<0.02 and p<0.002) when all trials were taken into account. However, when only the last trial out of four duplicates was counted, there was no significant difference among these three users (p>0.9). The results indicate that after a quick learning curve the individual discrepancy became insignificant.
3.3 Volume estimation
An example of 3D reconstruction of stroke volume is shown in figure 6. The average stroke volume using cylindrical computation, Simpson’s rule and shaped based computation (incorporated in SLICE software) was 8.0±8.1 mm3 (minimum: 1.2 mm3, maximum: 33.6 mm3), 8.1±8.1 mm3 (minimum: 1.3 mm3, maximum: 33.2 mm3) and 7.9±8.0 mm3 (minimum: 1.1 mm3, maximum: 33.2 mm3) respectively before correcting for the effect of histological shrinkage. The estimated average volume after shrinkage was 72.2±8.2% of its original volume. Therefore the estimated volumes corrected for shrinkage were 10.9±10.7 mm3 for cylindrical computation, 11.1±10.6 mm3 for Simpson’s rule, and 10.7±10.5 mm3 for shape based computation. The LVs estimated using cylindrical method and Simpson’s rule were 1.0±0.1% and 5.2±4.7% higher than shaped based computation, respectively. The results for different methods are summarized in table 1. Although the differences in the results of these methods were very small, a Wilcoxon signed rank test showed that cylindrical/trapezoid rule and Simpson’s rule overestimated LVs compared to shape based computation (p<0.001).
Figure 6.
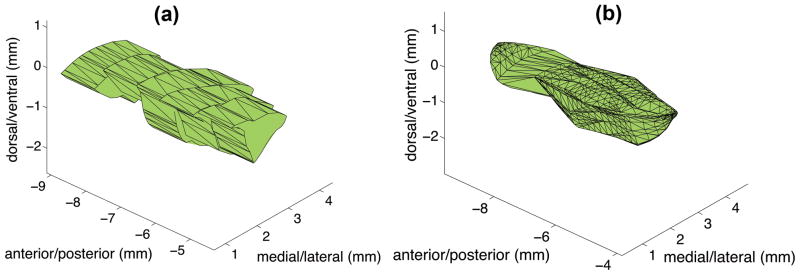
Example of stroke volume before applying a shrink rate correction. The lesion volume using five slides were (a) Cylindrical method: 7.5mm3 (b) Shape based method 7.4 mm3.
Table 1.
Volume estimation results
| Before shrinkage correction (mm3) | After shrinkage correction (mm3) | |
|---|---|---|
| Cylinder/Trapezoidal rule | 8.0±8.1 (1.2 – 33.6) | 10.9±10.7 (1.7 – 37.5) |
| Simpson’s rule | 8.1±8.1 (1.3 – 33.2) | 11.1±10.6 (1.9 – 37.1) |
| SLICE | 7.9±8.0 (1.1 – 33.2) | 10.7±10.5 (1.6 – 37.1) |
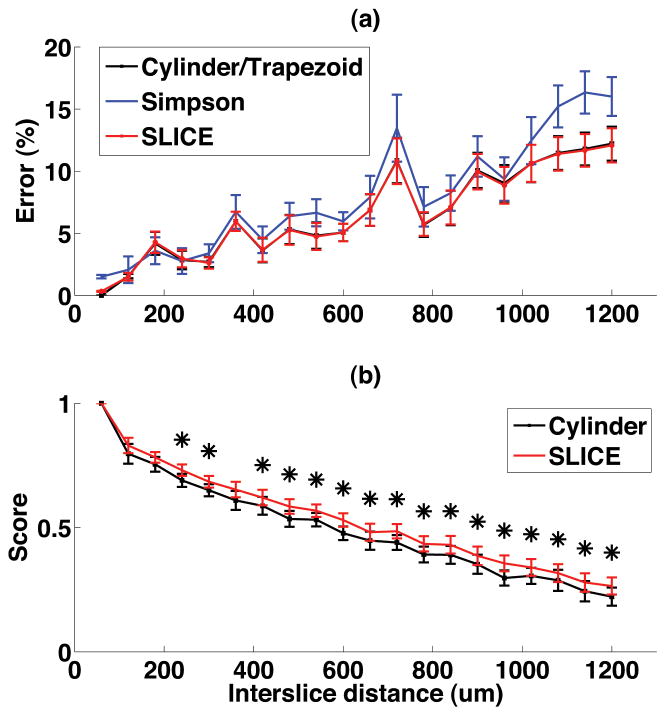
The results of the accuracy test of each lesion volume measurement method for the two thinly sliced brains with small inter-slice distances are shown in figure 7. The lesion volumes, measured by tracing the areas of all slices, were 5.21 mm3 and 6.68 mm3 before shrinkage correction. As the inter-slice distance increased, the volume estimation error increased. The difference between the volume size measured by the cylinder method and shape based method was less than 1%. However, shape based method showed higher score for correct localization of the lesion volume in the brains than the cylinder method.
Figure 7.
Accuracy test result of volume estimation methods for different inter-slice distances from 60 μm to 1200 μm. (a) The normalized error of the lesion volume size (b) Lesion volume localization score. * represents statistical significance (p<0.05).
4. Discussion
In this study we compared three different methods of lesion area estimation: the hemisphere comparison method, the Lasso tracing method and our SLICE method. For artificially generated lesions, the SLICE method and the Lasso tracing method were comparable in terms of the estimation error while the hemisphere comparison method produced larger errors. The large errors in the hemisphere comparison method are primarily due to the asymmetry of the brain slices. Asymmetry can be caused - in addition to the lesion itself - by different shrink rate of the lesioned hemisphere and the non-lesioned hemisphere. It can be also due to an imperfect brain slice preparation processes such as inadvertent oblique sectioning or deformation of the thin brain slices. For these reasons, estimating lesion areas with the traditional hemisphere comparison method is less accurate than with the other methods. The error is worse for smaller lesions, given that the size of the lesion may be similar or even smaller than the magnitude of slicing asymmetry or deformation.
We found no significant difference between the Photoshop Lasso tracing method and the SLICE method in lesion area estimation, indicating that estimation of the post-lesion borderline is comparable to estimation of the borderline by flipping and reshaping of the non-lesioned hemisphere. However, the SLICE method is simpler, more automated, and thus requires less investigator experience. The consistency of the results among the three individuals users after brief learning curve also indicates the practicality of this novel software.
Lesion volumes are traditionally calculated with methods such as cylindrical calculation by the summation of the multiplication of each lesion area and the distance between slices. Even though this approach can be widely used and accomplished with simple calculations (Goldberg et al., 1995), it can mislead the actual shape and location of lesion volume particularly when the distance between the brain slices is larger, given the reduced grannurality to inform the model. The error can be reduced by adding more brain slices and reducing inter-slice interval. However, this increases time and cost. Our method estimates the size and shape of the volume by interpolating the lesion in the anterior-posterior direction, and thus provides a better reflection of the shape of the actual lesion compared to other methods. The new features for volume estimation provides an easy, fast and accurate stroke volume estimation method for neuroscientists.
In contrast to Photoshop or ImageJ, our software provides automated function to calculate the lesion volume conveniently and quickly. In our software, the lesion area in each slice does not have to be saved in a separate document and the lesion area is calculated automatically for the given image resolution: i.e. 2400 pixels/inch in our experiments. The improvement in time efficiency is particularly important for studies with large sample sizes. In addition, because our shape-based method takes into account the continuity of the LV between slices, it allows for better visualization of the LVs. The SLICE software provides an additional novel feature for visualization of the lesion overlaid on the brain atlas. The averaged lesion area and lesion percentiles at various AP locations are shown and can assist the investigator by providing a better graphic representation of lesion volumes, shape and localization of an entire experimental group (figure 8). In summary, the novel SLICE software allows for accurate, semiautomated measurement of lesion areas. The volume calculation algorithm allows for accuracy equivalent to the currently available methods but with less error related to intersection gaps. Lesion volume, shape and topography can be accurately plotted on existing brain atlases for graphic representation of individual lesions or group averages.
Figure 8.
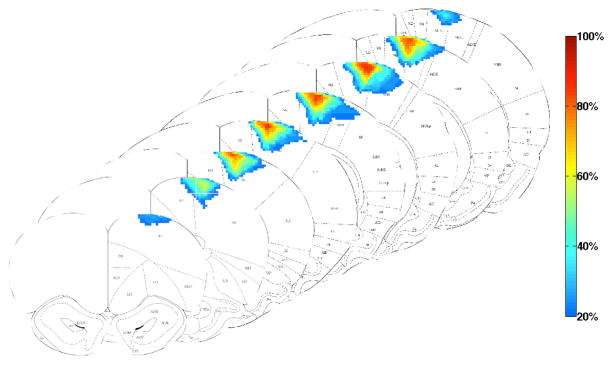
Graphical representation of the volume, topography and shape of strokes from the entire group, overlaid on coronal diagrams from the Paxinos atlas of the rat brain. The lesions spanned from AP 4.2mm to −1.8mm. The color gradient represents the percentile (frequency of occurrence) of the stroke lesion volume.
Highlights.
We present a method to estimate and visualize lesion volume.
The method provides higher accuracy than the hemisphere comparison method.
The method provides similar accuracy in lesion volume size estimation, but provides higher accuracy in the lesion localization.
Tools are provided for graphic representation of group averaged lesion volume.
Acknowledgments
The research was funded by an NIH grant: 5R01HD061363.
Footnotes
Publisher's Disclaimer: This is a PDF file of an unedited manuscript that has been accepted for publication. As a service to our customers we are providing this early version of the manuscript. The manuscript will undergo copyediting, typesetting, and review of the resulting proof before it is published in its final citable form. Please note that during the production process errors may be discovered which could affect the content, and all legal disclaimers that apply to the journal pertain.
References
- Adkins-Muir DL, Jones TA. Cortical electrical stimulation combined with rehabilitative training: enhanced functional recovery and dendritic plasticity following focal cortical ischemia in rats. Neurol Res. 2003;25:780–8. doi: 10.1179/016164103771953853. [DOI] [PubMed] [Google Scholar]
- Bagnato F, Ikonomidou VN, van Gelderen P, Auh S, Hanafy J, Cantor FK, Ohayon J, Richert N, Duyn J. Lesions by tissue specific imaging characterize multiple sclerosis patients with more advanced disease. Multiple Sclerosis Journal. 2011;17:1424–31. doi: 10.1177/1352458511414601. [DOI] [PubMed] [Google Scholar]
- Baker KB, Schuster D, Cooperrider J, Machado AG. Deep brain stimulation of the lateral cerebellar nucleus produces frequency-specific alterations in motor evoked potentials in the rat in vivo. Exp Neurol. 2010;226:259–64. doi: 10.1016/j.expneurol.2010.08.019. [DOI] [PMC free article] [PubMed] [Google Scholar]
- Brown JA, Lutsep H, Cramer SC, Weinand M. Motor cortex stimulation for enhancement of recovery after stroke: case report. Neurol Res. 2003;25:815–8. doi: 10.1179/016164103771953907. [DOI] [PubMed] [Google Scholar]
- Chen JL, Li Y, Wang L, Zhang ZG, Lu DY, Lu M, Chopp M. Therapeutic benefit of intravenous administration of bone marrow stromal cells after cerebral ischemia in rats. Stroke. 2001;32:1005–11. doi: 10.1161/01.str.32.4.1005. [DOI] [PubMed] [Google Scholar]
- Cook LT, Cook PN, Rak Lee K, Batnitzky S, Wong BYS, Fritz SL, Ophir J, Dwyer SJ, Bigongiari LR, Templeton AW. An Algorithm for Volume Estimation Based on Polyhedral Approximation. IEEE Trans Biomed Eng. 1980;27:493– 500. doi: 10.1109/TBME.1980.326663. [DOI] [PubMed] [Google Scholar]
- Criminisi A, Reid I, Zisserman A. A plane measuring device. Image Vision Comput. 1999;17:625–34. [Google Scholar]
- Darling WG, Pizzimenti MA, Hynes SM, Rotella DL, Headley G, Ge J, Stilwell-Morecraft KS, McNeal DW, Solon-Cline KM, Morecraft RJ. Volumetric effects of motor cortex injury on recovery of ipsilesional dexterous movements. Exp Neurol. 2011;231:56–71. doi: 10.1016/j.expneurol.2011.05.015. [DOI] [PMC free article] [PubMed] [Google Scholar]
- Di Stefano G, Bachevalier J, Levin HS, Song JX, Scheibel RS, Fletcher JM. Volume of focal brain lesions and hippocampal formation in relation to memory function after closed head injury in children. Journal of Neurology, Neurosurgery & Psychiatry. 2000;69:210–6. doi: 10.1136/jnnp.69.2.210. [DOI] [PMC free article] [PubMed] [Google Scholar]
- Goldberg NS, Gazelle SG, Dawson SL, Rittman WJ, Mueller PR, Rosenthal DI. Tissue ablation with radiofrequency: Effect of probe size, gauge, duration, and temperature on lesion volume. Acad Radiol. 1995;2:399–404. doi: 10.1016/s1076-6332(05)80342-3. [DOI] [PubMed] [Google Scholar]
- Kleim JA, Bruneau R, VandenBerg P, MacDonald E, Mulrooney R, Pocock D. Motor cortex stimulation enhances motor recovery and reduces peri-infarct dysfunction following ischemic insult. Neurological Research. 2003;25:789–93. doi: 10.1179/016164103771953862. [DOI] [PubMed] [Google Scholar]
- Lee VM, Burdett NG, Carpenter TA, Hall LD, Pambakian PS, Patel S, Wood NI, James MF, Watson B. Evolution of Photochemically Induced Focal Cerebral Ischemia in the Rat: Magnetic Resonance Imaging and Histology. Stroke. 1996;27:2110–9. doi: 10.1161/01.str.27.11.2110. [DOI] [PubMed] [Google Scholar]
- Machado AG, Baker KB, Schuster D, Butler RS, Rezai A. Chronic electrical stimulation of the contralesional lateral cerebellar nucleus enhances recovery of motor function after cerebral ischemia in rats. Brain Res. 2009;1280:107–16. doi: 10.1016/j.brainres.2009.05.007. [DOI] [PMC free article] [PubMed] [Google Scholar]
- Merino JG, Latour LL, Todd JW, Luby M, Schellinger PD, Kang D-W, Warach S. Lesion Volume Change After Treatment With Tissue Plasminogen Activator Can Discriminate Clinical Responders From Nonresponders. Stroke. 2007;38:2919–23. doi: 10.1161/STROKEAHA.107.485995. [DOI] [PMC free article] [PubMed] [Google Scholar]
- Meyers D, Skinner S, Sloan K. Surfaces from contours. ACM Trans Graph. 1992;11:228–58. [Google Scholar]
- Paxinos G, Watson C. The Rat Brain in Stereotaxic Coordinates. 4. Academic Press; San Diego, CA: 1998. [Google Scholar]
- Rivers CS, Wardlaw JM, Armitage PA, Bastin ME, Carpenter TK, Cvoro V, Hand PJ, Dennis MS. Do Acute Diffusion- and Perfusion-Weighted MRI Lesions Identify Final Infarct Volume in Ischemic Stroke? Stroke. 2006;37:98–104. doi: 10.1161/01.STR.0000195197.66606.bb. [DOI] [PubMed] [Google Scholar]
- Wieshmann UC, Woermann FG, Lemieux L, Free SL, Bartlett PA, Smith SJ, Duncan JS, Stevens JM, Shorvon SD. Development of hippocampal atrophy: a serial magnetic resonance imaging study in a patient who developed epilepsy after generalized status epilepticus. Epilepsia. 1997;38:1238–41. doi: 10.1111/j.1528-1157.1997.tb01222.x. [DOI] [PubMed] [Google Scholar]
- Windle V, Szymanska A, Granter-Button S, White C, Buist R, Peeling J, Corbett D. An analysis of four different methods of producing focal cerebral ischemia with endothelin-1 in the rat. Exp Neurol. 2006;201:324–34. doi: 10.1016/j.expneurol.2006.04.012. [DOI] [PubMed] [Google Scholar]
- Wolf SL, Winstein CJ, Miller JP, Taub E, Uswatte G, Morris D, Giuliani C, Light KE, Nichols-Larsen D, Investigators E. Effect of constraint-induced movement therapy on upper extremity function 3 to 9 months after stroke - The EXCITE randomized clinical trial. Jama-Journal of the American Medical Association. 2006;296:2095–104. doi: 10.1001/jama.296.17.2095. [DOI] [PubMed] [Google Scholar]
- Zivadinov R, Brown MH, Schirda CV, Poloni GU, Bergsland N, Magnano CR, Durfee J, Kennedy C, Carl E, Hagemeier J, Benedict RHB, Weinstock-Guttman B, Dwyer MG. Abnormal subcortical deep-gray matter susceptibility-weighted imaging filtered phase measurements in patients with multiple sclerosis: A case-control study. NeuroImage. 2012;59:331–9. doi: 10.1016/j.neuroimage.2011.07.045. [DOI] [PubMed] [Google Scholar]


