

Abstract
Objectives
The effects of subthalamic nucleus (STN) deep brain stimulation (DBS) on gait and balance vary and the underlying mechanisms remain unclear. DBS location may alter motor benefit due to anatomical heterogeneity in STN. The purposes of this study were to (1) compare effects of DBS of dorsal (D-STN) versus ventral (V-STN) regions on gait, balance and regional cerebral blood flow (rCBF) and (2) examine relationships between changes in rCBF and changes in gait and balance induced by D-STN or V-STN DBS.
Methods
We used a validated atlas registration to locate and stimulate through electrode contacts in D-STN and V-STN regions of 37 people with Parkinson disease. In a within-subjects, double-blind and counterbalanced design controlled for DBS settings, we measured PET rCBF responses in a priori regions of interest and quantified gait and balance during DBS Off, unilateral D-STN DBS and unilateral V-STN DBS.
Results
DBS of either site increased stride length without producing significant group-level changes in gait velocity, cadence or balance. Both sites increased rCBF in subcortical regions and produced variable changes in cortical and cerebellar regions. DBS-induced changes in gait velocity related to premotor cortex rCBF changes during V-STN DBS (r = −0.40, p = 0.03) and to rCBF changes in the cerebellum anterior lobe during D-STN DBS (r = −0.43, p = 0.02).
Conclusions
DBS-induced changes in gait corresponded to rCBF responses in selected cortical and cerebellar regions. These relationships differed during D-STN versus V-STN DBS, suggesting DBS acts through distinct neuronal pathways dependent on DBS location.
Keywords: deep brain stimulation, gait, positron emission tomography, Parkinson disease, subthalamic nucleus
Introduction
Reductions in gait velocity and stride length characterize the postural instability and gait disturbances common in idiopathic Parkinson disease (PD) [Ferrandez and Blin 1991]. Deep brain stimulation of the subthalamic nucleus (STN DBS) improves gait and balance in some individuals with PD [Faist et al. 2001; Nilsson et al. 2009] yet its mechanisms of action remain unclear. Understanding the mechanisms underlying response variability may provide insights into the neural control of gait and balance and the functional anatomy of the STN.
One key factor contributing to response variability may be stimulation of different anatomic sites in the STN region. Investigations of STN circuitry in non-human primates reveal distinct regions with potentially disparate functions. The dorsolateral STN region connects to sensorimotor areas of the basal ganglia and to motor cortical areas while the ventral STN region connects to higher order cortical regions subserving cognitive functions [Parent and Hazrati 1995]; in vivo magnetic resonance imaging techniques may confirm this in humans[Lambert et al. 2012b]. Electrode contact location along the typical dorsolateral to ventromedial surgical implantation trajectory through the STN region may therefore influence the clinical effects of DBS. In support of this hypothesis, unilateral stimulation of the ventral STN region (V-STN DBS) impaired response inhibition performance in individuals with PD more than stimulation of the dorsal STN region (D-STN DBS) [Hershey et al. 2010]. On the other hand, the influence of contact location on gait and balance remains unclear: D-STN stimulation [Johnsen et al. 2010] or V-STN stimulation [Hilliard et al. 2011] may be optimal, or either location may be equally effective for improving gait and balance [McNeely et al. 2011].
Neuroimaging can identify pathways activated by DBS [Ballanger et al. 2009; Hershey et al. 2003; Perlmutter et al. 2002] and the responses in these pathways subsequently correlated with behavioral responses [Campbell et al. 2008; Karimi et al. 2008]. Stimulation of different STN regions could activate distinct downstream cortical and cerebellar areas dependent upon different anatomic connections. Therefore, comparing regional cerebral blood flow (rCBF) responses during D-STN versus V-STN DBS and evaluating any relationships between rCBF and motor responses may provide further insights into the functional anatomy of the STN. These comparisons may help to determine which circuits subserve motor functions and to explain the variability of motor responses to STN DBS.
Thus the purposes of this study were to compare the effects of D-STN versus V-STN DBS on gait, balance and rCBF and then determine the relationships between motor performance and rCBF responses. To achieve these goals, we employed a validated process to locate [Videen et al. 2008] and selectively stimulate through electrode contacts in the D-STN and V-STN regions. In our within-subjects, double-blind and counterbalanced design controlled for stimulation variables (voltage, pulse width, frequency) we measured rCBF responses (PET imaging with 15O-labeled water), gait (GaitRITE Systems), and balance (Mini-BESTest) during each of three stimulation conditions: DBS Off, unilateral D-STN DBS, and unilateral V-STN DBS.
Methods
Participants
Thirty-seven participants with idiopathic PD and previous implantation of bilateral STN DBS electrodes (electrode model 3389, Medtronic Activa System; Medtronic Inc., Minneapolis, Minnesota, USA) were recruited to participate in a two-day protocol. All participants were diagnosed with PD based on established criteria [Hughes et al. 1992] and had undergone DBS surgery [Tabbal et al. 2007] at least three months prior to enrollment to allow adequate time for optimization of clinical stimulation settings, confirmation of response to DBS, and resolution of micro-subthalamotomy effects. Participants were selected based on our validated contact localization procedure [Videen et al. 2008] to ensure the presence of electrode contacts within the D-STN and V-STN regions on the side of the brain contralateral to the more affected side of the body as determined by a Unified Parkinson Disease Rating Scale III (UPDRS-III) assessment in the off-medication and off-stimulation state. Additionally, participants were free of other neurological diseases, confounding medications, or injuries affecting gait or balance. All participants provided informed written consent and the study protocol was approved by the Human Research Protection Office (local internal review board) and the Radioactive Drug Research Committee of Washington University in St. Louis.
Experimental Design
Participants were evaluated on two separate days after overnight withdrawal (>8 hours) of antiparkinsonian medications. The first day included PET scans using 15O-labeled water to measure qualitative rCBF while the participant was lying at rest with eyes closed and the second day included quantitative analyses of gait and balance. Evaluations on both days were completed in each of three stimulation conditions, performed in a double-blind manner with order counterbalanced across participants: off stimulation (OFF), unilateral D-STN DBS, and unilateral V-STN DBS. Unilateral stimulation was contralateral to the more affected side of the body as determined by a UPDRS-III assessment in the off-medication and off-stimulation state. All testing occurred at least 42 minutes after changes in stimulator settings to evaluate participants near the steady-state of most motor symptoms [Temperli et al. 2003; Sturman et al. 2008].
Contact Localization and Stimulator Settings
DBS electrode contacts were localized within the STN region using a previously validated method [Videen et al. 2008]. In brief, anatomic fiducials near the STN region were identified on pre-surgical MR scans and the DBS electrode tip and four contacts were located on post-surgical CT scans. After co-registering the MR and CT scan, the anatomic fiducials were used to transform both images into Mai atlas space [Mai et al. 2004] where the STN was identified and visualized with respect to the contact locations.
To distinguish the effects of stimulation in the D-STN and V-STN regions, we used similar stimulation settings at both sites across all participants: monopolar electrode configuration, 185 Hz frequency, 2.5V amplitude, 60 μs pulse width. These settings provide measurable motor benefits while minimizing current spread to adjacent anatomical regions [Butson and McIntyre 2005; Butson and McIntyre 2006], minimizing adverse side effects and reducing possible overlap in current spread from the two stimulation sites [Hershey et al. 2010]. Unilateral stimulation eliminated the confound of non-symmetric electrode placement within the STN region.
Neuroimaging
Up to four PET scans were acquired in each stimulation condition using [15O]-water as described [Karimi et al. 2008]. Real-time monitoring, surface electrodes, and videotapes were used [Karimi et al. 2008] to exclude scans with substantial movement or muscle activity from future analysis and thus control for movement confounds [Hershey and Mink 2006].
Emission data from the 40-second interval beginning with initial [15O]-water uptake in the brain were reconstructed [Karimi et al. 2008] and smoothed using a 3D Gaussian filter to a resolution of 12mm full width at half maximum in all three dimensions. Each smoothed emission image was co-registered to the initial emission image, resliced to create an image in Talairach space, and globally normalized to a standard mean PET counts of 1000 [Talairach and Tournoux 1988; Woods et al. 1992].
After removing scans during which participants displayed visible movement or sustained EMG activity above baseline, the remaining 1–4 emission scans for each stimulation condition were globally normalized then averaged to create a mean condition image for each participant in each stimulation condition. At least one scan was required in each stimulation condition for inclusion of a participant in further analyses.
Regions of Interest
Qualitative cerebral blood flow responses to DBS were examined in seven a priori regions of interest (ROIs) (Table I) chosen based on known effects of STN DBS on cerebral blood flow [Hershey et al. 2003], basal ganglia circuitry and the neural control of gait. The three subcortical ROIs (STN region, internal segment of the globus pallidus [GPi] and thalamus) were used to confirm that the stimulation paradigm produced quantifiable changes in rCBF while the two cortical regions (premotor cortex and supplementary motor area [SMA]) and two cerebellar regions (cerebellum anterior lobe hemispheres [CBAH] and vermis [CBAV]) were used to evaluate relationships between changes in rCBF, gait and balance. The thalamus was defined by an anatomic mask; all other ROIs were defined by spheres placed based on coordinates previously identified as peaks of DBS-induced rCBF changes (STN, GPi, SMA, CBAH, and CBAV from Hershey et al. 2003; premotor cortex from Karimi et al. 2008) (Table I).
Table I.
Radius and Talairach Coordinates of Spherical Regions of Interest
| radius (mm) | x | y | z | |
|---|---|---|---|---|
| Premotor cortex | 5 | −43 (L), +45 (R) | 3 | 42 |
| Supplementary motor area (SMA) | 6 | 0 | −16 | 50 |
| Cerebellum – anterior lobe, hemispheres (CBAH) | 5 | ±14 | −38 | −16 |
| Cerebellum – anterior lobe, vermis (CBAV) | 5 | 0 | −60 | −8 |
| Subthalamic nucleus (STN) | 5 | ±11 | −14 | −4 |
| Internal segment of globus pallidus (GPi) | 5 | ±16 | −6 | −1 |
| Thalamus | (bilateral thalami defined by an anatomic mask) | |||
Based on our hypothesis that gait and balance changes would relate to bilateral cortical and cerebellar rCBF changes, we did not differentiate responses ipsilateral and contralateral to the side of stimulation but instead averaged rCBF changes across sides in the five bilateral ROIs. This approach is supported by previous evidence of bilateral rCBF effects of unilateral stimulation [Tanei et al. 2009; Arai et al. 2008], and we compared the ipsilateral and contralateral rCBF changes to confirm that bilateral averaging did not mask effects of unilateral stimulation.
Motor Function Evaluations
Evaluation of motor function during each stimulation condition included (1) administration of the UPDRS-III by a validated rater, (2) gait analysis using a 4.8m GAITRite walkway (CIR Systems, Sparta, NJ, USA) and (3) balance analysis using the Mini-Balance Evaluation Systems Test (Mini-BESTest). Participants walked across the GAITRite walkway three times at their preferred pace; gait velocity, stride length and cadence were measured. The Mini-BESTest is a 14-item clinical test of dynamic balance that rates patients on common tasks such as standing on one leg and rising from a chair; scores were reported out of 32 possible points [Franchignoni et al. 2010].
Statistical Analyses
To assess the effects of the two unilateral stimulation conditions, pairwise comparisons for D-STN vs OFF and also V-STN DBS vs OFF were conducted for each rCBF, gait and balance variable. To determine whether the effects of stimulation differed by contact location, an additional pairwise comparison was conducted for each dependent variable, comparing changes induced by D-STN DBS (i.e., D-STN – OFF) to those induced V-STN DBS. In all cases, paired samples t-tests were used for gait and rCBF data, Wilcoxon Signed Rank Tests were used for the non-parametric UPDRS-III and Mini-BESTest scores, and a Bonferroni correction was applied to correct for evaluation of multiple (4) ROIs or multiple (2) motor measures. For all analyses, statistical significance was assessed as pcorrected < 0.05 and trend level was defined as p < 0.05 before correction.
To assess the relationships between stimulation-induced changes in rCBF and changes in gait and balance, the percent change in rCBF induced by D-STN or V-STN DBS relative to OFF (e.g., 100*(D-STN – OFF)/OFF) was correlated with the corresponding percent change in gait velocity and with the difference in Mini-BESTest relative to OFF (e.g., D-STN – OFF). We used Spearman’s rho and raw score differences for the Mini-BESTest analyses to avoid exaggerating the effect size of small changes in balance measured by the 32 point ordinal scale. These planned correlations were assessed with a Bonferroni correction for evaluation of multiple (4) ROIs posited to relate to gait and balance to control for possible Type I errors. For any region in which stimulation-induced rCBF changes correlated at least at trend level (puncorrected < 0.05) with stimulation-induced gait velocity changes, the rCBF relationships with changes in cadence and stride length were also evaluated.
Results
Seven of the 37 participants were excluded from analyses due to visible tremor or excessive EMG activity during all PET scans in one or more stimulation condition. Demographic and clinical features of the 30 participants analyzed are listed in Table II. The seven participants excluded due to movement had similar characteristics [mean (SD): age 59.9(6.3), disease duration 12.1(6.5), months since DBS surgery 20.4(20.3), off-state UPDRS-III score 33.1(13.1)]. During preliminary evaluations of the standardized stimulation settings, eight participants experienced untoward effects including contralateral paresthesias and jaw, arm and leg dystonias. These effects occurred most often during testing of the V-STN contact and were resolved with reduction of voltages of both the D-STN and V-STN contacts to 2.3V (2 participants), 2.2V (1 participant), 2.1V (1 participant), and 1.8V (4 participants) for the duration of the study. Figure 1 shows the D-STN and V-STN DBS contact locations and estimated spheres of current spread for these 30 participants. All but four individuals had at least one contact between the stimulated dorsal and ventral contacts and the anatomic separation between dorsal and ventral contact coordinates was statistically significant in the three principle directions (paired t-tests, all t(29) > 13.9, all p < 0.001).
Table II.
Participant Demographics and Stimulation Characteristics
| Mean (SD)
|
|
|---|---|
|
Demographics
| |
| Gender | 19 male, 11 female |
| Age (years) | 64.0 (7.7) |
| Disease duration (years) | 14.3 (5.6) |
| Time since DBS surgery (months) | 22.4 (20.8) |
| UPDRS-III score (off medication, off DBS) | 35.5 (10.5) |
|
Clinically optimized stimulator settings
| |
| Voltage (V) | 2.8 (0.7) |
| Pulse width (μs) | 62.1 (7.7) |
| Frequency (Hz) | 185 (0.0) |
|
Study stimulation characteristics
| |
| Side of stimulation | 14 left, 16 right |
| Subjects with clinical contact as study contact | 9 dorsal, 8 ventral |
| Voltage (V) | 2.4 (0.2) |
| Pulse Width (μs) | 60 (0.0) |
| Frequency (Hz) | 185 (0.0) |
| Dorsal x (absolute value) | 12.7 (1.0) |
| Dorsal y | −17.6 (1.5) |
| Dorsal z | −1.6 (0.7) |
| Ventral x (absolute value) | 11.8 (1.0) |
| Ventral y | −19.5 (1.3) |
| Ventral z | −5.3 (0.8) |
Note. Clinically optimized settings are reported for the clinical contact on same side of brain as study stimulation. Average x, y and z position of the study contacts are reported in Mai atlas coordinates.
Figure 1.
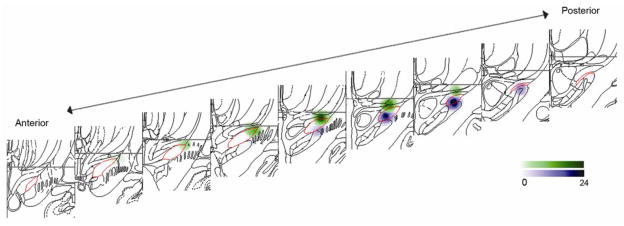
Distribution of dorsal (green) and ventral (purple) contacts in the STN region (red outline) for the sample (N=30). A 2mm radius sphere is centered on each study contact. Contacts on left side of the brain are flipped across x-axis for display. Color gradient denotes number of contacts within 2mm of each voxel.
Validation of stimulation paradigm
We confirmed that unilateral stimulation at the selected contacts and settings affected motor performance and rCBF in subcortical regions near the stimulation site. Indeed, UPDRS-III scores improved with both D-STN DBS (Wilcoxon signed rank test, Z = −4.01, p < 0.001) and V-STN DBS (Z = −4.27, p < 0.001) compared to OFF (Figure 2A) and blood flow in several subcortical ROIs showed significant changes with stimulation: V-STN DBS increased rCBF relative to OFF in the STN region (paired t-test, t(29) = 3.86, p = 0.001), GPi (t(29) = 3.75, p = 0.001), and thalamus (t(29) = 2.38, p = 0.024); D-STN DBS increased rCBF relative to OFF in the STN region (t(29) = 2.40, p = 0.023), GPi (t(29) = 2.91, p = 0.007) but not in the thalamus (t(29) = 1.90, p = 0.068) (Figure 2B).
Figure 2.

Average change (± SEM) in motor function (A) and regional cerebral blood flow (rCBF) (B) during stimulation of dorsal (D-STN) and ventral (V-STN) subthalamic nucleus regions measured relative to no stimulation (OFF). UPDRS-III and Mini-BESTest evaluations are shown as score changes; gait and rCBF measures are shown as percent changes. N=30 except for Mini-BESTest as two individuals did not complete this evaluation. STN, subthalamic nucleus; GPi, internal segment of the globus pallidus; CBAH, hemispheres of the anterior lobe of the cerebellum; CBAV, vermis of the anterior lobe of the cerebellum; SMA, supplementary motor area. * Measure during STN DBS is significantly different from OFF after Bonferroni corrections described in text. Note: Removal of statistical outliers beyond 3 standard deviations from the mean does not eliminate statistical significance of any comparisons.
To confirm that the decision to average bilateral rCBF responses did not mask unilateral effects, we compared rCBF responses ipsilateral and contralateral to the stimulation site in each of the bilaterally defined ROIs. The lateralized responses were not consistently different in the bilaterally defined ROIs (paired t-tests, all p > 0.09 except for the thalamus rCBF response to D-STN DBS in which case the ipsilateral response was larger [p = 0.01] than the contralateral response).
Effect of stimulation relative to OFF
Motor Effects
After Bonferroni correction for evaluation of multiple (2) motor behaviors, the Mini-BESTest did not show significant improvements with either V-STN (Wilcoxon signed rank test, Z = −2.22, pcorrected = 0.052) or D-STN DBS (Z = −1.82, pcorrected = 0.138) (Figure 2A). Notably, the small differences in median Mini-BESTest score between conditions were due to a large variability in response across participants (Table III) with changes ranging from −5 to +7 during D-STN DBS and from −5 to +9 during V-STN DBS. Similarly, after correction there were no significant improvements in gait velocity with either D-STN DBS (paired t-test, t(29) = 2.32, pcorrected = 0.054) or V-STN DBS (t(29) = 1.25, pcorrected = 0.44). Since STN DBS is reported to preferentially affect stride length over cadence we secondarily evaluated the effects of stimulation on these two variables. Stimulation of either STN region increased stride length (D-STN DBS: t(29) = 3.31, p = 0.002; V-STN DBS: t(29) = 2.37, p = 0.025) but neither stimulation condition produced a significant effect on cadence (D-STN DBS: t(29) = −0.014, p = 0.99; V-STN DBS: t(29) = −1.01, p = 0.32) (Figure 2A). To determine whether the effects of DBS on gait were more marked in individuals with worse OFF-state performance, we ranked patients by OFF-state gait velocity and evaluated those patients below the median. Among this subset (n=15), both D-STN (paired t-test, t(14) = 4.64, pcorrected < 0.002) and V-STN DBS (t(14) = 2.30, pcorrected = 0.08) influenced gait velocity more strongly than they did for the entire group.
Table III.
Variability of Motor Responses to Dorsal and Ventral STN DBS
| D-STN DBS vs OFF
|
V-STN DBS vs OFF
|
|||
|---|---|---|---|---|
| Mean Percent Change | Number (Percent) of Patients Improved | Mean percent Change | Number (Percent) of Patients Improved | |
| UPDRS-IIIa | −6.5 | 25 (83%) | −6.5 | 24 (80%) |
| Mini-BESTesta | 0.5 | 14 (50%) | 1 | 16 (57%) |
| Gait velocity | 19 | 19 (63%) | 16 | 15 (50%) |
| Gait stride length | 16 | 22 (73%) | 16 | 17 (57%) |
| Gait cadence | 2 | 15 (50%) | 0 | 11 (37%) |
Note. Improvements are defined as negative changes in UPDRS score and by positive changes in all other variables.
Median change in score is reported instead of mean percent change
Regional Cerebral Blood Flow Effects
None of the cortical or cerebellar ROIs had rCBF response levels significantly different from OFF after correction for multiple (4) ROIs although V-STN DBS tended to decrease CBAH rCBF relative to OFF (paired t-test, t(29) = −2.47, puncorrected = 0.02). Overall, rCBF in deep brain structures increased with stimulation whereas rCBF in the cortical and cerebellar regions showed more variability in the response direction (Figure 2B).
Comparison of the effects of dorsal and ventral STN DBS
The DBS-induced changes in UPDRS-III, Mini-BESTest, gait velocity, stride length and cadence performance did not vary based on stimulation location (Wilcoxon signed rank tests for scores, all Z < −0.34, puncorrected > 0.74; paired t-test for gait, all t(29) < 1.4, puncorrected > 0.18) (Figure 2A). After Bonferroni correction, none of the ROIs investigated had significantly different rCBF responses with D-STN compared to V-STN DBS. However V-STN DBS tended to increase rCBF responses in the premotor cortex (t = −2.20, puncorrected = 0.036) region more than D-STN DBS did relative to OFF (Figure 2B).
Correlation analyses of rCBF with gait and balance
Blood flow changes in the premotor cortex induced by V-STN DBS negatively correlated with the V-STN DBS-induced changes in gait velocity (r = −0.40, puncorrected = 0.03) (Figure 3A). This relationship with changes in gait velocity was driven primarily by a negative correlation with changes in cadence (r = −0.42, puncorrected = 0.02) (Figure 3B) but not with changes in stride length (r = −0.30, puncorrected = 0.11). Blood flow changes in CBAH induced by D-STN DBS negatively correlated with the D-STN DBS-induced changes in gait velocity (r = −0.43, puncorrected = 0.02) (Figure 3C). This relationship was driven by a negative correlation with cadence (r = −0.40, p = 0.03) (Figure 3D) but not significantly by stride length (r = −0.32, p = 0.08). The correlations between DBS-induced changes in rCBF and DBS-induced changes in gait velocity did not retain statistical significance after Bonferroni correction for evaluation of multiple (4) ROIs (adjusted alpha level = 0.013), and no other relationships were found between rCBF responses in the a priori ROIs and changes in gait or Mini-BESTest scores (Table IV).
Figure 3.

DBS induced changes in gait related to changes in regional cerebral blood flow (rCBF). Stimulation of the ventral STN region (V-STN) induced changes in premotor cortex rCBF negatively correlated with gait velocity (A), specifically cadence (B). Stimulation of the dorsal STN region (D-STN) induced changes in rCBF in the hemispheres of the anterior lobe of the cerebellum (CBAH) negatively correlated with changes in forward walking velocity (C) and more specifically, cadence (D). Statistical outliers beyond three standard deviations from the mean are marked with asterisks. Removal of these data eliminates the correlation in Figure D (r = −0.09, p = 0.66) but does not significantly change relationships in A, B, or C.
Table IV.
Correlation coefficients (uncorrected significance level) of all investigated correlations between DBS-induced motor responses and rCBF responses in a priori regions of interest.
| Premotor | SMA | CBAH | CBAV | |
|---|---|---|---|---|
| Correlations between D-STN DBS-induced motor and rCBF responses | ||||
| Gait velocity | r =−0.27 (p = 0.15) | r = 0.15 (p = 0.45) | r =−0.43 (p = 0.02) | r = 0.28 (p=0.88) |
| Mini-BESTest | rs =−0.23 (p = 0.23) | rs = 0.21 (p = 0.28) | rs = 0.11 (p = 0.56) | rs = 0.11 (p = 0.56) |
| Correlations between V-STN DBS-induced motor and rCBF responses | ||||
| Gait velocity | r =−0.40 (p = 0.03) | r =−0.03 (p = 0.89) | r = 0.10 (p = 0.60) | r = 0.05 (p = 0.81) |
| Mini-BESTest | rs=−0.15 (p=0.43) | rs=0.12 (p=0.55) | rs=0.12 (p=0.55) | rs=0.20 (p=0.32) |
Note. Correlations with p < 0.05 are in bold; no correlations are significant after Bonferroni correction for evaluation of multiple (4) a priori regions of interest (adjusted alpha level of 0.013).
To determine whether the observed relationships between DBS-induced blood flow responses and gait velocity responses persisted when controlled for age, time since DBS surgery or PD duration, we evaluated partial correlations controlled for each factor. The influence of each factor was evaluated separately due to the limitations of sample size (n=30). The D-STN DBS-induced relationship between CBAH rCBF changes and gait velocity changes and the V-STN DBS-induced relationship between premotor rCBF changes and gait velocity changes both retained trend level significance (puncorrected < 0.05) when controlled for age (D-STN: r = −0.44, puncorrected = 0.02; V-STN: r = −0.40, puncorrected = 0.03) or PD duration (D-STN: r = −0.39, puncorrected = 0.04; V-STN: r = −0.37, puncorrected = 0.046). The D-STN DBS-induced relationship lost this statistical significance when controlled for time since surgery (r = −0.35, puncorrected = 0.06) but the V-STN DBS-induced relationship persisted (r = −0.42, puncorrected = 0.03).
Discussion
D-STN and V-STN do not differentially affect gait or balance, and are only minimally different in their effects on selected regions of blood flow. However, the influence of STN DBS on gait may be mediated by different circuits depending on the site of STN region stimulation. Specifically, V-STN DBS induced changes in gait velocity correlated with changes in rCBF in the premotor cortex whereas D-STN DBS induced changes in gait velocity correlated with changes in rCBF in CBAH. In both cases, stimulation-induced decreases in rCBF were associated with improvements in gait velocity.
In agreement with several previous studies [Faist et al. 2001; Johnsen et al. 2009], we found that STN stimulation improved gait velocity primarily by increasing stride length while its influence on cadence was variable. In our study, these gait responses were similar during D-STN and V-STN DBS, supporting previous findings that location of active electrode contact in the STN region did not influence gait responses [McNeely et al. 2011]. Others report that D-STN and V-STN DBS have different effects on gait [Johnsen et al. 2011]. Our study differs from those reporting differential effects of D-STN and V-STN DBS in that: our comparisons were done within-subjects and a time delay between stimulation settings allowed participants to approach a steady-state before evaluation; uniform stimulation variables, selected to minimize overlap between the volumes of tissue activated by each stimulation site, were used for all participants; the localization process did not employ anatomical tracing of the STN on pre-operative MRI or contact localization on post-operative MRI. By eliminating several confounding variables, these features thus improved our chances of isolating the effects of stimulation and recognizing a difference between the effects of D-STN and V-STN DBS on gait and balance if such a difference exists.
The relatively large between-subjects variability of gait responses to DBS enhanced our ability to detect a correlation between changes in gait velocity and DBS-induced changes in cortical and cerebellar blood flow. Controlling for age, disease duration, and time since DBS surgery did not explain these relationships. The relationships between gait velocity changes and rCBF changes in cortical and cerebellar regions support the notion that DBS mediates motor effects through basal ganglia-thalamo-cortical and cerebello-thalamo-cortical circuits [McIntyre and Hahn 2010; Doya 2000] but do not exclude the possibility that the DBS-induced relationships are mediated by pathways other than the parallel loops described by traditional models. For example, recent studies using viral tracers demonstrate an anatomic substrate for two-way communication between the basal ganglia and the cerebellar cortex [Bostan et al. 2010]. Similarly, a recent resting state functional connectivity study demonstrates strong functional but not necessarily direct anatomical connectivity between striatum and an extended brainstem region that includes thalamus, midbrain, pons and cerebellum [Hacker et al. 2012]. Alternatively, other pathways could mediate the observed DBS-induced rCBF and motor changes rather than or in addition to the traditional model of cortically-linked basal ganglia and cerebellar loops.
Neither D-STN nor V-STN DBS at the selected settings produced a consistent directional effect on rCBF in the cortical or cerebellar regions examined. However, patients whose rCBF decreased in the CBAH during D-STN DBS or in the premotor cortex during V-STN DBS tended to demonstrate the greatest stimulation-induced improvements in gait velocity. While the rCBF changes in cortical and cerebellar regions likely reflect activity changes of distant input neurons through some of the networks discussed above, these changes also could be driven by changes in local interneuronal activity [Hershey and Mink 2006]. Therefore, the association of decreases in rCBF with gait improvements may suggest that larger reductions in interneuronal activity relate to improvements in gait function.
Our findings of distinct relationships between rCBF and gait responses to D-STN versus V-STN DBS suggest that while producing similar changes in motor function, the neuronal pathways by which DBS exerts these influences may vary with stimulation location. These findings are consistent with non-human primate data showing motor cortex projections to the dorsal STN region and premotor cortex projections to the ventromedial STN [Parent and Hazrati1995]. Notably, implanted electrode trajectory results in contact positions that differ not only in the dorsal-ventral dimension under investigation, but also in the anterior-posterior dimension; controlled sampling across all dimensions of the STN would be necessary for more detailed functional mapping. A recent study using diffusion-weighted imaging to evaluate STN connectivity in 12 healthy adults demonstrated in-vivo the presence of three sub-regions within the human STN distinguished by cortical and subcortical connections [Lambert et al. 2012a]. Although the specific delineations of the STN sub-regions in these studies are not directly comparable, the non-human primate anatomy, combined with the evidence of in-vivo segregation in humans, supports our finding that V-STN but not D-STN DBS induced a strong relationship between changes in premotor cortex rCBF and changes in gait.
In this study, motor changes during D-STN DBS did not correlate with changes in SMA or premotor cortex rCBF, but rather these changes correlated to rCBF changes in CBAH. As our analyses were limited to a priori regions of interest, we cannot exclude involvement of other brain regions or circuits. Whole-brain analyses of rCBF changes may be useful for identifying additional regions involved but will require more participants given the reduced magnitude of stimulation voltage that we chose to help distinguish effects of D-STN and V-STN DBS. Anatomic connections between STN and CBAH that may occur via pedunculopontine nucleus [Bostan and Strick 2010] may mediate the relationship between gait changes and CBAH rCBF changes during D-STN DBS. Alternatively, this relationship may reflect stimulation of cerebellothalamic fibers passing by the STN [Gallay et al. 2008]or functional brain networks involved in motor control, altered in Parkinson disease, and potentially affected by deep brain stimulation [Hacker et al. 2012; Wu et al. 2009; Poston and Eidelberg 2011; McIntyre and Hahn2010]. One resting-state functional connectivity study demonstrated topographically organized functional coupling between the cerebellum and specific cortical areas including the premotor, somatomotor, and association cortices [Buckner et al. 2011]. The CBAH region we investigated may be functionally coupled with a specific cortical region in a basal ganglia-thalamo-cortical circuit influenced preferentially during D-STN DBS compared to V-STN DBS. Such functional coupling could explain the observed stimulation-location dependency of the relationship between DBS-induced changes in CBAH rCBF and gait changes. Future resting-state fMRI studies may test this hypothesis by investigating resting-state networks from CBAH and premotor cortex.
Our finding of rCBF-gait relationships dependent on stimulation location also provides insight into the neural control of gait. Stimulation of different STN regions and consequent activation of distinct circuits produces similar changes in gait but may do so by disparate mechanisms. As gait involves integration and coordination of input from multiple sensory systems including the visual, vestibular, and somatosensory systems, DBS could influence gait by altering any of these systems. Indeed, several studies have noted the influence of DBS on behaviors such as eye movements [Fawcett et al. 2010; Lohnes and Earhart 2012] and posture regulation [Guehl et al. 2006]. The relevant functional organization of STN remains unknown, but DBS-induced gait changes may be mediated by modification of motor and cognitive behaviors that could be differentially influenced by stimulation location. Thus, the optimal DBS target for improving gait may be less regionally specific than for cognitive functions such as response inhibition [Hershey et al. 2010]. An alternative interpretation is that the relationship between cerebellar responses and gait changes represents compensation for dysfunction in the basal ganglia system. Finally, during stimulation at clinically-optimized settings (which typically have voltages higher than our study settings) DBS may spread farther and have greater effects on nearby fiber tracts including the zona incerta, Fields of Forel, and internal capsule [Kuncel and Grill 2004].
An important caveat of this study is that stimulation was provided unilaterally at settings distinct from those optimized for clinical effectiveness. The results of this study were not intended to directly suggest changes in practical patient management but rather, the selected settings permitted us to differentially stimulate the dorsal versus ventral STN regions while avoiding the potential confound of non-symmetric lead placement and overlapping current spheres. Our decision to evaluate axial motor symptoms during unilateral stimulation is supported by previous studies demonstrating axial effects from unilateral stimulation [Germano et al. 2004; Kelly et al. 2010] and similar effects on gait but with a smaller magnitude compared to bilateral stimulation [Bastian et al. 2003]. Indeed the effects on gait in this study were more modest than those reported in response to clinically optimized DBS [Bastian et al. 2003]. The influence of unilateral STN DBS on rCBF is not as well established, but accumulating evidence indicates that unilateral DBS produces bilateral rCBF responses [Tanei et al. 2009; Arai et al. 2008]. Bilateral connections of basal ganglia nuclei shown by anatomic studies [Marani et al. 2008; Parent and Hazrati1995] likely account for the observed contralateral effects. Functional connectivity studies [Palmer et al. 2010] and electrophysiological recordings from contralateral STN during unilateral STN DBS in rats [Shi et al. 2006] and humans [Liu et al. 2002; Walker et al. 2011] further support this notion.
We demonstrated that DBS-induced bilateral rCBF changes in selected cortical and cerebellar regions correlate with changes in motor behaviors and that these relationships are dependent on stimulation location. We observed no consistent difference between DBS-induced rCBF changes ipsilateral and contralateral to stimulation thereby adding to the growing body of evidence of bilateral connections of basal ganglia nuclei. Additional studies examining the effects of unilateral versus bilateral stimulation on cerebral activity and further evaluating functional organization of the STN are warranted.
Highlights.
We evaluated gait, balance, and rCBF responses to dorsal versus ventral STN DBS.
Dorsal and ventral STN DBS produce similar changes in gait and rCBF.
During ventral STN DBS, gait improvements correlate with decreased cortical rCBF.
During dorsal STN DBS, gait improvements correlate with decreased cerebellar rCBF.
Acknowledgments
The authors thank Ryan Duncan, Abigail Leddy, Phil Lintzenich, and John Michael Rotello for data collection assistance, and Vanessa Heil-Chapdelaine for data analysis assistance. This study was supported by: Mallinckrodt Institute of Radiology Summer Fellowship (KKH), NARSAD Young Investigator Award (MCC), American Academy of Neurology Fellowship (MU), Greater St. Louis Chapter of the American Parkinson Disease Association, National Institutes of Health (R01 NS41509; NS41248; NS58797; F31 NS071639; CO6 RR020092), Neuroscience Blueprint Core at Washington University (P30 NS057105), CTSA at Washington University (UL1 RR024992), APDA Advanced Center for PD Research at Washington University; Barnes-Jewish Hospital Foundation (Elliot Stein Family Fund, PD Research Fund).
Footnotes
Dr. Karimi and Dr. Revilla have received partial fellowship funding from Medtronic, Inc., the manufacturer of the implanted stimulators; no other authors have any conflicts of interest to disclose.
Publisher's Disclaimer: This is a PDF file of an unedited manuscript that has been accepted for publication. As a service to our customers we are providing this early version of the manuscript. The manuscript will undergo copyediting, typesetting, and review of the resulting proof before it is published in its final citable form. Please note that during the production process errors may be discovered which could affect the content, and all legal disclaimers that apply to the journal pertain.
Reference List
- Arai N, Yokochi F, Ohnishi T, Momose T, Okiyama R, Taniguchi M, Takahashi H, Matsuda H, Ugawa Y. Mechanisms of unilateral STN-DBS in patients with Parkinson’s disease: a PET study. J Neurol. 2008;255:1236–1243. doi: 10.1007/s00415-008-0906-7. [DOI] [PubMed] [Google Scholar]
- Ballanger B, Jahanshahi M, Broussolle E, Thobois S. PET functional imaging of deep brain stimulation in movement disorders and psychiatry. J Cereb Blood Flow Metab. 2009;29:1743–1754. doi: 10.1038/jcbfm.2009.111. [DOI] [PubMed] [Google Scholar]
- Bastian AJ, Kelly VE, Revilla FJ, Perlmutter JS, Mink JW. Different effects of unilateral versus bilateral subthalamic nucleus stimulation on walking and reaching in Parkinson’s disease. Mov Disord. 2003;18:1000–1007. doi: 10.1002/mds.10493. [DOI] [PubMed] [Google Scholar]
- Bostan AC, Dum RP, Strick PL. The basal ganglia communicate with the cerebellum. Proc Natl Acad Sci USA. 2010;107:8452–8456. doi: 10.1073/pnas.1000496107. [DOI] [PMC free article] [PubMed] [Google Scholar]
- Bostan AC, Strick PL. The cerebellum and basal ganglia are interconnected. Neuropsychol Rev. 2010;20:261–270. doi: 10.1007/s11065-010-9143-9. [DOI] [PMC free article] [PubMed] [Google Scholar]
- Buckner RL, Krienen FM, Castellanos A, Diaz JC, Yeo BTT. The organization of the human cerebellum estimated by intrinsic functional connectivity. J Neurophysiol. 2011;106:2322–2345. doi: 10.1152/jn.00339.2011. [DOI] [PMC free article] [PubMed] [Google Scholar]
- Butson CR, McIntyre CC. Tissue and electrode capacitance reduce neural activation volumes during deep brain stimulation. Clin Neurophysiol. 2005;116:2490–2500. doi: 10.1016/j.clinph.2005.06.023. [DOI] [PMC free article] [PubMed] [Google Scholar]
- Butson CR, McIntyre CC. Role of electrode design on the volume of tissue activated during deep brain stimulation. J Neural Eng. 2006;3:1–8. doi: 10.1088/1741-2560/3/1/001. [DOI] [PMC free article] [PubMed] [Google Scholar]
- Campbell MC, Karimi M, Weaver PM, Wu J, Perantie DC, Golchin NA, Tabbal SD, Perlmutter JS, Hershey T. Neural correlates of STN DBS-induced cognitive variability in Parkinson disease. Neuropsychologia. 2008;46:3162–3169. doi: 10.1016/j.neuropsychologia.2008.07.012. [DOI] [PMC free article] [PubMed] [Google Scholar]
- Doya K. Complementary roles of basal ganglia and cerebellum in learning and motor control. Curr Opin Neurobiol. 2000;10:732–739. doi: 10.1016/s0959-4388(00)00153-7. [DOI] [PubMed] [Google Scholar]
- Faist M, Xie J, Kurz D, Berger W, Maurer C, Pollak P, Lücking CH. Effect of bilateral subthalamic nucleus stimulation on gait in Parkinson’s disease. Brain. 2001;124:1590–1600. doi: 10.1093/brain/124.8.1590. [DOI] [PubMed] [Google Scholar]
- Fawcett AP, Gonzalez EG, Moro E, Steinbach MJ, Lozano AM, Hutchison WD. Subthalamic Nucleus Deep Brain Stimulation Improves Saccades in Parkinson’s Disease. Neuromodulation. 2010;13:17–25. doi: 10.1111/j.1525-1403.2009.00246.x. [DOI] [PubMed] [Google Scholar]
- Ferrandez AM, Blin O. A comparison between the effect of intentional modulations and the action of L-dopa on gait in Parkinson’s disease. Behav Brain Res. 1991;45:177–183. doi: 10.1016/s0166-4328(05)80083-x. [DOI] [PubMed] [Google Scholar]
- Franchignoni F, Horak F, Godi M, Nardone A, Giordano A. Using psychometric techniques to improve the Balance Evaluation Systems Test: the mini-BESTest. J Rehabil Med. 2010;42:323–331. doi: 10.2340/16501977-0537. [DOI] [PMC free article] [PubMed] [Google Scholar]
- Gallay MN, Jeanmonod D, Liu J, Morel A. Human pallidothalamic and cerebellothalamic tracts: anatomical basis for functional stereotactic neurosurgery. Brain Structure & Function. 2008;212:443–463. doi: 10.1007/s00429-007-0170-0. [DOI] [PMC free article] [PubMed] [Google Scholar]
- Germano IM, Gracies JM, Weisz DJ, Tse W, Koller WC, Olanow CW. Unilateral stimulation of the subthalamic nucleus in Parkinson disease: a double-blind 12-month evaluation study. J Neurosurg. 2004;101:36–42. doi: 10.3171/jns.2004.101.1.0036. [DOI] [PubMed] [Google Scholar]
- Guehl D, Dehail P, de Sèze MP, Cuny E, Faux P, Tison F, Barat M, Bioulac B, Burbaud P. Evolution of postural stability after subthalamic nucleus stimulation in Parkinson’s disease: a combined clinical and posturometric study. Exp Brain Res. 2006;170:206–215. doi: 10.1007/s00221-005-0202-z. [DOI] [PubMed] [Google Scholar]
- Hacker C, Perlmutter JS, Criswell S, Ances B, Snyder AJ. Resting state fMRI studies of Parkinson disease. Brain. 2012 doi: 10.1093/brain/aws281. (in press) [DOI] [PMC free article] [PubMed] [Google Scholar]
- Hershey T, Campbell MC, Videen TO, Lugar HM, Weaver PM, Hartlein J, Karimi M, Tabbal SD, Perlmutter JS. Mapping Go-No-Go performance within the subthalamic nucleus region. Brain. 2010;133:3625–3634. doi: 10.1093/brain/awq256. [DOI] [PMC free article] [PubMed] [Google Scholar]
- Hershey T, Mink JW. Using functional neuroimaging to study the brain’s response to deep brain stimulation. Neurology. 2006;66:1142–1143. doi: 10.1212/01.wnl.0000216425.34178.dd. [DOI] [PubMed] [Google Scholar]
- Hershey T, Revilla FJ, Wernle AR, McGee-Minnich L, Antenor JV, Videen TO, Dowling JL, Mink JW, Perlmutter JS. Cortical and subcortical blood flow effects of subthalamic nucleus stimulation in PD. Neurology. 2003;61:816–821. doi: 10.1212/01.wnl.0000083991.81859.73. [DOI] [PubMed] [Google Scholar]
- Hilliard JD, Frysinger RC, Elias WJ. Effective subthalamic nucleus deep brain stimulation sites may differ for tremor, bradykinesia and gait disturbances in Parkinson’s disease. Stereotact Funct Neurosurg. 2011;89:357–364. doi: 10.1159/000331269. [DOI] [PubMed] [Google Scholar]
- Hughes AJ, Daniel SE, Kilford L, Lees AJ. Accuracy of clinical diagnosis of idiopathic Parkinson’s disease: a clinico-pathological study of 100 cases. J Neurol Neurosurg Psychiatry. 1992;55:181–184. doi: 10.1136/jnnp.55.3.181. [DOI] [PMC free article] [PubMed] [Google Scholar]
- Johnsen EL, Mogensen PH, Sunde NA, Ostergaard K. Improved asymmetry of gait in Parkinson’s disease with DBS: gait and postural instability in Parkinson’s disease treated with bilateral deep brain stimulation in the subthalamic nucleus. Mov Disord. 2009;24:590–597. doi: 10.1002/mds.22419. [DOI] [PubMed] [Google Scholar]
- Johnsen EL, Sunde N, Mogensen PH, Ostergaard K. MRI verified STN stimulation site--gait improvement and clinical outcome. Eur J Neurol. 2010;17:746–753. doi: 10.1111/j.1468-1331.2010.02962.x. [DOI] [PubMed] [Google Scholar]
- Karimi M, Golchin N, Tabbal SD, Hershey T, Videen TO, Wu J, Usche JW, Revilla FJ, Hartlein JM, Wernle AR, Mink JW, Perlmutter JS. Subthalamic nucleus stimulation-induced regional blood flow responses correlate with improvement of motor signs in Parkinson disease. Brain. 2008;131:2710–2719. doi: 10.1093/brain/awn179. [DOI] [PMC free article] [PubMed] [Google Scholar]
- Kelly VE, Israel SM, Samii A, Slimp JC, Goodkin R, Shumway-Cook A. Assessing the effects of subthalamic nucleus stimulation on gait and mobility in people with Parkinson disease. Disabil Rehabil. 2010;32:929–936. doi: 10.3109/09638280903374139. [DOI] [PubMed] [Google Scholar]
- Kuncel AM, Grill WM. Selection of stimulus parameters for deep brain stimulation. Clin Neurophysiol. 2004;115:2431–2441. doi: 10.1016/j.clinph.2004.05.031. [DOI] [PubMed] [Google Scholar]
- Lambert C, Zrinzo L, Nagy Z, Lutti A, Hariz M, Foltynie T, Draganski B, Ashburner J, Frackowiak R. Confirmation of functional zones within the human subthalamic nucleus: Patterns of connectivity and sub-parcellation using diffusion weighted imaging. Neuroimage. 2012;60:83–94. doi: 10.1016/j.neuroimage.2011.11.082. [DOI] [PMC free article] [PubMed] [Google Scholar]
- Liu X, Ford-Dunn HL, Hayward GN, Nandi D, Miall RC, Aziz TZ, Stein JF. The oscillatory activity in the Parkinsonian subthalamic nucleus investigated using the macro-electrodes for deep brain stimulation. Clin Neurophysiol. 2002;113:1667–1672. doi: 10.1016/s1388-2457(02)00256-0. [DOI] [PubMed] [Google Scholar]
- Lohnes CA, Earhart GM. Effect of subthalamic deep brain stimulation on turning kinematics and related saccadic eye movements in Parkinson disease. Exp Neurol. 2012;236:389–394. doi: 10.1016/j.expneurol.2012.05.001. [DOI] [PMC free article] [PubMed] [Google Scholar]
- Mai JK, Assheuer J, Paxinos G. Atlas of the Human Brain. San Diego: Elsevier Academic Press; 2004. [Google Scholar]
- Marani E, Heida T, Lakke EA, Usunoff KG. The subthalamic nucleus. Part I: development, cytology, topography and connections. Adv Anat Embryol Cell Biol. 2008;198:1–113. vii. [PubMed] [Google Scholar]
- McIntyre CC, Hahn PJ. Network perspectives on the mechanisms of deep brain stimulation. Neurobiol Dis. 2010;38:329–337. doi: 10.1016/j.nbd.2009.09.022. [DOI] [PMC free article] [PubMed] [Google Scholar]
- McNeely ME, Hershey T, Campbell MC, Tabbal SD, Karimi M, Hartlein JM, Lugar HM, Revilla FJ, Perlmutter JS, Earhart GM. Effects of deep brain stimulation of dorsal versus ventral subthalamic nucleus regions on gait and balance in Parkinson’s disease. J Neurol Neurosurg Psychiatry. 2011;82:1250–1255. doi: 10.1136/jnnp.2010.232900. [DOI] [PMC free article] [PubMed] [Google Scholar]
- Nilsson MH, Fransson PA, Jarnlo GB, Magnusson M, Rehncrona S. The effects of high frequency subthalamic stimulation on balance performance and fear of falling in patients with Parkinson’s disease. J Neuroeng Rehabil. 2009;6:13. doi: 10.1186/1743-0003-6-13. [DOI] [PMC free article] [PubMed] [Google Scholar]
- Palmer SJ, Li J, Wang ZJ, McKeown MJ. Joint amplitude and connectivity compensatory mechanisms in Parkinson’s disease. Neuroscience. 2010;166:1110–1118. doi: 10.1016/j.neuroscience.2010.01.012. [DOI] [PubMed] [Google Scholar]
- Parent A, Hazrati LN. Functional anatomy of the basal ganglia. I. The cortico-basal ganglia-thalamo-cortical loop. Brain Res Brain Res Rev. 1995;20:91–127. doi: 10.1016/0165-0173(94)00007-c. [DOI] [PubMed] [Google Scholar]
- Perlmutter JS, Mink JW, Bastian AJ, Zackowski K, Hershey T, Miyawaki E, Koller W, Videen TO. Blood flow responses to deep brain stimulation of thalamus. Neurology. 2002;58:1388–1394. doi: 10.1212/wnl.58.9.1388. [DOI] [PubMed] [Google Scholar]
- Poston KL, Eidelberg D. Functional brain networks and abnormal connectivity in the movement disorders. Neuroimage. 2011;62:2261–2270. doi: 10.1016/j.neuroimage.2011.12.021. [DOI] [PMC free article] [PubMed] [Google Scholar]
- Shi LH, Luo F, Woodward DJ, Chang JY. Basal ganglia neural responses during behaviorally effective deep brain stimulation of the subthalamic nucleus in rats performing a treadmill locomotion test. Synapse. 2006;59:445–457. doi: 10.1002/syn.20261. [DOI] [PubMed] [Google Scholar]
- Sturman MM, Vaillancourt DE, Shapiro MB, Metman LV, Bakay RA, Corcos DM. Effect of short and long term STN stimulation periods on parkinsonian signs. Mov Disord. 2008;23:866–874. doi: 10.1002/mds.21979. [DOI] [PubMed] [Google Scholar]
- Tabbal SD, Revilla FJ, Mink JW, Schneider-Gibson P, Wernle AR, de Erausquin GA, Perlmutter JS, Rich KM, Dowling JL. Safety and efficacy of subthalamic nucleus deep brain stimulation performed with limited intraoperative mapping for treatment of Parkinson’s disease. Neurosurgery. 2007;61:119–127. doi: 10.1227/01.neu.0000289725.97211.51. [DOI] [PubMed] [Google Scholar]
- Talairach J, Tournoux P. Co-planar stereotaxic atlas of the human brain. New York: Theime Verlag; 1988. [Google Scholar]
- Tanei T, Kajita Y, Nihashi T, Kaneoke Y, Takebayashi S, Nakatsubo D, Wakabayashi T. Changes in regional blood flow induced by unilateral subthalamic nucleus stimulation in patients with Parkinson’s disease. Neurol Med Chir (Tokyo) 2009;49:507–513. doi: 10.2176/nmc.49.507. [DOI] [PubMed] [Google Scholar]
- Temperli P, Ghika J, Villemure JG, Burkhard PR, Bogousslavsky J, Vingerhoets FJ. How do parkinsonian signs return after discontinuation of subthalamic DBS? Neurology. 2003;60:78–81. doi: 10.1212/wnl.60.1.78. [DOI] [PubMed] [Google Scholar]
- Videen TO, Campbell MC, Tabbal SD, Karimi M, Hershey T, Perlmutter JS. Validation of a fiducial-based atlas localization method for deep brain stimulation contacts in the area of the subthalamic nucleus. J Neurosci Methods. 2008;168:275–281. doi: 10.1016/j.jneumeth.2007.10.007. [DOI] [PMC free article] [PubMed] [Google Scholar]
- Walker HC, Watts RL, Schrandt CJ, Huang H, Guthrie SL, Guthrie BL, Montgomery EB. Activation of subthalamic neurons by contralateral subthalamic deep brain stimulation in Parkinson disease. J Neurophysiol. 2011;105:1112–1121. doi: 10.1152/jn.00266.2010. [DOI] [PMC free article] [PubMed] [Google Scholar]
- Woods RP, Cherry SR, Mazziota JC. Rapid automated algorithm for aligning and reslicing PET images. J Comput Assist Tomogr. 1992;16:620–633. doi: 10.1097/00004728-199207000-00024. [DOI] [PubMed] [Google Scholar]
- Wu T, Wang L, Chen Y, Zhao C, Li K, Chan P. Changes of functional connectivity of the motor network in the resting state in Parkinson’s disease. Neurosci Lett. 2009;460:6–10. doi: 10.1016/j.neulet.2009.05.046. [DOI] [PubMed] [Google Scholar]