Abstract
Starch granule initiation is not understood, but recent evidence implicates a starch debranching enzyme, isoamylase, in the control of this process. Potato tubers contain isoamylase activity attributable to a heteromultimeric protein containing Stisa1 and Stisa2, the products of two of the three isoamylase genes of potato. To discover whether this enzyme is involved in starch granule initiation, activity was reduced by expression of antisense RNA for Stisa1 or Stisa2. Transgenic tubers accumulated a small amount of a soluble glucan, similar in structure to the phytoglycogen of cereal, Arabidopsis, and Chlamydomonas mutants lacking isoamylase. The major effect, however, was on the number of starch granules. Transgenic tubers accumulated large numbers of tiny granules not seen in normal tubers. These data indicate that the heteromultimeric isoamylase functions during starch synthesis to suppress the initiation of glucan molecules in the plastid stroma that would otherwise crystallize to nucleate new starch granules.
Despite progress in understanding the growth of plant starch granules (1, 2), the process by which these semicrystalline structures are initiated remains a mystery. It has been suggested that the initial crystallization is a spontaneous event (3), but it is also clear that it is under genetic control because the typical number of granules per plastid differs between species and between types of organ (4).
There are indications that a type of starch-debranching enzyme, isoamylase, may influence granule initiation. Mutations that reduce or eliminate isoamylase activity in cereals (sugary1 mutants; refs. 5-7), Arabidopsis (dbe1 mutant; ref. 8), and the unicellular green alga Chlamydomonas (sta7 and sta8 mutants; refs. 9-12) result in the replacement of some or all of the starch by a soluble glucan, phytoglycogen. This glucan is more highly branched than amylopectin (the main component of the starch granule), and cannot crystallize to form a granule. Isoamylase-deficient mutants of cereals also have increased numbers of starch granules in the endosperm (5, 7, 13). Burton et al. (5) showed that, in sugary1 barley, there is increased granule initiation at the start of endosperm development. They suggested that isoamylase may play a role in suppressing the initiation of new glucan polymers, from which either new starch granules or phytoglycogen particles might arise.
The effect of loss of isoamylase on granule number in cereal endosperm could be very indirect, and therefore not informative about the normal process of initiation. The increase in granule number might, for example, be a secondary consequence of the accumulation of large amounts of soluble glucan, or of the significant alterations in activities of other glucan-metabolizing enzymes reported in the mutants (5, 14, 15). To provide definitive information about the role of isoamylase in granule initiation, we have examined the effects of reducing isoamylase activity in potato tubers.
We have shown recently that there are three distinct, evolutionarily conserved isoforms of isoamylase in several species of plants, including potato, Arabidopsis, and wheat (16). In potato, two of these isoforms comprise a heterotetramer responsible for most of the isoamylase activity detectable in the tuber. Here we report that reduction in activity of this heterotetrameric enzyme results in a massive proliferation of numbers of starch granules in the tuber, in the absence of large accumulations of phytoglycogen, changes in amylopectin structure, or changes in other glucan-metabolizing enzymes. These results demonstrate that isoamylase is directly involved in the control of starch granule number, and shed light on the nature of this process.
Materials and Methods
Plant Material. Plants were grown in soil-based compost in a greenhouse with a minimum temperature of 12°C and supplementary lighting in winter.
Plant Transformation. A 1.60-kb NcoI fragment of the cDNA of Stisa1 (GenBank accession no. AY132996) and a 2.8-kb NcoI fragment of the cDNA of Stisa2 (GenBank accession no. AY132997) were each cloned in the antisense orientation between a double cauliflower mosaic virus 35S promoter and terminator in the binary vector pBIN19. Transformation was as described (17, 18). The presence of the selectable marker gene was confirmed by PCR on genomic DNA extracted from leaves.
RNA Gel Blots. Total RNA was extracted from 1-2 g fresh weight of tuber (19), separated on denaturing agarose gels (25 μg per track), and blotted onto nitrocellulose (20). Blots were hybridized with cDNA probes labeled with [32P]dCTP by random priming. Filters were washed at high stringency (0.1× SSC, 5 g/liter SDS at 65°C) and exposed to Biomax-MS film (Kodak). The probes for Stisa1 and Stisa2 were the cDNA fragments used in the antisense constructs (see above). Other probes were a 1.2-kb XhoI fragment of the cDNA of Stisa3 (GenBank accession no. AY132998) and a 1.8-kb EcoRI fragment of the Ubiquitin cDNA from Antirrhinum majus (used as a loading control).
Gel Electrophoresis and Immunoblotting. Native, β-limit dextrin-PAGE, SDS/PAGE, and immunoblots were performed as described (18, 21).
Electron Microscopy. Samples were sputter-coated with gold and viewed with a Phillips (Eindhoven, The Netherlands) XL30 Field Emission Gun scanning electron microscope at 3 kV.
Extraction, Fractionation, and Structural Analysis of Starch and Phytoglycogen. The starch content of tubers was measured after hydrolysis to glucose by α-amyloglucosidase (22). For starch extraction, freshly harvested tubers were either extracted immediately or frozen at -20°C for up to 1 month before extraction. Tubers were homogenized in 50 mM Tris (pH 7.5)/10 mM EDTA/0.5 g/liter Na metabisulfite at 4°C and filtered through four layers of cheesecloth. The filtrate was centrifuged at 20,000 × g and 4°C for 15 min. The pellet was washed three times in extraction medium then twice in acetone by suspension and centrifugation as above, then dried in air. Granule numbers were estimated by counting those in a 0.0125-μl samples of a suspension of 10 mg/ml of starch, by using a hemocytometer cell and an optical microscope (5).
For preparation of very small granules, ≈3 g of starch was placed in a 10-μm-mesh bag, suspended in a beaker containing 1.5 liters of water, and stirred for 10 h. After this, almost all granules of <10 μm were outside the bag. The bag was removed, and the suspended granules in the beaker were allowed to settle under gravity for 5 h. Material that did not settle, designated very small granules, was collected by centrifugation. Material that remained in the bag was designated large granules, and material of <10 μm that settled in 5 h was designated medium granules.
Phytoglycogen was extracted by homogenization of frozen tubers in water at 0°C in a sharp-bladed blender. After thawing at 4°C, the homogenate was centrifuged at 20,000 × g and 4°C for 15 min. The supernatant was immediately heated to 100°C for 5 min, centrifuged, and mixed with three volumes of methanol. After incubation at 4°C for 16 h, precipitated phytoglycogen was collected by centrifugation at 20,000 × g for 15 min. Phytoglycogen was assayed as for starch, and content expressed on the basis of protein in the initial supernatant. Phytoglycogen extraction from su1 maize was as described (6).
Determination of starch composition and glucan chain-length distributions were as described (23, 24).
Results
Generation of Transgenic Plants with Reduced Isoamylase Activity. We attempted to generate transgenic potato plants in which the activity of either Stisa1 or Stisa2 was reduced, by using Stisa1 and Stisa2 antisense constructs introduced into disks of potato tuber (Solanum tuberosum cv. Desiree) by means of Agrobacterium-mediated transformation. Developing tubers of transformed plants were initially screened for isoamylase activity by native gel analysis. The isoamylase activity attributable to the Stisa1 and Stisa2 proteins appears as a slow-migrating blue band on β-limit dextrin-containing native gels stained with iodine (16).
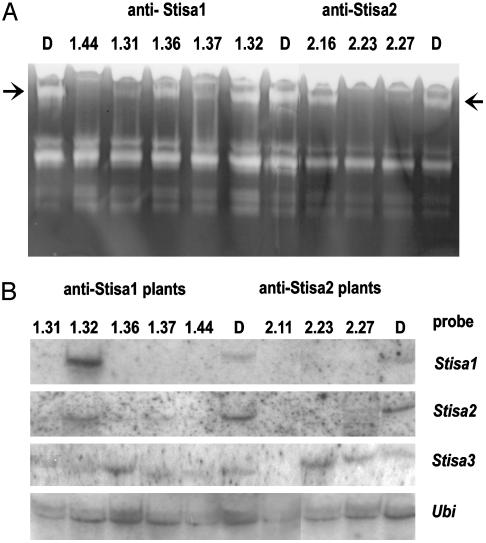
Consistent, moderate, or severe reductions in the intensity of the Stisa1/Stisa2 isoamylase band relative to that of control plants (untransformed cv Desiree), grown at the same time under the same conditions, were observed in plants transformed with either Stisa1 or Stisa2 antisense constructs (referred to as Stisa1 and Stisa2 antisense plants). Four of 45 independently derived Stisa1 antisense lines (lines 1.31, 1.36, 1.37, and 1.44) and 3 of 25 independently derived Stisa2 antisense lines (lines 2.11, 2.23, and 2.27) showed such reductions (Fig. 1A and data not shown). These lines were studied further, together with, as control lines, plants from the Stisa1 and Stisa2 antisense transformations that showed no reduction in the intensity of the isoamylase band relative to untransformed plants (lines 1.32 and 2.16).
Fig. 1.
Isoamylase activity and transcript levels. (A) Native, β-limit dextrin-containing acrylamide gels were loaded with soluble extracts of tuber. Each lane contained material from 10 mg fresh weight. After electrophoresis, gels were incubated at pH 6.5 and 37°C for 2 h, then stained with iodine solution. Arrows indicate the isoamylase band. The intensity of the band in antisense lines Stisa1.31, 1.36, 1.37, 1.44, 2.23, 2.11, and 2.27 relative to that in Desiree varied from one experiment to another, but in several different batches of plants the intensity in these lines was always lower than in the control lines. Two transgenic lines in which there was no apparent reduction in the intensity of the band (Stisa1.32 and Stisa2.16) were used as controls in some subsequent experiments. (B) Denaturing agarose gels were loaded with total RNA. Blots were probed for Stisa1, Stisa2, Stisa3, and, as a loading control, Ubiquitin, as indicated. For anti-Stisa1 plants, RNA from lines 1.31, 1.36, 1.37, 1.44, and the control line 1.32 is shown. For anti-Stisa2 plants, RNA from lines 2.11, 2.23, and 2.27 is shown. Lanes marked D are untransformed Desiree.
Levels of Stisa1 and Stisa2 Transcripts and Proteins Are Reduced in Transgenic Plants. RNA gel blots showed that the Stisa1 antisense lines with reduced isoamylase activity contained no detectable Stisa1 transcript (Fig. 1B), whereas the control line 1.32 (in which isoamylase activity was still present; Fig. 1B) contained Stisa1 transcript levels equivalent to those of untransformed Desiree tubers (Fig. 1B, lanes D). Similarly, the Stisa2 antisense lines with reduced isoamylase activity contained no detectable Stisa2 transcript. All lines had detectable Stisa3 transcript, and differences in levels could be accounted for by differences in RNA loading revealed by hybridization to a Ubiquitin cDNA probe. More surprisingly, Stisa1-silenced lines showed greatly reduced Stisa2 transcript levels compared to Desiree and the 1.32 control line, and silenced Stisa2 antisense lines showed no detectable Stisa1 transcript (Fig. 1B).
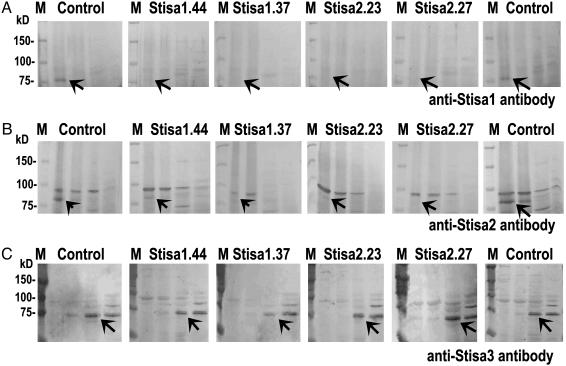
To examine the levels of isoamylase proteins in tubers of the transgenic lines, we used isoform-specific antisera raised to peptides from each isoform (16). The proteins were not detectable by immunoblotting of crude extracts of potato, but could be detected after concentration by ammonium sulfate precipitation. Immunoblotting of a series of ammonium-sulfate precipitations of soluble extracts of tubers revealed that levels of both Stisa1 and Stisa2 proteins were reproducibly and strongly reduced in the four Stisa1 antisense lines and the three Stisa2 antisense lines with reduced isoamylase activity. Levels of the third isoform of isoamylase, Stisa3, were unaffected (Fig. 2).
Fig. 2.
Levels of Stisa1, Stisa2, and Stisa3 protein in transgenic tubers. Crude, soluble extracts of tubers were fractionated by ammonium sulfate precipitation. Precipitated proteins were redissolved, subjected to SDS/PAGE, then blotted. Blots were prepared for three different tubers from each line, each from a different plant. Results for one tuber from each line are shown: the same result was obtained for the other two tubers. The line of potatoes from which the extract was made is indicated above each panel. M, molecular markers, mass in kDa. (A) Blots developed with Stisa1 antiserum. Each panel shows proteins from (left to right) the 0-20%, 20-30%, 30-40%, and 40-50% ammonium sulfate precipitates. The control line was Desiree (tubers from two different plants in the right and left control panels). The arrow indicates the position of the band attributable to Stisa1. Note that this band is very much reduced in intensity relative to the control in all four antisense lines. (B) Blots developed with Stisa2 antiserum. Each panel shows proteins from (left to right) the 0-20%, 20-30%, 30-40%, and 40-50% ammonium sulfate precipitates. The control line was Desiree (tubers from two different plants in the right and left control panels). A band attributable to Stisa2 is present in proteins from the 0-20% ammonium sulfate precipitate (arrow) and in some cases the 20-40% ammonium sulfate precipitate. Note that this band is very much reduced in intensity relative to the controls in all four antisense lines. The band above the arrowed band is not associated with isoamylase activity (16). (C) Blots developed with Stisa3 antiserum. Each panel shows proteins from (left to right) the 0-20%, 20-30%, 30-40%, and 40-50% ammonium sulfate precipitates. The control lines were isa2.16 (left) and isa1.32 (right). A band attributable to Stisa3 is present in proteins from the 30-40% (arrow) and 40-50% ammonium sulfate precipitates and, in some cases, the 20-30% ammonium sulfate precipitate. Note that this band is similar in intensity relative to the controls in all four antisense lines.
Activities of Other Starch-Metabolizing Enzymes Are Unaffected in Transgenic Plants. There were no consistent differences between tubers of control and low-isoamylase lines in maximum catalytic activities of nine enzymes involved in starch metabolism: soluble and granule-bound starch synthase, starch-branching enzyme, starch phosphorylase, d-enzyme, maltase, limit-dextrinase, α-amylase, and β-amylase (Table 2, which is published as supporting information on the PNAS web site). Native gel analysis also showed no consistent differences between control and low-isoamylase lines in the intensities of bands representing glucan-degrading activities other than isoamylase (data not shown).
Transgenic Tubers Accumulate Small Amounts of Phytoglycogen. We examined whether tubers with reduced isoamylase activity contained elevated amounts of soluble glucan. To avoid solubilization of glucan from damaged starch granules, tubers were extracted in a sharp-bladed electric blender. This did not achieve total cell breakage, but, unlike other forms of homogenization, it did not damage starch granules. Soluble polyglucan was separated from glucose and small malto-oligosaccharides in the soluble extract by precipitation with methanol. Glucan content was expressed on the basis of protein in the same extract (Table 1).
Table 1. Glucan contents of transgenic potato tubers.
| Line
|
||||||||
|---|---|---|---|---|---|---|---|---|
| Desiree | 1.32 (control) | 1.31 | 1.37 | 1.44 | 2.16 (control) | 2.23 | 2.27 | |
| Starch content, mg/g FW | 154 ± 14 | 141 ± 13 | - | 136 ± 9 | 116 ± 8 | 160 ± 11 | - | 141 ± 3 |
| Soluble glucan content, μg/mg | 2.43 ± 0.32 | 1.13 ± 0.31 | 6.16 ± 0.65 | 194 ± 34 | 460 ± 65 (6) | 4.05 ± 0.81 | 2.11 ± 0.30 | |
| Number of starch granules, mg−1 starch | 0.19 × 10⁶ ± 0.04 × 10⁶ | - | - | - | 2.99 × 10⁶ ± 0.57 × 10⁶ | - | - | 0.45 × 10⁶ ± 0.05 × 10⁶ |
Measurements of starch content are means ± SE of values from three or four tubers (two separate tissue samples of each), each from a different, mature plant. The value for isa 1.44 is statistically significantly different from the value for the control line Stisa 2.16 (P < 0.02, Student's t) but not from values for cv Desiree and the control line Stisa 1.32. Soluble glucan contents are means ± SE of three values, from tubers from three different plants, except for the value for isa 1.44, which is the mean ± SE of six values. Values are expressed on the basis of soluble protein (see Materials and Methods). Numbers of granules were measured with a hemocytometer cell. Values are means ± SE of measurements on three separate suspensions, each of starch harvested from a different plant. Total numbers of granules counted were ≈ 5,500 for line 1.44, 2,500 for line 2.27, and 1,000 for cv Desiree. FW, fresh weight.
Levels of soluble glucan in tubers of all of the Stisa2 antisense lines and in line Stisa1.32 were similar to those in control lines. Tubers of lines Stisa1.37 and 1.44 contained 100- to 200-fold more soluble glucan than the controls. Amounts of soluble glucan were very small relative to the amount of starch. From measurements of protein content of tubers, we estimated the soluble glucan content of tubers of line Stisa1.44 to be 1.5% of the starch content (data not shown).
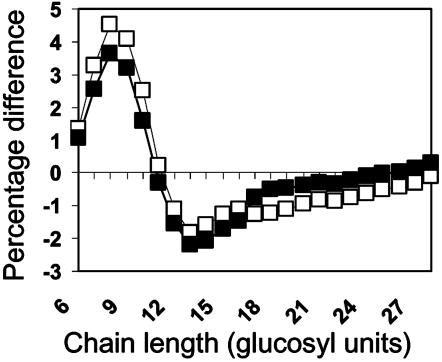
Purified soluble glucan stained red with iodine, and the maximum wavelength of absorption of the iodine complex was 440 nm. This value is much lower than that for amylopectin from potato starch (see Fig. 5) and indicates that the soluble glucan is more highly branched than amylopectin. Analysis of the chain-length distribution of the soluble glucan by fluorescence-assisted PAGE showed that it contained a much higher proportion of short chains than potato amylopectin and was similar to phytoglycogen from the sugary1 mutant of maize (Fig. 3).
Fig. 5.
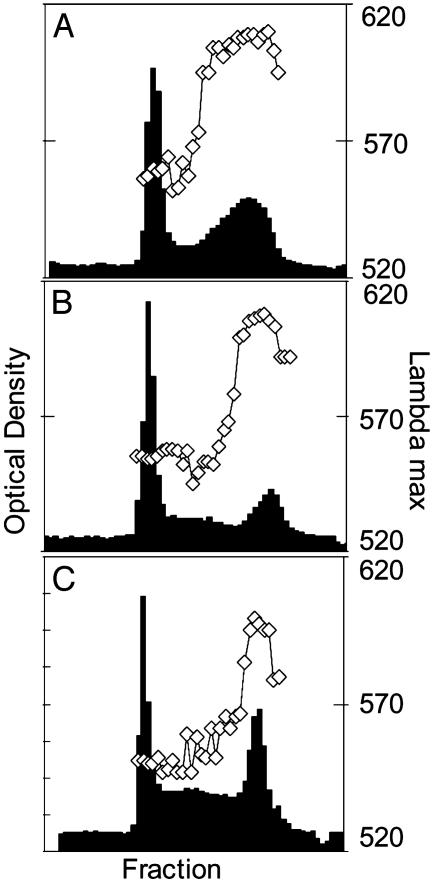
Effects of loss of isoamylase activity on starch composition. The size distribution and relative amounts of amylose and amylopectin were examined by gel permeation chromatography on a 2-m column of Sepharose CL2B. Bars represent absorbance at 595 nm of the glucan-iodine complex from individual fractions collected from the column. The initial peak is amylopectin; the second peak is amylose. Data points joined by a line are the wavelength of maximum absorbance of the glucan-iodine complex (λmax). Data are representative of results obtained from at least two batches of starch, each from separately grown plants. See Materials and Methods for definition and preparation of very small granules. (A) Unfractionated starch from Desiree (control). Results for unfractionated starch from all isa lines were similar. (B) Very small granules from antisense line Stisa1.44. (C) Very small granules from antisense line Stisa2.27.
Fig. 3.
Analysis of the chain-length distribution of soluble glucan. Analysis was by fluorophore-assisted PAGE of debranched soluble glucan using an Applied Biosystems 373A DNA sequencer (23, 24). Areas of peaks representing chains of between 6 and 28 glucose units (numbers on x axis) were summed, the areas of individual peaks were expressed as a fraction of this sum, and the means of these values were calculated from replicate samples. For each chain length, the mean value for the test sample was subtracted from the mean value for the control sample to give the percentage molar difference. Thus, the zero line on the y axis represents the chain length distribution of the control sample, unfractionated starch from line isa1.32. The plotted lines represent the percentage molar differences from the control for samples of soluble glucan from the Stisa1 antisense line 1.44 (filled squares) and phytoglycogen from su1 maize kernels (open squares). Note that soluble glucan from 1.44 is enriched in chains of 7-10 and depleted in chains of >12 glucosyl units relative to starch, and is similar to maize phytoglycogen.
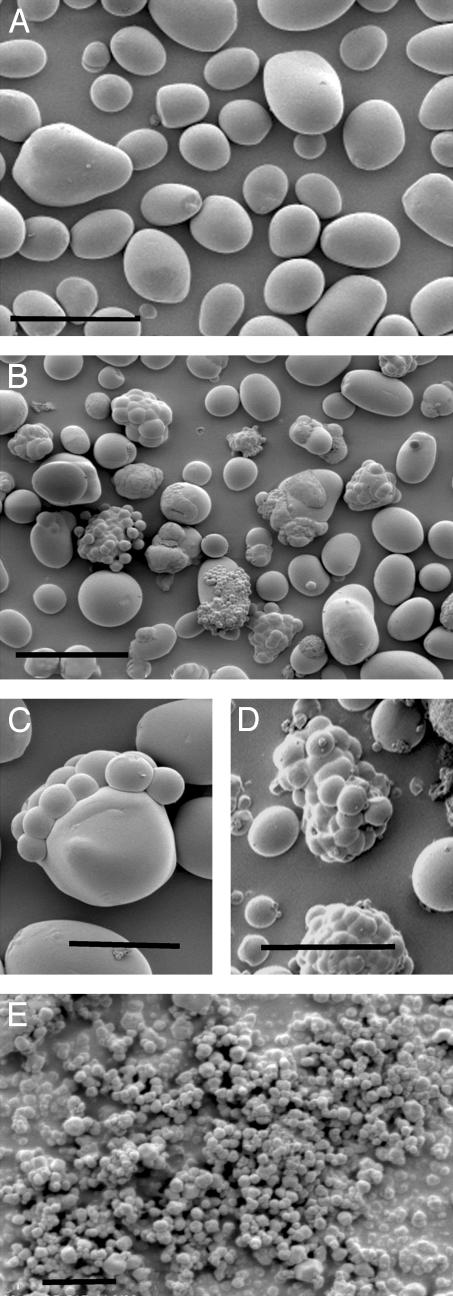
Transgenic Tubers Contain Large Numbers of Tiny Starch Granules. Starch contents of lines with low isoamylase were either not altered significantly or were slightly reduced relative to those of control lines (Table 1). However, granule size and number were altered in all of the low-isoamylase lines. The bulk of the extracted starch consisted of granules identical in appearance to those of control lines, but in addition there was a proliferation of very small granules, many of which were attached to the surfaces of large starch granules (Fig. 4). The number and size of small granules varied between the transgenic lines. In the Stisa2 low-isoamylase lines and in line Stisa1.36, most of the very small granules were >≈1 μm in diameter. Lines Stisa1.44, 1.37, and 1.31 contained more, smaller granules than the other lines, and there was large population of very small granules (in the range 0.2-0.5 μm) that was not attached to other granules (Fig. 4). Almost no granules in this size range were found in control and other transgenic lines. The clumping of very small granules made it impossible to quantify accurately the granule size and number in the low-isoamylase lines. We made a crude estimate of granule numbers by using a hemocytometer cell. This underestimates numbers of granules in the transgenic lines because of clumping and the Brownian motion of the smallest granules. Even so, lines Stisa2.27 and Stisa1.44 were estimated to have >2 times and >15 times as many granules per weight of starch, respectively, as the control line (Table 1). Further information on amounts of very small granules is provided in Table 3, which is published as supporting information on the PNAS web site.
Fig. 4.
Starch granules isolated from control and transgenic tubers. (A) Control line Stisa1.32. (Scale bar is 50 μm.) (B) Antisense line Stisa1.44. (Scale bar is 50 μm.) (C) Antisense line Stisa2.27. (Scale bar is 20 μm.) (D) Granule clusters from antisense line Stisa1.44. (Scale bar is 20 μm.) (E) Very small starch granules isolated from starch of antisense line Stisa1.37. (Scale bar is 2 μm.) No equivalent material was found in starch of control tubers.
Very small granules were separated from bulk starch preparations by settlement in water (see Materials and Methods). They had essentially the same composition as normal starch, containing both amylopectin and amylose. The ratios and molecular masses of these two polymers were somewhat different from those of unfractionated starch and large starch granules (Fig. 5). There were no differences in the chain length distribution of amylopectin (CLD) between Stisa1, Stisa2, and control lines for bulk starch preparations, or for size-fractionated granules other than the very small granules (Fig. 7, which is published as supporting information on the PNAS web site). Thus the CLD of 93% or more of the starch in all of the transgenic lines was unaltered. The CLD of very small starch granules of Stisa2 lines was also very similar to that of control lines. The CLD of very small granules from lines Stisa1.44, 1.37, and 1.31 differed somewhat from that of Stisa2 and control lines (Supporting Text, which is published as supporting information on the PNAS web site, and data not shown). However, this does not imply that loss of isoamylase affected CLD in these three lines. Granules of 0.2-0.5 μm are likely to differ substantially from larger granules in their organization, and hence the surfaces they present for amylopectin synthesis, because they are too small to have a “growth ring” structure (25). Differences in CLD between these and the larger, 1- to 5-μm granules of control and Stisa2 lines may thus be a consequence of differences in granule size rather than isoamylase activity.
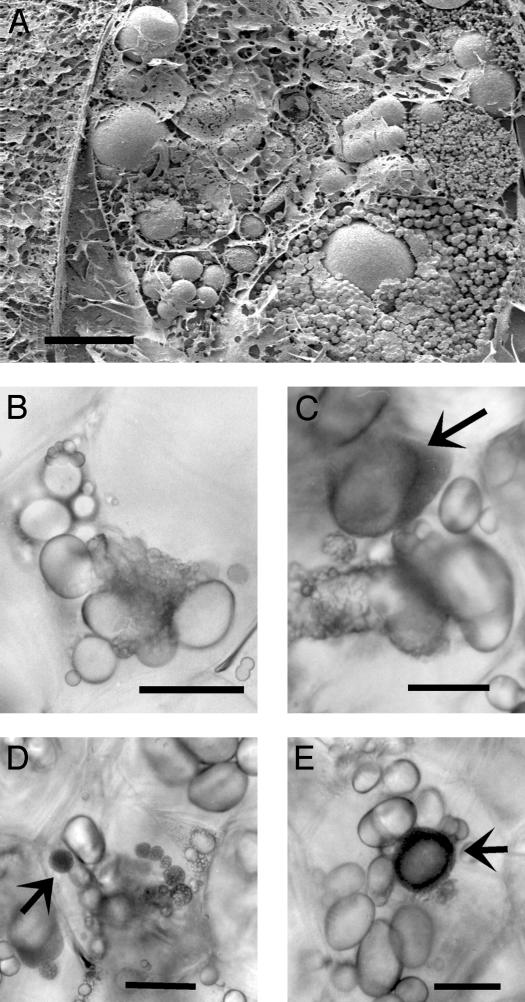
Individual, intact cells in fresh sections of tubers of Stisa1.44 contained amyloplasts with wide ranges of sizes and numbers of starch granules (Fig. 6). Amyloplasts contained either single, large granules with no associated small granules, large granules with attached smaller granules, or large granules surrounded by very small, apparently unattached granules (undergoing Brownian motion). Some amyloplasts appeared to contain only very small granules undergoing Brownian motion.
Fig. 6.
Presence of very small granules in amyloplasts of tubers of antisense line Stisa1.44. (A) Frozen pieces of freshly harvested tuber were cracked, coated, and viewed with the scanning electron microscope. Clusters of very small granules of different average sizes can be seen around larger starch granules within individual amyloplasts in a single cell. (Scale bar represents 10 μm.) (B-E) Intact cells within fresh, thick sections of tuber were viewed with a light microscope. Clusters of small granules occur in cells that also contain apparently normal, large granules. In some cells, very small granules undergoing Brownian motion give rise to dark amyloplasts (illustrative examples shown by arrows). (Scale bars represent 40 μm.) Equivalent sections from Desiree tubers contained no granule clusters or very small granules (data not shown).
Discussion
Regardless of whether they were transformed with the Stisa1 or the Stisa2 antisense construct, all of the transgenic potato plants with strongly reduced activity of isoamylase showed large reductions in amounts of both the Stisa1 and Stisa2 transcripts and their protein products. It could be argued that this effect is caused by nonspecificity of the antisense constructs, such that the Stisa1 and the Stisa2 antisense constructs both silenced both Stisa1 and Stisa2. However, neither the Stisa1 nor the Stisa2 antisense construct affected the level of transcript of Stisa3. Because Stisa1 has a higher level of nucleotide identity with Stisa3 than Stisa2, a lack of specificity of the Stisa1 construct would be expected to result in silencing of Stisa3 as well as Stisa2. Because this did not happen, a regulatory mechanism that coordinates the transcript levels of Stisa1 and Stisa2 seems the more likely explanation for the reduction in both transcripts. If the level of one is reduced through expression of an antisense construct, the level of the other also falls. Such a regulatory mechanism could ensure that the two isoforms are produced in comparable amounts, consistent with their operation together in a multimeric enzyme.
The most striking effect of reducing isoamylase activity, apparent in all of the lines with reduced activity, was a proliferation of small granules. Proliferation of granules was greatest in lines that also accumulated small amounts of phytoglycogen, but it also occurred in lines with no measurable phytoglycogen. In all of the transgenic lines with reduced isoamylase activity, small granules occurred in the same tuber cells, and often in the same amyloplasts, as apparently normal, large granules.
These results are consistent with a direct role for isoamylase in controlling the frequency of initiation of starch granules in the stroma during starch synthesis. Granule proliferation occurred in isoamylase-deficient lines regardless of whether they also accumulated phytoglycogen, and in the absence of changes in either activities of other glucan-metabolizing enzymes or the chain-length distribution of amylopectin. Our results support the idea that isoamylase acts by limiting or preventing the initiation of new glucan molecules in the stroma (5). Where such glucans arise, they can nucleate crystallization and thus give rise to new starch granules. Depending on the rate and extent of generation of new glucans, and perhaps on conditions in the stroma, some may give rise to phytoglycogen particles rather than starch granules.
It has been suggested that isoamylase acts not on glucan precursors in the stroma, but on a soluble precursor of amylopectin (preamylopectin). In this “glucan trimming” model, debranching by isoamylase is necessary to convert preamylopectin into a polymer competent to crystallize onto the nascent starch granule (1). If this view were correct, the glucan precursors of new starch granules and phytoglycogen particles in isoamylase-deficient plants would be preamylopectin molecules. However, granule proliferation was not associated with changes in the chain-length distribution of amylopectin in our transgenic lines. This offers no support for the idea that phytoglycogen and new starch granules arise as a consequence of disrupted amylopectin synthesis; indeed, the number of crystallization-competent units actually increases in isoamylase-deficient plants. The nature of the glucan on which isoamylase normally acts, and the conditions that determine its fate in the absence of this action, await further research.
We suggest that heteromultimeric isoamylases may be of universal importance in controlling starch granule initiation in starch-synthesizing organisms. Our results from potato show that control of granule initiation is a specific function of a heteromultimeric isoamylase containing the Stisa1 and Stisa2 isoforms: the Stisa3 isoform is unable to compensate for the loss of this heteromultimeric enzyme and may be involved in starch degradation rather than synthesis (16). Genes encoding isa1- and isa2-like isoforms are present in a broad range of plant species (16). The dbe1 mutation of Arabidopsis affects Atisa2 (16), and results in both loss of the assayable isoamylase activity and the accumulation of phytoglycogen as well as starch (8). The sequence of Atisa2, like that of Stisa2, indicates that the protein may not possess activity. Thus, as in potato, the Arabidopsis isoamylase that functions in starch synthesis may be a heteromultimer of isa1 and isa2 proteins. In Chlamydomonas, a mutation at the STA7 locus eliminates assayable activity, and a mutation at the STA8 locus reduces the activity and changes the apparent molecular mass of a multimeric enzyme (9-12). The isoamylases of cereal endosperms have not been shown to be heteromultimeric, and mutations leading to phytoglycogen accumulation appear to lie in genes encoding isoamylase isoforms most similar to Stisa1 (16). However, these isoamylases are multimeric (26), and the presence of genes encoding isa2-like proteins in cereals (16) raises the possibility that these enzymes too may be heteromultimers of isa1 and isa2.
Supplementary Material
Acknowledgments
We thank Kim Findlay (John Innes Centre) for advice on microscopy, and Dr. Sam Zeeman (University of Bern, Bern, Switzerland) for useful discussions. This work was funded by Zeneca (Syngenta, Basel). The John Innes Centre is supported by a Core Strategic Grant from the Biotechnology and Biological Sciences Research Council.
This paper was submitted directly (Track II) to the PNAS office.
References
- 1.Myers, A. M., Morell, M. K., James, M. G. & Ball, S. G. (2000) Plant Physiol. 122, 989-997. [DOI] [PMC free article] [PubMed] [Google Scholar]
- 2.Smith, A. M. (1999) Curr. Opin. Plant Biol. 2, 223-229. [DOI] [PubMed] [Google Scholar]
- 3.Badenhuizen, N. P. (1969) The Biogenesis of Starch Granules in Higher Plants (Appleton-Century-Crofts, New York).
- 4.Shannon, J. C. & Garwood, D. L. (1984) in Starch: Chemistry and Technology, eds. Whistler, R. L., BeMiller, J. N. & Paschall, E. F. (Academic, San Diego), pp. 25-86.
- 5.Burton, R., Jenner, H., Carrangis, L., Fahy, B., Fincher, G., Hylton, C., Laurie, D., Parker, M., Waite, D., van Wegen, S., et al. (2002) Plant J. 31, 97-112. [DOI] [PubMed] [Google Scholar]
- 6.James, M. G., Robertson, D. S. & Myers, A. M. (1995) Plant Cell 7, 417-429. [DOI] [PMC free article] [PubMed] [Google Scholar]
- 7.Kubo, A., Fujita, N., Harada, K., Matsuda, T., Satoh, H. & Nakamura, Y. (1999) Plant Physiol. 121, 399-409. [DOI] [PMC free article] [PubMed] [Google Scholar]
- 8.Zeeman, S. C., Umemoto, T., Lue, W. L., Au-Yeung, P., Martin, C., Smith, A. M. & Chen, J. (1998) Plant Cell 10, 1699-1711. [DOI] [PMC free article] [PubMed] [Google Scholar]
- 9.Mouille, G., Maddelein, M. L., Libessart, N., Talaga, P., Decq, A., Delrue, B. & Ball, S. (1996) Plant Cell 8, 1353-1366. [DOI] [PMC free article] [PubMed] [Google Scholar]
- 10.Dauvillée, D., Mestre, V., Colleoni, C., Slomianny, M. C., Mouille, G., Delrue, B., d'Hulst, C., Bliard, C., Nuzillard, J. M. & Ball, S. (2000) Plant Sci. 157, 145-156. [DOI] [PubMed] [Google Scholar]
- 11.Dauvillée, D., Colleoni, C., Mouille, G., Buléon, A., Gallant, D. J., Bouchet, B., Morell, M. K., d'Hulst, C., Myers, A. M. & Ball, S. (2001) Plant Physiol. 125, 1710-1722. [DOI] [PMC free article] [PubMed] [Google Scholar]
- 12.Dauvillée, D., Colleoni, C., Mouille, G., Morell, M. K., d'Hulst, C., Watteblad, F., Liénard, L., Devallé, D., Ral, J. P., Myers, A. M. & Ball, S. (2001) Plant Physiol. 125, 1723-1731. [DOI] [PMC free article] [PubMed] [Google Scholar]
- 13.Boyer, C., Daniels, R. R. & Shannon, J. C. (1977) Am. J. Bot. 64, 50-56. [Google Scholar]
- 14.Singletary, G. W., Banisadr, R. & Keeling, P. L. (1997) Plant Physiol. 113, 293-304. [DOI] [PMC free article] [PubMed] [Google Scholar]
- 15.Nakamura, Y., Umemoto, U., Takahata, Y., Komae, K., Amano, E. & Satoh, H. (1996) Physiol. Plant. 97, 491-498. [Google Scholar]
- 16.Hussain, H., Mant, A., Seale, R., Zeeman, S., Hinchliffe, E., Edwards, A., Hylton, C., Bornemann, S., Smith, A. M., Martin, C. & Bustos, R. (2002) Plant Cell 15, 133-149. [DOI] [PMC free article] [PubMed] [Google Scholar]
- 17.Marshall, J., Sidebottom, C., Debet, M., Martin, C., Smith, A. M. & Edwards, A. (1996) Plant Cell 8, 1121-1135. [DOI] [PMC free article] [PubMed] [Google Scholar]
- 18.Edwards, A., Marshall, J., Sidebottom, C., Visser, R. G. F., Smith, A. M. & Martin, C. (1995) Plant J. 8, 283-294. [DOI] [PubMed] [Google Scholar]
- 19.Prescott, A. G. & Martin, C. (1987) Plant Mol. Biol. Rep. 4, 219-224. [Google Scholar]
- 20.Martin, C., Carpenter, R., Sommer, H., Saedler, H. & Coen, E. S. (1985) EMBO J. 4, 1625-1630. [DOI] [PMC free article] [PubMed] [Google Scholar]
- 21.Zhu, Z. P., Hylton, C. M., Roessner, U. & Smith, A. M. (1998) Plant Physiol. 118, 581-510. [DOI] [PMC free article] [PubMed] [Google Scholar]
- 22.Smith, A. M. (1988) Planta 175, 270-279. [DOI] [PubMed] [Google Scholar]
- 23.Edwards, A., Fulton, D. C., Hylton, C. M., Jobling, S. A., Gidley, M., Roessner, U., Martin, C. & Smith, A. M. (1999) Plant J. 17, 251-261. [Google Scholar]
- 24.O'Shea, M. & Morell, M. K. (1996) Electrophoresis 17, 681-688. [DOI] [PubMed] [Google Scholar]
- 25.Pilling, E. & Smith, A. M. (2003) Plant Physiol. 132, 365-371. [DOI] [PMC free article] [PubMed] [Google Scholar]
- 26.Fujita, N., Kubo, A., Francisco, P. B., Nakakita, M, Harada, K., Minaka, N. & Nakamura, Y. (1999) Planta 208, 283-293. [DOI] [PubMed] [Google Scholar]
Associated Data
This section collects any data citations, data availability statements, or supplementary materials included in this article.


