Abstract
A scanning acoustic microscope (SAM) imaging system calculates and color codes speed of sound (SOS). We evaluated the SAM results for lymph node imaging and compared these results with those of light microscopy (LM). SAM showed normal structures and localized/diffuse lesions of the lymph node. Our results revealed that as a rule, soft areas such as cystic necrosis presented less SOS while harder areas such as coagulative necrosis, granulomas, and fibrosis exhibited greater SOS. SOS increased according to stromal desmoplastic reactions and cellular concentration. In neoplastic lesions, statistically significant differences in SOS were observed among scirrhous carcinomas, lymphomas, and medullary carcinomas. SAM provided the following benefits over LM: (1) images reflected the tissue elasticity of each lesion, (2) digitized SOS data could be statistically comparable, (3) images were acquired in a few minutes without special staining, (4) SAM images and echographic images were comparable for clinical ultrasound imaging study.
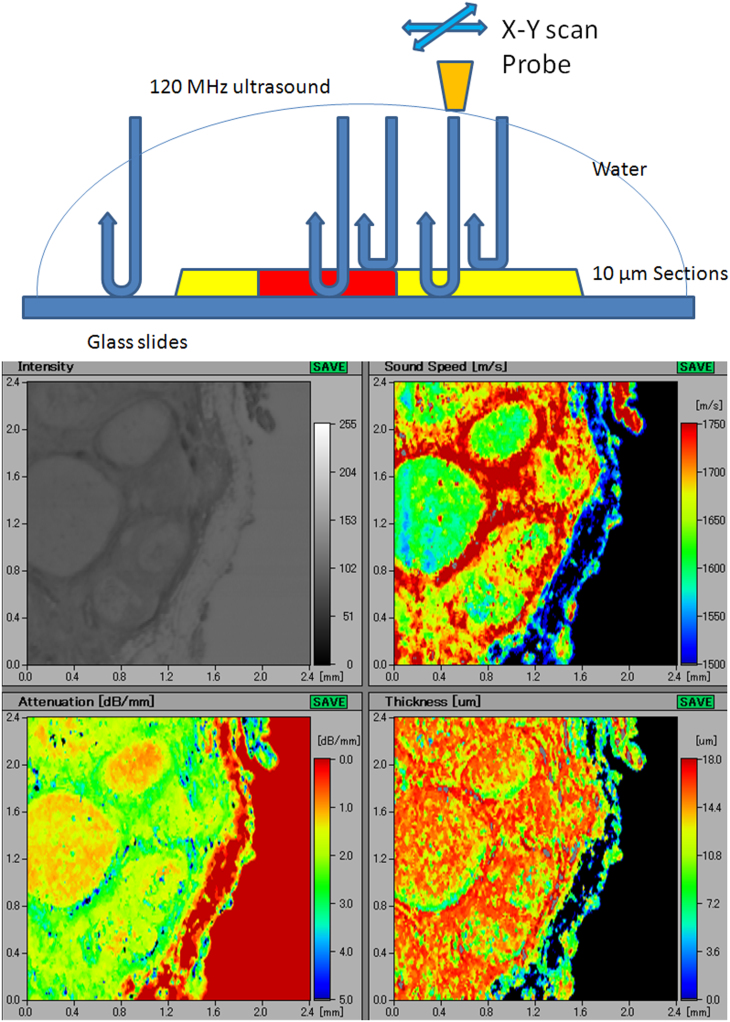
A scanning acoustic microscope (SAM) is a device that uses ultrasound waves (frequency, 80–120 MHz) to calculate the speed of sound (SOS) per square area in samples of selected tissue sections (Figures 1A and 1B). The data are digitized and color coded for display. As the SOS increases with increasing tissue hardness, this phenomenon is employed in SAM, thereby acquiring data regarding the elasticity of cells and tissues1,2. Echographic examination, known as echography, is an ultrasound-based diagnostic imaging technique and a standard procedure for imaging various organs such as liver, biliary tracts, pancreas, kidney, thyroid, breast, heart, blood vessels, urogenital organs, and lymph nodes (LNs). Since the 1980s, SAM has been used to investigate the acoustic properties of many organs and disease states such as myocardial infarction3, renal diseases4, aortic atherosclerosis5, diseases of ligaments6, and lungs7. To the best of our knowledge, very few studies have reported SAM imaging of LNs.
Figure 1.
A(upper) Principles of scanning acoustic microscopy (SAM) Ultrasonic waves, irradiated from the probe, reflect off the glass slide surface and return to the probe. These waves pass through 10–15 μm sample sections with different ultrasonic properties. The probe automatically scans the section to calculate the speed of sound through each area. B(lower) A screenshot obtained from the scanning acoustic microscopy imaging Acoustic intensity, speed of sound (SOS), attenuation, and thickness of the section are displayed on the screen. The vertical bar on the left and the horizontal bar at the bottom of each figure indicate the distance (mm) on the slide. The vertical colored column on the right side of the “Sound Speed” figure indicates the average SOS of each square area on the section. Similarly, the vertical colored columns in the “Attenuation” and “Thickness” figures indicate the attenuated intensity of sound per mm (dB/mm) and the thickness of each square area (μm), respectively.
Surface LN swelling can be easily and safely inspected by echography; however, its resolution is limited in revealing the precise structure of LNs as the frequencies, between 2 MHz and 18 MHz, used in diagnostic echography are rather low for the purpose of deep penetration.
We evaluated the resolution, observations and benefits of SAM for lymph node imaging and compared the results with those of light microscopy.
Results
SAM imaging of normal LNs and reactive lymphadenitis
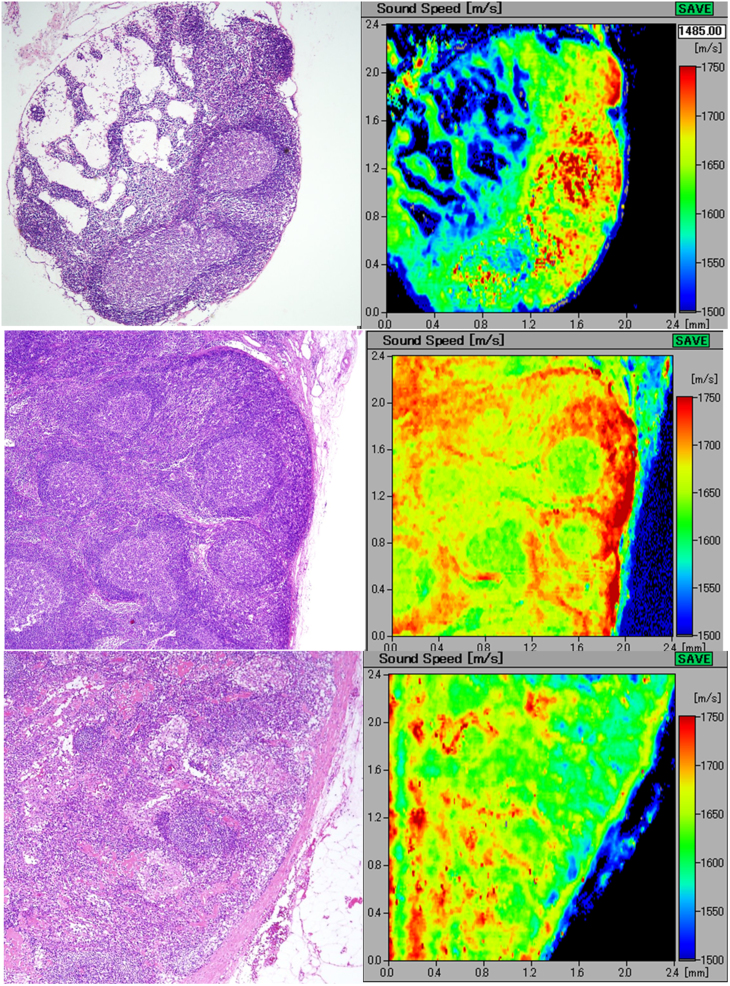
Figures 2A–C display LN images of normal and reactive lymphadenitis. The light microscopy images of H&E-stained tissue samples and their corresponding SAM images produced from SOS values through tissues are displayed.
Figure 2.
A(upper) A SAM image of a normal lymph node A small lymph node, 3.0 mm in diameter, comprising follicles, paracortex, medullary cords, and lymph sinus. The light microscopy image with H&E staining (left) and its corresponding acoustic image (right) well discriminating the above-mentioned structures. The speed of sound values of the lymphocyte-rich cortical area were higher than those of the cell-poor medullary area. B(middle) A reactive lymph node with follicular hyperplasia Scanning acoustic microscopy distinguishing several follicles with germinal centers with slightly lower speed of sound values than those of the surrounding thick mantle zones. C(lower) A lymph node with paracortical hyperplasia The paracortical areas with high endothelial venules form a meshwork structure and reveal higher speed of sound values than those of the follicles.
Figure 2A displays a normal, small node, 3.0 mm in size comprising basic LN structures such as follicles, paracortex, medullary cords, and lymph sinus. All of these structures were well visualized by SAM imaging. The cell-rich structures such as follicles and paracortex revealed higher SOS values compared with those of the cell-poor structures such as medullary cord and sinus.
The germinal centers revealed slightly lower SOS values than those of the surrounding mantle zones (Figure 2B). The areas of the paracortex with high endothelial venules (HEV) were differentiated from the follicles and exhibited higher SOS values (Figure 2C).
At the hilar portion, many lymph and blood vessels run through the adipose tissue and converge in the hilum. In our imaging study, the muscular blood vessels and the collagenous capsule revealed the highest SOS values in normal LNs.
SAM images of granulomatous lymphadenitis in sarcoidal and tuberculous tissues
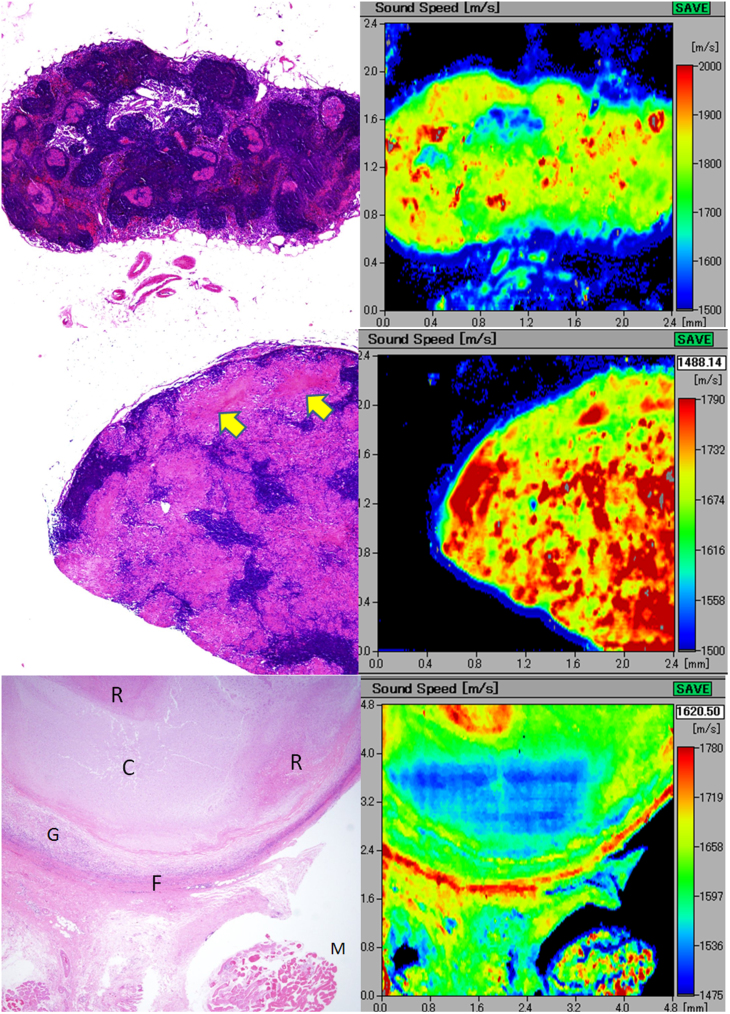
Sarcoidal granulomas were characterized by well-defined borders and a cohesive solid appearance8. The pinkish H&E-stained spotted granulomas demonstrated relatively higher SOS values compared with those of the surrounding lymphocyte-rich parenchyma (Figure 3A).
Figure 3.
A(upper) An elliptical lymph node with sarcoidal granulomas The scattered granulomas appear pinkish in color after H&E staining (left) and demonstrate rather higher speed of sound compared with that of the surrounding lymphocyte-rich parenchyma. B(middle) Tuberculous lymphadenitis with epithelioid granulomas The granulomatous areas fuse with each other to form confluent streams in H&E staining. In the corresponding acoustic image, the granulomatous areas show higher speed of sound (SOS) values compared with those of the intervening lymphoid cells. Focal necrotic areas (arrows) reveal lower SOS values than those of the granulomatous areas. C(lower) Tuberculous lymphadenitis with caseous necrosis. The caseous necrosis area consists of the cystic (C) and the cell debris-rich (R) areas. The corresponding scanning acoustic microscopy image shows lower speed of sound (SOS) values through the C area and higher SOS values through the R area, respectively. The surrounding granulomatous portion (G) demonstrates SOS as high as that of the R area. The thick fibrous capsule (F) and the skeletal muscle (M) display the highest SOS values in this section.
The tuberculous granulomas fused with each other to form confluent streams in H&E staining (Figure 3B). In SAM, non-necrotic granulomatous areas revealed higher SOS values compared with those of the intervening lymphoid cells. Some cell debris-rich, necrotic areas exhibited higher SOS values than those of the granulomatous area; however, the caseous necrotic areas with cystic changes revealed lower SOS values than those of the surrounding granulomatous or lymphocyte-rich areas (Figure 3C). The post inflammatory fibrous tissue surrounding granulomas fused to the outer capsule and revealed very high SOS values comparable to those of the skeletal muscles and debris-rich necrotic areas.
SAM imaging of malignant lymphoma
In cases of diffuse large B-cell lymphomas and Hodgkin lymphomas, the LNs were replaced by monotonous, large lymphoid cells and small lymphoid cells, respectively. The SAM images revealed corresponding homogenous masses with rather high SOS values (Figures 4A and 4B). Capsules were interrupted by lymphoid infiltrate that corresponded to the intermingled sound image; this image consisted of greater proportion of capsules and lesser proportion of lymphoma cells. An extracapsular invasive area into the adipose tissue revealed SOS values as high as those of the intracapsular area consisting of lymphoma cells (Figure 4A).
Figure 4.
A(upper) Diffuse, large B-cell lymphoma. the lymph node loses normal architecture and is replaced by dense monotonous lymphoma cells (left; H&E stain). The scanning acoustic microscopy image (right) shows homogenous structure with rather high speed of sound values. The lymphoma penetrates through the fibrous capsule (arrow) into the adjacent connective tissue. B(middle) Hodgkin lymphoma. the lymphoma cells densely infiltrate into the lymph or blood vessels and the outer adipose tissue. The invasive area of the lymphoma exhibits a homogenous higher speed of sound area. The slower speed spots within the lymphoma in the scanning acoustic microscopy image correspond to the residual fat cells. C(lower) Follicular lymphoma extending into the extracapsular adipose tissue. the lymph node is replaced by nodular lymphoma cells. In the right scanning acoustic microscopy image, nodular structures with lower speed of sound (SOS) values are surrounded by the lymphoma cell-rich mantles with higher SOS values.
In follicular lymphomas, it was difficult to visualize normal LN structures except some vague follicular structures. In SAM images, we observed the corresponding nodular structures with lower SOS values and cell-rich margin of the lymphoma with higher SOS values, respectively (Figure 4C).
SAM imaging of metastatic carcinoma in LNs
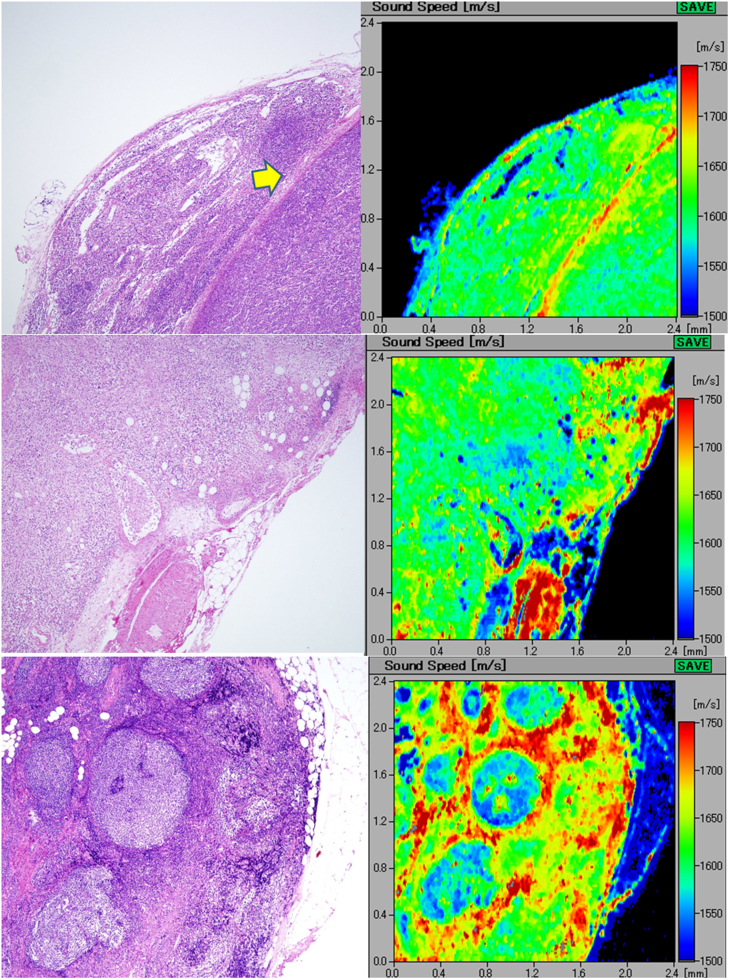
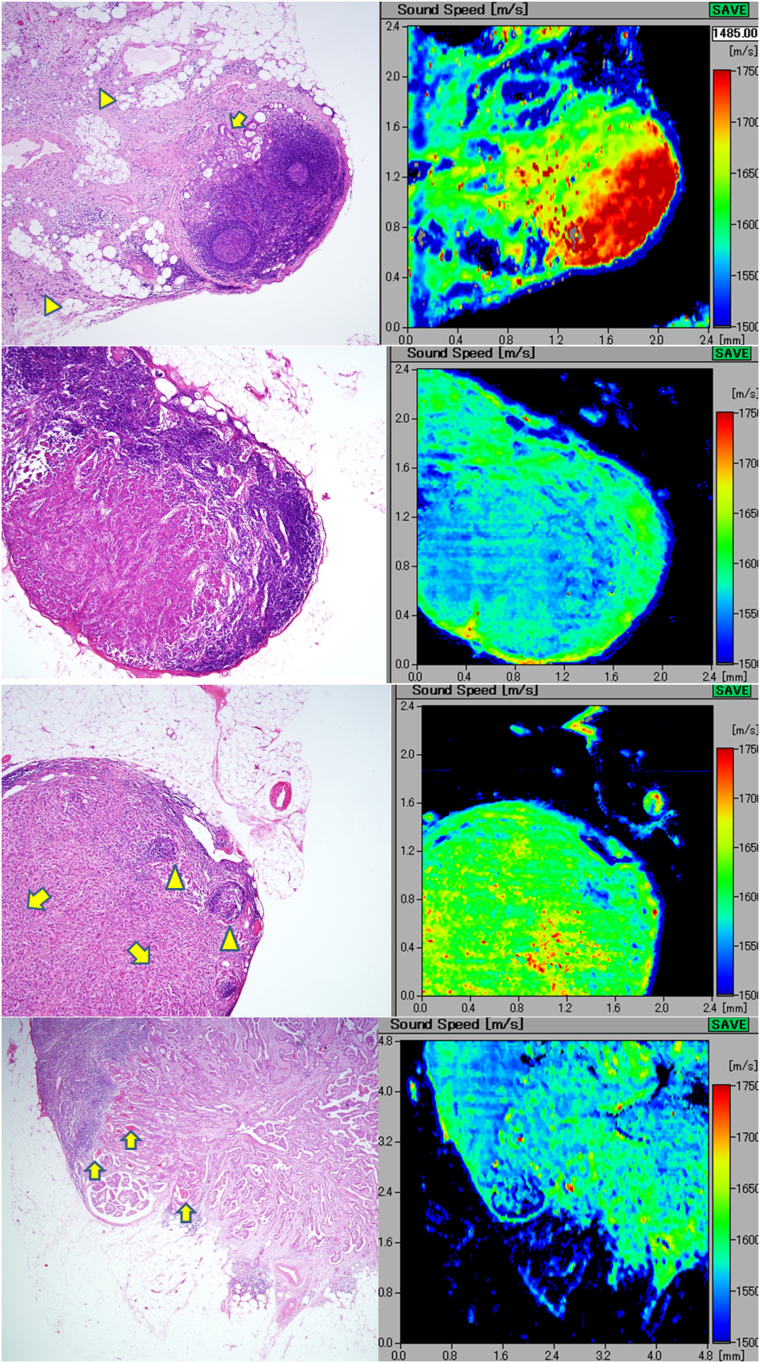
The metastatic carcinoma section demonstrated focal differences in SOS by SAM. Adenocarcinoma with intranodal metastases from the stomach with scirrhous invasion revealed lower SOS values compared with those of the lymphocyte-rich follicular area (Figure 5A). The extracapsular invasive area with desmoplastic reactions extended to form a fibrous meshwork in the outer adipose tissue. These desmoplastic areas revealed SOS values as high as those of walls of the lymphatic vessels and the fibrous capsule.
Figure 5.
A(top) Metastatic gastric adenocarcinoma involving extranodal connective tissue intranodal adenocarcinoma (arrow) exhibits speed of sound as high as the fibrous capsule. Extracapsular invasive areas with desmoplastic reaction (arrowheads) connect each other to form a fibrous meshwork in the adipose tissue. B(middle upper) Metastatic breast carcinoma with parenchyma-rich medullary area. the ductal carcinoma with medullary growth and scant stromal reaction displays speed of sound values lower than those of the surrounding lymphocyte-rich area. C(middle lower) Metastatic scirrhous carcinoma of the breast. scirrhous breast carcinoma shows trabecular structure (arrows) with desmoplastic reaction and higher speed of sound values than those of the subcapsular lymphocytes (arrowheads). D(bottom) Papillary thyroid carcinoma metastatic to the cervical lymph node. The metastatic papillary carcinoma from the thyroid forms papillary or follicular structures, focally containing thyroglobulin colloids. The carcinomatous areas with desmoplasia reveal speed of sound (SOS) values higher than those of the adjacent lymphocytes. The focal spots of highest SOS values in the carcinoma correspond to the thyroglobulins in the follicles (arrows). The follicular cystic space and surrounding adipose tissue demonstrated the lowest SOS values in the section.
Metastatic medullary carcinoma of the breast with scant stromal reaction (Figure 5B) demonstrated images contrasting with those of metastatic scirrhous carcinoma of the breast (Figure 5C). Moreover, the medullary carcinoma sections exhibited lower SOS values than the lymphocytes-rich follicular area, whereas the collagen-rich scirrhous carcinoma revealed higher SOS values than those of the lymphoid area.
Metastatic thyroid papillary carcinoma forming papillary and follicular structures demonstrated focal thyroglobulin colloids and revealed characteristic images by SAM; they exhibited higher SOS values, including spotty regions with even higher SOS values (Figure 5D). Papillary carcinoma demonstrated spicular-like desmoplastic reaction in areas where the SOS values were higher than those of the residual lymphoid tissue. The highest regions in the carcinoma corresponded to the thyroglobulin colloids.
Statistical analysis of LN lesions
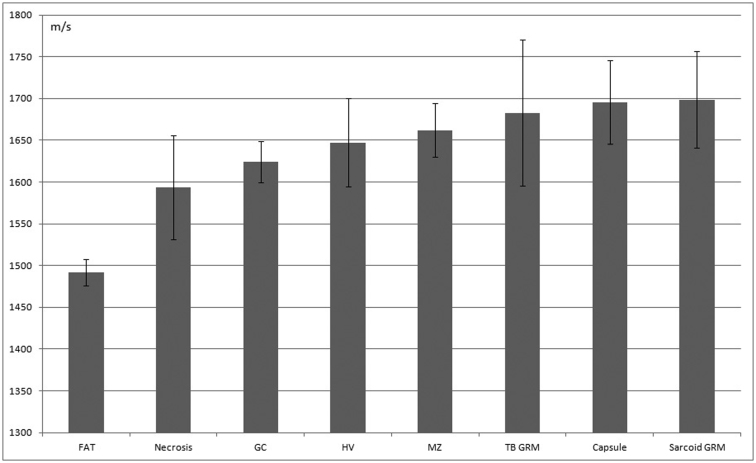
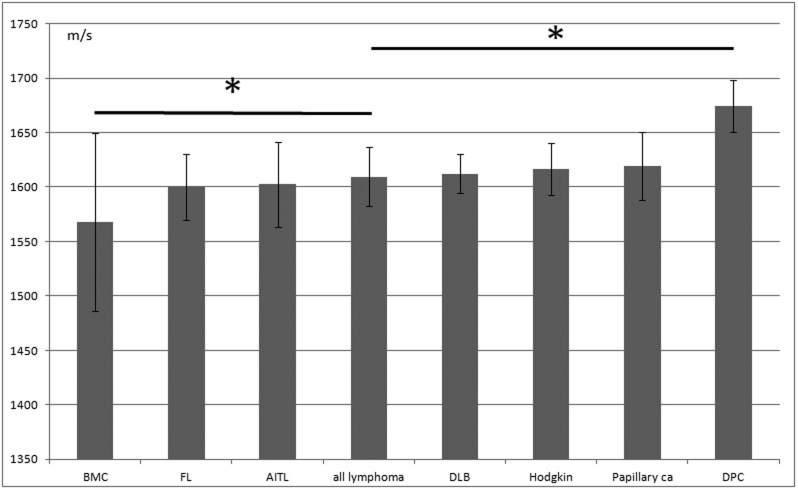
Figures 6 and 7 present the SOS values (mean ± SD, m/s) for normal/reactive and neoplastic lesions of LNs, respectively. Factual data are summarized in Table 1. In the normal/reactive lesions, collagenous capsules and epithelioid granulomas had the highest SOS values followed by those of the mantle zones, hilar vessels, germinal centers, necrotic, and adipose tissues in that order. However, in neoplastic lesions, desmoplastic metastatic carcinoma exhibited significantly higher SOS values than those of all the other malignant lymphomas (P < 0.01*). In contrast, medullary carcinoma revealed significantly lower SOS values than all other lymphomas.
Figure 6. Average speed of sound through normal and reactive lymph node structures.
Mean sound speed (m/s) and SD are displayed. FAT, adipose tissue; GC, germinal center; HV, hilar vessels; MZ, marginal zone; TB GRM, tuberculosis granuloma; sarcoid GRM, sarcoid granuloma.
Figure 7. The speed of sound through neoplastic lymph node structures.
Mean sound speed (m/s) and SD are displayed. BMC, metastatic breast carcinoma with medullary growth; FL, follicular lymphoma; AITL, Angioimmunoblastic T-cell lymphoma; all lymphoma, all kinds of lymphoma; DLB, diffuse large B-cell lymphoma; Papillary ca, metastatic papillary thyroid carcinoma; DPC, desmoplastic carcinoma, *P < 0.01.
Table 1. The speed of sound through each portion of the lymph nodes mean sound speed (m/s) and SD are shown. GC, germinal center; TB Grm, tuberculosis granuloma; sarcoid Grm, sarcoid granuloma; Breast ca (medullary), metastatic breast carcinoma with medullary growth; FL, follicular lymphoma; AITL, Angioimmunoblastic T-cell lymphoma; DLB, diffuse large B-cell lymphoma; Papillary ca, metastatic papillary thyroid carcinoma; Desmoplastic carcinoma, metastatic adenocarcinoma with desmoplastic reaction.
| Area | n | Average SOS | SD |
|---|---|---|---|
| Adipose tissue | 25 | 1492.06 | 15.84 |
| Necrosis | 33 | 1593.85 | 62.33 |
| GC | 36 | 1624.04 | 24.65 |
| Hilus vessel | 48 | 1647.15 | 52.69 |
| Mantle zone | 25 | 1662.16 | 32.2 |
| TB Grm | 70 | 1682.79 | 87.35 |
| Capsule | 25 | 1695.33 | 49.92 |
| Sarcoid Grm | 98 | 1698.74 | 58.1 |
| Breast ca(medullary) | 18 | 1567.75 | 81.87 |
| FL | 30 | 1599.71 | 30.15 |
| AITL | 26 | 1602.29 | 39.33 |
| ALL lymphoma | 153 | 1609.41 | 27.29 |
| DLB | 48 | 1612.16 | 17.7 |
| Hodgkin | 49 | 1616.43 | 23.51 |
| Papillary ca | 83 | 1619.4 | 31.03 |
| Desmoplastic carcinoma | 25 | 1674.31 | 24.07 |
Discussion
The high resolution SAM images could discriminate normal structures of LN components such as follicles, paracortices, medullary cords, sinuses, capsules, and adjacent adipose tissues based on the differences in the SOS through each component. Our results revealed that as a rule, SOS through tissues increased with increasing concentration of fibrous components, such as collagen or muscle fibers and with nuclear density of the tissue as well.
In benign or reactive LNs, no specific fibrous components exist, except blood or lymphatic vessels and fibrous capsules. Lymphocyte-rich mantle zones exhibited higher SOS values in the cortex followed by the germinal centers with lower nuclear density. The nuclear density of the medulla was lower than that of the cortex; therefore, it revealed lower SOS values.
In sarcoidosis and tuberculosis, granulomas exhibited conspicuous masses with high SOS values in the SAM imaging. Necrotic areas exhibited either lesser or greater acoustic properties. Cystic necrosis with sparse cell density revealed lower SOS values and coagulation necrosis with cell-rich debris revealed higher SOS values than those of the adjacent granulomatous areas. In a pathology textbook9, tuberculous granulomas with central necrosis are referred to as “soft tubercles,” whereas those without necrosis are referred to as “hard tubercles.” Our SAM observations coincided with this description.
Most malignant lymphomas presented homogenous SAM images except for follicular lymphoma, which presented multiple nodular images. Normal components in the node disappeared and were replaced by monotonous lymphoma cells presenting uniform SOS values in the SAM images.
Metastatic carcinoma revealed focal characteristic SOS values differing from those of the normal lymphocytes. Scirrhous carcinoma with desmoplastic reaction exhibited significantly higher SOS values than those of all other types of lymphoma. In contrast, carcinoma with medullary growth presented significantly lower SOS values than those of all other lymphomas. Differences in SOS values among carcinomas may depend primarily on stromal fibrosis and not on the tumor itself. This means that the hardness of carcinomas depends on the degree of the desmoplastic stromal reaction.
Echography is a useful imaging tool in the assessment of LNs. Gray-scale sonography is widely used now in the evaluation of the number, size, shape, borders, matting, adjacent soft-tissue edema, and internal architectures of LNs10. Representative echographic images of LN lesions can be characterized by the following features: benign or reactive LNs are elliptical in shape with a short to long axes ratio < 0.5, hypoechoic with unsharp borders, and visible echogenic, intranodal hilar structures. Cystic necrotic areas correspond to echolucent areas in the LNs, and coagulation necrotic areas appear as echogenic areas in routine sonography11. Malignant lymphomas show multiple, enlarged hypoechoic masses with a “pseudocystic” appearance. Lymphomatous nodes are usually round, well defined, and without an echogenic hilum. Posterior enhancement echo images from adjacent adipose tissues are frequently observed. LNs with metastatic carcinomas are round and predominantly hypoechoic compared with the adjacent musculature. Visualizing the echogenic hilum was very difficult. Metastatic nodes with extracapsular spread demonstrate ill-defined borders. Metastatic papillary carcinomas of the thyroid were exceptionally hyperechoic, which may be related to intranodal deposition of thyroglobulin12,13.
Observations of SAM imaging revealed that normal or reactive LNs were elliptical with hilar areas, whereas neoplastic nodes were round without apparent hilar structures. Normal or reactive LNs displayed heterologous SAM images corresponding to each structure. Neoplastic lesions displayed homogenous images because the tumors destroyed the normal structures and exhibited peculiar uniform SOS values; hence, the echograms of lymphomas and metastatic carcinomas demonstrated hypoechoic masses.
In the normal or reactive LNs, the borders of the LN parenchyma and adjacent connective tissue exhibited medullary cord and sinus structures having low SOS values gradually shifting to the surrounding adipose tissue that demonstrated the lowest SOS values in the section; thus, normal or reactive LNs presented unsharp borders. In contrast, neoplastic LNs displayed abrupt transition from the cell-rich area of the tumor, with higher SOS values, to the adjacent cell-poor area with lower SOS values; thus, the borders became sharp in the echogram. However, in lymphoma, there was a significant difference in acoustic impedance between the lymphoma and the surrounding adipose tissues, which resulted in posterior hyperechoic backscattered signals in the echogram. Interfaces between areas with significantly different acoustic impedances resulted in a greater degree of ultrasonic wave reflection.
Metastatic papillary carcinomas of the thyroid comprised spotty areas with either higher or lower SOS values corresponding to the thyroglobulins and cystic follicular spaces, respectively.
Although SAM has inferior resolution and a limited visual field compared with that of light microscopy, SAM provides the following benefits: (1) images reflected tissue elasticity of each lesion and disease, (2) SOS data could be statistically comparable among different lesions and diseases, (3) images were acquired in only a few minutes without special stainings and were obtainable even after staining, (4) SAM images in higher resolution and echographic images were comparable in the clinical ultrasonic imaging study.
In conclusion, the SAM system provided tissue elasticity imaging and succeeded in characteristic histological imaging of normal LN structures, granulomatous inflammation, and neoplastic lesions. SAM provided localized images of lymph follicles, germinal centers, medullary sinuses and cords, paracortex, fibrous capsules, adipose tissues, granulomas, necrosis, fibrosis, and metastatic carcinoma, in addition to diffuse images of follicular hyperplasia, diffuse malignant lymphomas, and follicular lymphomas. The SOS through each LN lesion was statistically comparable and useful for prediction of the histological findings.
Methods
Materials
All materials from anonymous donors were prepared from the Hamamatsu University Hospital archives. The research using stored samples without link to the identity of patients was approved by the research ethics committee of Hamamatsu University School of Medicine. Formalin-fixed, paraffin-embedded blocks were flat sectioned in 10–15 μm thick sections. Deparaffinized, unstained sections were soaked in distilled water for at least three hours to fully expand to the original state before observation. Continual sections were stained with H&E or Elastica–Masson stain for comparing SAM images with the corresponding light microscopy images.
Tissue samples
We examined and selected normal, inflammatory, and neoplastic lesions of lymph nodes including reactive lymphadenitis, granulomatous lymphadenitis such as sarcoidosis and tuberculosis, malignant lymphoma, and metastatic carcinoma of lymph nodes.
SAM observation
For SAM imaging, we used a scanning acoustic microscope supplied by Honda Electronics, Toyohashi, Japan with a 120-MHz transducer, which has a resolution of approximately 13 μm. SAM functions by directing focused sound from a transducer to a small area of the target object on a glass slide. The sound emitted by an acoustic transducer hits or penetrates the tissue and is reflected onto the surface of the tissue or glass. It is then returned to the detector, which is coincident with the transducer. The SOS through the tissue is calculated by comparing the time-of-flight of the pulse from the surfaces of both tissue and glass.
To perform SAM imaging, distilled water was applied between the transducer and the section as a coupling fluid. Air interferes with sound transmission. After mechanical X–Y scanning, sound speed from each point on the section was calculated and plotted on the screen to create two-dimensional, color-coded images. The region of interest (ROI: 1.2, 2.4, or 4.8 mm2) for acoustic microscopy was determined from the light microscopy images. Sound speed at 300 × 300 points was calculated and plotted on the screen to create the images, and sound data from 64 cross points on the lattice screen were used for statistical analysis.
Other data such as thickness of the section and attenuation of sound were also available from each point and shown on the screenshot (Figure 1B).
Statistical analysis
SOS data from each tissue element are presented as mean ± standard deviation (SD; m/s). Student's t-test was used for determining statistical differences among the specimens. The level of statistical significance was set to P < 0.01.
Author Contributions
K.M. wrote the main manuscript text and, H.N. and S.Y. helped to prepare figures. All authors reviewed the manuscript.
Acknowledgments
We thank Dr. K. Kobayashi (Honda Electronics Co. Ltd., Toyohashi, Japan) for his technical support and advice on SAM; Ms. S. Okamoto, Mr. T. Kato, Ms. Y. Kawabata, and Ms. N. Suzuki (Hamamatsu University School of Medicine) for preparing the tissue sections; and Mr. M. Ueda (Shizuoka Tokushukai Hospital) for presenting the echogram figures. This work was supported in part by the Japan Science and Technology Agency Grant Number AS232Z01789F and Japan Society for the Promotion of Science KAKENHI Grant Number 24590445. The authors would like to thank Enago (www.enago.jp) for the English language review.
References
- Wells P. N. T. Velocity, absorption and attenuation in biological materials. Biomedical Ultrasonics. London: Academic Press, pp.110–137 (1977). [Google Scholar]
- Johnston R. L. et al. Elements of Tissue Characterization. Ultrasonic Tissue Characterization II. Washington, DC: Government Printing Office Bureau, (1979). [Google Scholar]
- Saijo Y. et al. Ultrasonic tissue characterization of infarcted myocardium by scanning acoustic microscopy. Ultrasound Med Biol. 23, 77–85 (1997). [DOI] [PubMed] [Google Scholar]
- Sasaki H. et al. Acoustic properties of dialysed kidney by scanning acoustic microscopy. Nephrol Dial Transplant 12, 2151–2154 (1997). [DOI] [PubMed] [Google Scholar]
- Hozumi N. et al. Time-frequency analysis for pulse driven ultrasonic microscopy for biological tissue characterization. Ultrasonics 42, 717–722 (2004). [DOI] [PubMed] [Google Scholar]
- Kijima H. et al. Degenerated coracoacromial ligament in shoulders with rotator cuff tears shows higher elastic modulus: measurement with scanning acoustic microscopy. J Orthop Sci 14, 62–67 (2009). [DOI] [PubMed] [Google Scholar]
- Miura K. & Yamamoto S. Pulmonary imaging using a scanning acoustic microscope that discriminates tissue elasticity to show the structural characteristics of various diseases. Laboratory Invest 92, 1760–1765 (2012). [DOI] [PubMed] [Google Scholar]
- O'Malley D. et al. Granulomatous inflammation. In: King DW, Gardner WA, Sobin LH, Stocker JT, Wagner B, editors. Benign and Reactive Conditions of Lymph Node and Spleen. Washington, DC: American registry of pathology, p.119–125 (2009). [Google Scholar]
- O'Malley D. et al. Bacterial infection. In: King DW, Gardner WA, Sobin LH, Stocker JT, Wagner B, editors. Benign and Reactive Conditions of Lymph Node and Spleen. Washington, DC: American registry of pathology, p.229–281 (2009). [Google Scholar]
- Ahuja A. T. et al. Ultrasound of malignant cervical lymph nodes. Cancer Imaging 8, 48–56 (2008). [DOI] [PMC free article] [PubMed] [Google Scholar]
- Ahuja A. & Ying M. Sonographic evaluation of cervical lymphadenopathy: Is power doppler sonography routinely indicated? Ultrasound Med Biol 29, 353–359 (2003). [DOI] [PubMed] [Google Scholar]
- Ahuja A. T. et al. Metastatic cervical nodes in papillary carcinoma of the thyroid - ultrasound and histological correlation. Clin Radiol 50, 229–231 (1995). [DOI] [PubMed] [Google Scholar]
- Som P. M. et al. The varied presentations of papillary thyroid carcinoma-cervical nodal disease - CT and MR findings. Am J Neuroradiol 15, 1123–1128 (1994). [PMC free article] [PubMed] [Google Scholar]


