Abstract
Background
Critically ill patients often experience high levels of insulin resistance and stress-induced hyperglycemia, which may negatively impact outcomes. In 2001, Van den Berghe and coauthors used intensive insulin therapy (IIT) to control blood glucose (BG) to normal levels and reported a reduction in intensive care unit (ICU) mortality from 8% to 4.6%. Many studies tried to replicate these results, with some showing reduced mortality, others failing to match these results, and many seeing no clinically significant difference. The interpretation of results is important when drawing conclusions about the benefits and risks of IIT. There is the potential for negative results to be falsely negative due to unintended patient crossover or cohort overlap.
Aim
The aim of this study was to investigate the association between the amount of time each critically ill patient experiences good glucose control and hospital mortality.
Methods
This study uses BG data from 784 patients admitted to the Christchurch Hospital ICU between January 2003 and May 2007. For each of the 5 days of analysis, all patients with BG data were pooled together in a single cohort before being stratified into two subcohorts based on glycemic performance, determined by cumulative time in band (cTIB). The cTIB metric is calculated per patient/per day and defined here as the percentage of time the patient’s BG levels have been cumulatively in a specific band (72–126 mg/dl) up to and including the considered day. Subcohort A had patients with cTIB ≥ threshold and subcohort B had patients with cTIB < threshold. Three cTIB thresholds were tested: 0.3 (30%), 0.5 (50%), and 0.7 (70%). The odds of living (OL) were then calculated for each subcohort and day, forming the basis of comparison between the subcohorts. A second analysis was run using only the 310 patients with BG data for 5 days or more to assess the impact of patient dropout.
Results
Results show that, across all three cTIB threshold levels (0.3, 0.5, and 0.7) and all 5 days of analysis, patients with a cTIB ≥ threshold have a higher OL than patients with a cTIB < threshold. A cTIB threshold of 0.7 showed the strongest separation between the subcohorts, and on day 5, the OL for subcohort A was 4.4 versus 1.6 for subcohort B. The second analysis showed that patient dropout had little effect on the overall trends. Using a cTIB threshold of 0.7, the OL for subcohort A was 0.8 higher than the OL for subcohort B on day 1, which steadily increased over the 5 days of analysis.
Conclusions
Results show that OL are higher for patients with cTIB ≥ 0.3–0.7 than patients with cTIB < 0.3–0.7, irrespective of how cTIB was achieved. A cTIB threshold of 0.5 was found to be a minimum acceptable threshold based on outcome. If cTIB is used in similar BG studies in the future, cTIB ≥ 0.7 may be a good target for glycemic control to ensure outcomes and to separate patients with good BG control from patients with poor control.
Keywords: critically ill, glycemic variability, intensive care unit, intensive insulin therapy, mortality, tight glycemic control
Background
Critically ill patients often experience high levels of insulin resistance1–7 and stress-induced hyperglycemia, which may negatively impact outcomes.1–3,7,8 In the 2001 landmark study by Van den Berghe and coauthors,7 intensive insulin therapy (IIT) was used to control blood glucose (BG) to normal levels in an attempt to improve intensive care unit (ICU) patient outcomes and they reported a reduction in ICU mortality from 8% to 4.6% and a reduction in overall hospital mortality. Many studies tried to replicate these results with some showing reduced mortality,9,10 others failing to match these results,11–13 and many seeing no difference.14
The lack of consistent results following the Van den Berghe and coauthors7 study leaves the benefits of IIT disputed. Overall, any tight glycemic control (TGC) or IIT protocol must reduce elevated BG levels with minimal hypoglycemia. However, there is little agreement on what constitutes desirable glycemic performance.15–17 Furthermore, protocols or clinical practices that utilize large insulin doses can suffer from high glycemic variability and/or excessive hypoglycemia,14,18 both of which have been independently linked to mortality in critically ill patients.19–22
The interpretation of results from these studies is also important when drawing conclusions about the benefits and risks of IIT. There is the potential for negative results to be falsely negative due to unintended patient crossover or cohort overlap during studies comparing glycemic levels, which can lead to the misinterpretation of results. For example, if the aim of a particular study is to determine whether or not achieving good control of BG levels to a normal range is linked to reduced patient mortality, then the association between BG levels and mortality should be investigated. Furthermore, in this hypothetical study, if patients in group A were controlled using IIT and patients in group B were uncontrolled, we should not necessarily assume that all patients in group A would have BG in the normal or desired range and that all patients in group B would be poorly controlled. Therefore, the analysis should potentially consider patients from both groups based on glycemic levels achieved, rather than their intended treatment group.
Thus there are two separate questions that need to be answered. The first is a physiological question: Is normo-glycemia or lower glycemic levels associated with better outcomes in critically ill patients, irrespective of how it comes about? The second is a clinical question: Is glucose control achievable, consistently and reliably, in a clinical setting? This study addresses the first question by investigating the association between the amount of time each critically ill patient experiences good glucose control and hospital mortality, irrespective of the protocol used to control BG levels, specifically, by grouping patients based on level of achieved BG control and assessing the odds of hospital survival.
Methods
Subjects
This study uses BG data from 784 patients admitted to the Christchurch Hospital ICU between January 2003 and May 2007. A clinical practice change occurred during August 2005 when the SPRINT (SPecialized Relative Insulin and Nutrition Tables) TGC protocol was introduced, so the data set contains both pre-SPRINT patient data as well as data from patients on the SPRINT protocol. Overall, they represent a range of glycemic levels, and glycemic variability, and are representative of a typical medical ICU cohort. Demographic details are in Table 1.
Table 1.
Cohort Demographics
| Overall cohort | |
|---|---|
| Total patients | 784 |
| Age (years) | 65 (52–74) |
| % male | 61.2% |
| APACHE II score | 18 (15–24) |
| APACHE II risk of death | 26.2% (13.7–49.5%) |
| Diabetic history | 140 (17.8%) |
| Length of stay (days) | 3.8 (1.8–9.8) |
| Primary diagnostic category | |
|---|---|
| Operative | Number of patients |
| Cardiovascular | 175 |
| Respiratory | 19 |
| Gastrointestinal | 113 |
| Neurological | 16 |
| Trauma | 22 |
| Other (renal, metabolic, orthopedic) | 8 |
| Nonoperative | Number of patients |
|---|---|
| Cardiovascular | 80 |
| Respiratory | 143 |
| Gastrointestinal | 17 |
| Neurological | 53 |
| Trauma | 61 |
| Sepsis | 46 |
| Other (renal, metabolic, orthopedic) | 31 |
Blood Glucose Measurements
For all 784 patients, blood was sampled multiple times daily via an arterial line or by finger prick (in the absence of an arterial line) and BG concentration was determined by either blood gas analysis or using a point-of-care BG meter. The BG measurements were not affected by meals, because patients in this study were fed by constant infusion (typically enterally). The median (interquartile range) interval between BG measurements was 2 (1–2) h.Due to irregular sampling intervals, patient BG data were linearly interpolated at 60 min intervals. The BG values at 60 min intervals (either clinical or interpolated) were then used to determine glycemic performance.
Glycemic Performance
All 784 patients were pooled together in a single cohort and then stratified into two subcohorts based on glycemic performance. Glycemic performance was measured using cumulative time in band (cTIB),23 which is calculated per patient/per day and defined as the percentage of time the patient’s BG levels have been in a specific band (72–126 mg/dl here) up to and including the considered day. Importantly, cTIB is a measure of both level and variability of BG. Thus cTIB captures the amount of time each patient experiences good glucose control. For example, cTIB ≥ 0.5 requires a minimum of 50% of all measurements up to that day to be within 72–126 mg/dl for a given patient, implicitly limiting level and variability. In this study, cTIB thresholds of 0.3 (30%), 0.5 (50%), and 0.7 (70%) were tested.
Odds of Living
For each of the two stratified subcohorts based on cTIB ≥ threshold and cTIB < threshold, the odds of living (OL) were used to assess the association between glycemic performance and hospital mortality for these critically ill patients. OL is defined here as the number of patients discharged from hospital divided by the number of patients who died in hospital for a given subcohort and is calculated independently for each of the two subcohorts. Calculated each day, the OL for each subcohort clearly shows whether a rising odds ratio (simply the ratio of the OL for each subcohort) is due to improvement of one subcohort and/or degradation of the other.
Analysis
This study analyzed patient BG data for the first 5 days after hyperglycemia was first detected (two consecutive BG measurements ≥ 144 mg/dl) or for the available days if BG data were recorded for less than 5 days. For each day,a cTIB value was calculated for each patient who had BG data for the days leading up to and including that day. Patients with a cTIB ≥ threshold on that day were stratified to subcohort A and patients with a cTIB < threshold were assigned to subcohort B. The OL were then calculated for each subcohort, and day, forming the basis of comparison between the subcohorts. Baseline OL for the whole cohort without the cTIB condition are shown for comparison.
It should be noted that patient crossover from subcohort A to subcohort B (or vice versa) was possible on consecutive days if the patient’s cTIB crossed the threshold. For example, using a cTIB threshold of 0.5, a patient with a cTIB of 0.55 on day 1 would be assigned to subcohort A. The same patient could have a cTIB of 0.45 on day 2 and would then be assigned to subcohort B. Additionally, patient dropout occurred when a patient with <5 days BG data had no measurements for the current analysis day. The effects of patient dropout were assessed by a second analysis of 310 patients who had BG data for 5 days or more.
Results
The results of the first analysis of all 784 patients are shown in Figures 1–3. Each figure contains three lines, corresponding to OL results for (1) the cTIB ≥ threshold subcohort, (2) the cTIB < threshold subcohort, and (3) baseline OL for the whole cohort. In each figure, the x axis represents the length of time each patient had BG control. The y axis represents the OL, where a higher value indicates an association with better outcomes (reduced mortality). The number of patients assigned to each subcohort for each day is shown in brackets in Figures 1–3. Table 2 shows the total number of patients included in the analysis for each day.
Figure 1.
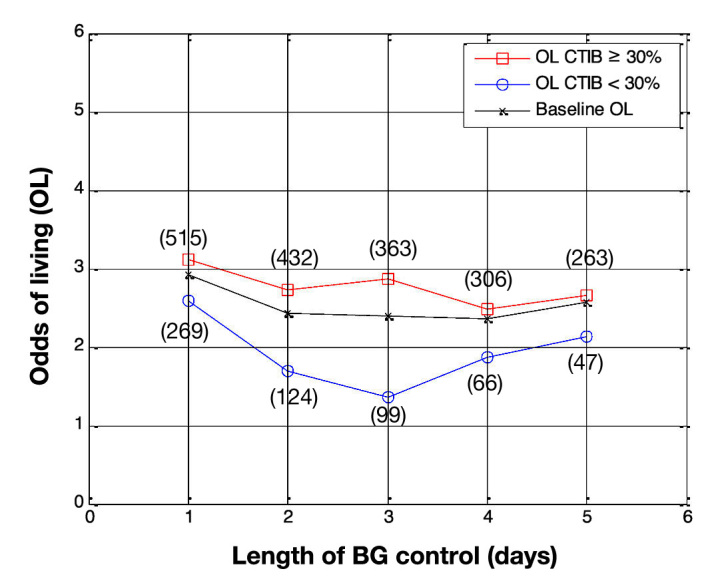
Odds of living by day for all patients in the study (N = 784 on day 1). Patients with at least 30% of BG measurements inside 72–126 mg/dl (squares) are compared with patients with less than 30% of BG measurements in 72–126 mg/dl (circles), with baseline OL shown for comparison (crosses). The number of patients in each subcohort is shown in parentheses.
Figure 3.
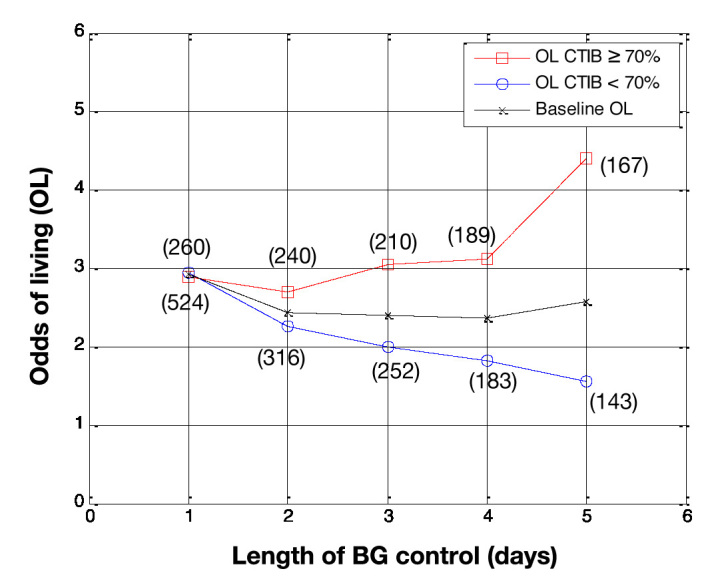
Odds of living by day for all patients in the study (N = 784 on day 1). Patients with at least 70% of BG measurements inside 72–126 mg/dl (squares) are compared with patients with less than 70% of BG measurements in 72–126 mg/dl (circles), with baseline OL shown for comparison (crosses). The number of patients in each subcohort is shown in parentheses.
Table 2.
Number of Patients on Each Day for the First Analysis
| Analysis day | Number of patients |
|---|---|
| Day 1 | 784 |
| Day 2 | 556 |
| Day 3 | 462 |
| Day 4 | 372 |
| Day 5 | 310 |
Figure 1 shows the OL, by day, for subcohort A and subcohort B when the cTIB threshold was set at 0.3. The OL for patients with cTIB ≥ 0.3 are higher than the OL for patients with cTIB < 0.3, for all 5 days. The separation between the OL for the two subcohorts increases over days 1–3, then decreases for days 4 and 5. The maximum separation occurs on day 3, when the OL for subcohorts A and B are 2.9 and 1.4, respectively. Figure 1 also shows that, when a cTIB threshold of 0.3 is used, the number of patients in each subcohort is skewed due to a lot of patients achieving the required 30% time in band.
Figure 2 shows the results using a cTIB threshold of 0.5. Similar to the results in Figure 1, the OL for patients with cTIB ≥ 0.5 are higher than the OL for patients with cTIB < 0.5 over all 5 days of analysis. The separation between the OL for the two subcohorts is also very similar to the results for a cTIB threshold of 0.3 over days 1–3. However, for days 4 and 5, the separation stays relatively constant at approximately 3 for cTIB > 0.5 and 1.6 for cTIB < 0.5. The number of patients in each subcohort is also less skewed due to the higher cTIB threshold.
Figure 2.
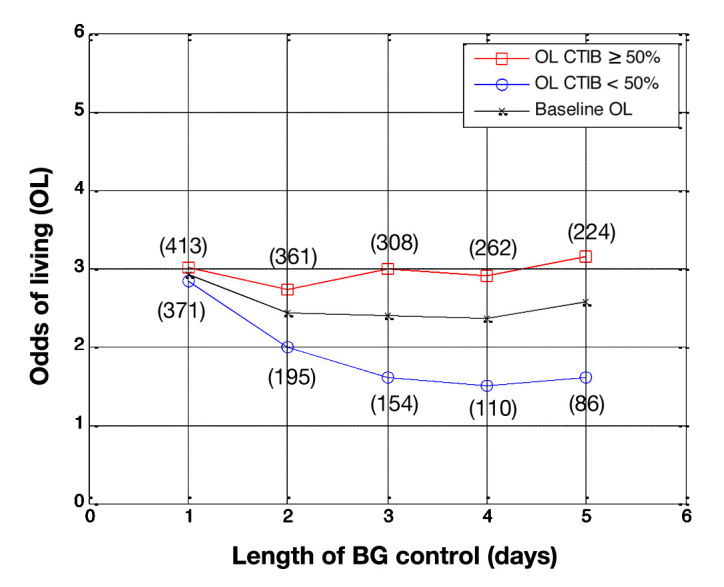
Odds of living by day for all patients in the study (N = 784 on day 1). Patients with at least 50% of BG measurements inside 72–126 mg/dl (squares) are compared with patients with less than 50% of BG measurements in 72–126 mg/dl (circles), with baseline OL shown for comparison (crosses). The number of patients in each subcohort is shown in parentheses.
Figure 3 shows the results using a cTIB threshold of 0.7. Again, the OL for patients in subcohort A are higher than the OL for patients in subcohort B over all 5 days of analysis. The separation between the OL for the two subcohorts steadily increases over the 5 days, reaching a maximum on day 5 when the OL for subcohort A was 4.4 versus 1.6 for subcohort B. The number of patients were evenly split between each subcohort for analysis days 2–5.
The results from the second analysis using only patients who had BG data for 5 days or more are shown in Figures 4–6 (N = 310 for all days). Again, the x axis represents the length of BG control, and the y axis is the OL. Patient dropout is accounted for in this analysis, and consequently, the OL for the entire cohort are 2.6 for all 5 days of analysis.
Figure 4.
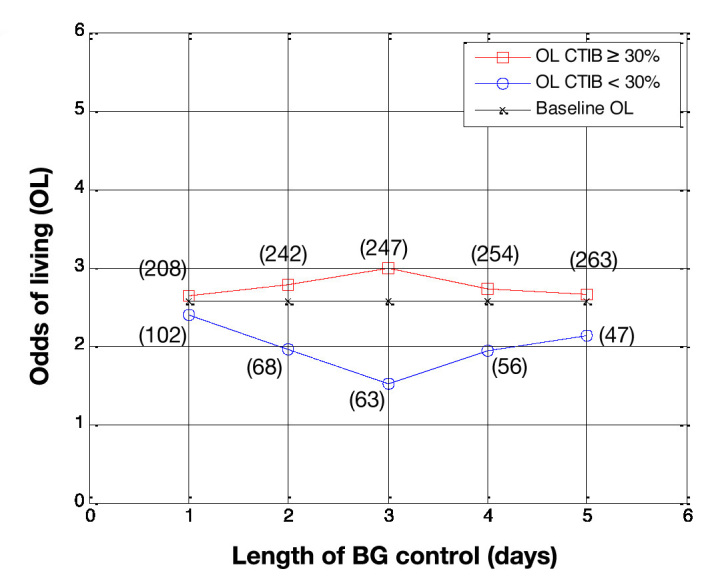
Odds of living by day for patients who had BG data for more than 5 days (N = 310). Patients with at least 30% of BG measurements inside 72–126 mg/dl (squares) are compared with patients with less than 30% of BG measurements in 72–126 mg/dl (circles), with baseline OL shown for comparison (crosses). The number of patients in each subcohort is shown in parentheses.
Figure 6.
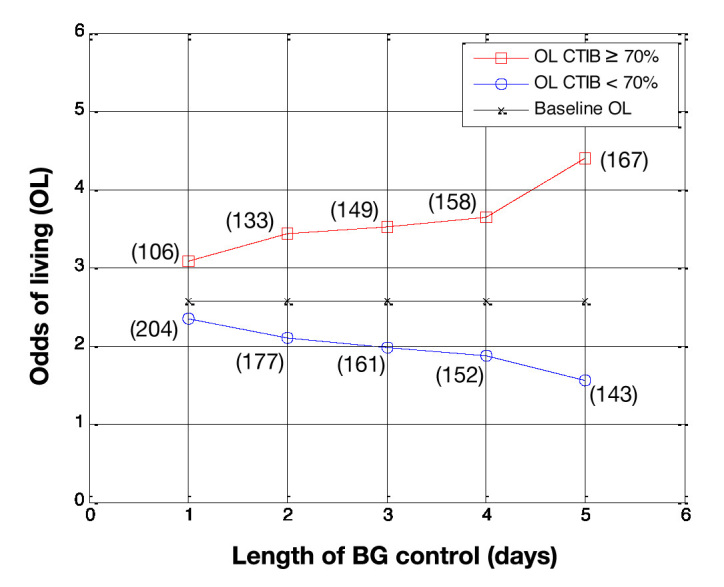
Odds of living by day for patients who had BG data for more than 5 days (N = 310). Patients with at least 70% of BG measurements inside 72–126 mg/dl (squares) are compared with patients with less than 70% of BG measurements in 72–126 mg/dl (circles), with baseline OL shown for comparison (crosses). The number of patients in each subcohort is shown in parentheses.
Figure 4 shows the OL, by day, for subcohort A and subcohort B when the cTIB threshold was set at 0.3, Figure 5 shows the results using a cTIB threshold of 0.5, and Figure 6 shows the results using a cTIB threshold of 0.7. The number of patients assigned to each subcohort for each day is shown in boxes in Figures 4–6. Results in Figures 4–6 are consistent with the results in Figures 1–3 for the corresponding cTIB threshold, indicating patient dropout had little effect in this analysis.
Figure 5.
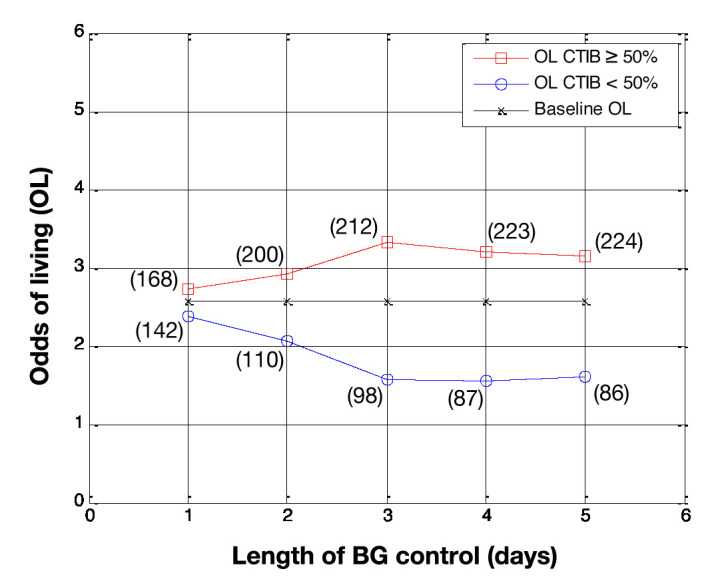
Odds of living by day for patients who had BG data for more than 5 days (N = 310). Patients with at least 50% of BG measurements inside 72–126 mg/dl (squares) are compared with patients with less than 50% of BG measurements in 72–126 mg/dl (circles), with baseline OL shown for comparison (crosses). The number of patients in each subcohort is shown in parentheses.
Discussion
The aim of this study was to investigate the association between a metric of lower or normoglycemia and patient mortality in critically ill patients. Patients were stratified into two subcohorts based on their cTIB, and then thetendency of daily OL was used as the basis of comparison between the subcohorts. Importantly, the stratification was based on achieved level of glycemic performance, rather than the clinical protocol in place.
The first trend seen in all six figures is that patients with a cTIB ≥ threshold have a higher OL than both the baseline OL and the OL for patients who had a cTIB < threshold. This trend occurs across all three threshold levels (0.3, 0.5, and 0.7) and all 5 days of analysis, except for day 1 in Figure 3 (cTIB threshold = 0.7), where all three OL were ~3. Overall, this result suggests that patients with glycemia in the normal range (72–126 mg/dl here) tend to have higher OL than those with glycemia outside the band for cTIB thresholds of 0.3–0.7.
The second observation is the effect of changing the cTIB threshold level. Figure 1 shows results from the first analysis using a cTIB threshold of 0.3. Most patients exceed the cTIB threshold, which results in up to 5.6 times more patients in the cTIB ≥ threshold subcohort (263 versus 47 for day 5). The OL for both subcohorts are only separated by 0.6 on day 5 (OL = 2.7 for cTIB ≥ threshold versus OL = 2.1 for cTIB < threshold), suggesting the threshold is too low to fully capture the association between glycemia and mortality.
The results shown in Figure 2 show an interesting trend when using a cTIB threshold of 0.5. The OL for subcohort A was ~3 for all 5 days of analysis, and the OL for subcohort B decreased from ~3 to ~1.5 over the 5 days. This result suggests that achieving a cTIB of ≥0.5 did not necessarily improve patient outcome but instead that not achieving the threshold of 0.5 was associated with a detrimental effect on patient outcome. These results suggest a cTIB threshold of 0.5 could potentially be the minimum target for future studies investigating the effect of BG control on patient mortality.
Further increasing the cTIB threshold, the results shown in Figure 3 suggest a cTIB threshold of 0.7 shows stronger separation in outcomes. Using this threshold, the separation between the OL of both subcohorts on day 5 increased to 2.8 (OL = 4.4 for cTIB ≥ threshold versus OL = 1.6 for cTIB < threshold). Additionally, there are at least 140 patients in each subcohort for all days, reducing the impact of outliers on the overall results. Finally, the OL increases consistently for the cTIB ≥ 0.7 subcohort while decreasing for the cTIB < 0.7 subcohort. These results suggest a cTIB threshold of 0.7 could be a good target for future studies investigating the effect of BG control on patient mortality.
Using the threshold of 0.7, the effect of patient length of stay was analyzed, with and without patient dropout. Comparing Figure 3 with Figure 6 outlines two main points. First, patients with a cTIB ≥ 0.7 have a higher OL the longer their length of BG control (up to day 5), and patients with a cTIB < 0.7 have decreasing OL as their length of BG control increases. Second, patient dropout had little effect on this overall trend with this data set and a threshold of 0.7. These findings reinforce the importance of getting good BG control early in the ICU stay and maintaining for the duration required.
The effect of patient crossover from one cTIB subcohort to the other during the 5 days of analysis was also assessed in this study (results not shown). For example, it is possible for a patient to be in subcohort A for days 1 and 2 to then drop to subcohort B for the remainder of monitoring. In the first analysis (including all patient data) using a cTIB threshold of 0.7, only 6% of patients crossed from one subcohort to the other during the monitoring period, and in the second analysis (including patients with three or more days of data), only 11% of patients changed subcohorts. To determine whether patient crossover had any significant effect on results, the data were reanalyzed with these patients excluded. The results were very similar to the original results from the first analysis, suggesting that patient crossover had very little impact in this study.
Additionally, patients with diabetes are predicted to have poor glycemic control24 and could potentially skew the overall results. Of the 784 patients used in this study, there were 140 patients with previously known diabetes. A further analysis was completed with these patients excluded, and the results remained very similar to the results obtained in the original analysis. Thus we can conclude, at least in this study, the results were not skewed by patients with diabetes.
In this study, OL was used to show the association between glycemia and mortality for critically ill patients and was used instead of odds ratio because OL gives more insight into why the odds ratio might show an increase or decrease. An increase in odds ratio can occur in three ways: (1) increased OL for patients who achieve the cTIB threshold, (2) decreased OL for patients who don’t achieve the cTIB threshold, or (3) a combination of both. Figures 2 and 3 reinforce the benefits of using OL in this study. Both examples show an increase in odds ratio, but this occurs for different reasons. The odds ratio for the results in Figure 2increases due to (2), and the odds ratio for the results in Figure 3 increase due to (3).
Overall the results of this study show a strong association between cTIB (glucose control) and hospital mortality for critically ill patients. It should be emphasized that the purpose of this study was to investigate the association between cTIB and mortality, not the cause of good/bad glucose control. Thus this study could not conclude that good BG control (measured by cTIB) is the cause of reduced ICU patient mortality, instead that it appears to be strongly associated with reduced mortality.
Limitations
Although the results of this study are promising, there are limitations that need to be addressed. First, data used in this study are from a single ICU, in one hospital. A similar analysis needs to be carried out on a large multicenter, multi-ICU cohort that contains a wide variety of patients. Testing across a larger, broader population of critically ill patients will help to determine how robust the cTIB metric is and how strongly it is associated with mortality.
The second limitation is the very low incidence of hypoglycemia in this data set. SPRINT achieved good control with minimal hypoglycemia, and this risk factor, which is prevalent in other TGC studies, is not effectively considered here. Again, repeating the analysis with a larger cohort that includes episodes of hypoglycemia would give insight into how these events impact the results.
Third, patient dropout occurred when patients had less than 5 days of BG data. In the first analysis, these patients were removed from the data set for subsequent days. There is potential for a bias using this method, as it is likely patients would have stopped BG control due to self-regulation of BG and should have been in the cTIB ≥ threshold subcohort. This issue is mitigated in the second analysis (Figures 4–6) by removing patients with less than 5 days of BG data and only analyzing the 310 patients with BG data for all 5 days.
Fourth, length of BG control was measured from first recognition of hyperglycemia when BG control commenced, not when patients were admitted to the ICU. Thus patients starting BG control later in their stay may have a different clinical situation to those who presented with hyperglycemia upon ICU admission. Additionally, only 5 days of BG control were analyzed in this study, based on available data. Hospital mortality was used as the outcome metric, but this could occur long after the application of BG control and potentially for reasons not related to the provision of glucose control.
Conclusions
This study explicitly addressed the first of two questions regarding BG control in critically ill patients: Is normo-glycemia and low variability associated with reduced hospital mortality in this group of patients? The analysis used cTIB and OL to quantify this association with 5 days of BG data for each patient.
Results show that OL are higher for patients with cTIB ≥ 0.3–0.7 than patients with cTIB < 0.3–0.7, irrespective of how cTIB was achieved. The 0.7 threshold showed OL 2.8 times higher for those patients with cTIB ≥ 0.7 by day 5. Equally, a cTIB threshold of 0.5 was found to be a minimum acceptable threshold based on outcome. If cTIB is used in similar BG studies in the future, cTIB ≥ 0.7 may be a good target for glycemic control to ensure outcomes and to separate patients with good BG control from patients with poor control. Finally, ability to achieve such levels may offer value in prognostic models.
Glossary
- (BG)
blood glucose
- (cTIB)
cumulative time in band
- (ICU)
intensive care unit
- (IIT)
intensive insulin therapy
- (OL)
odds of living
- (TGC)
tight glycemic controle
Funding
This study was supported by the University of Canterbury Department of Mechanical Engineering, New Zealand.
References
- 1.Capes SE, Hunt D, Malmberg K, Gerstein HC. Stress hyperglycaemia and increased risk of death after myocardial infarction in patients with and without diabetes: a systematic overview. Lancet. 2000;355(9206):773–778. doi: 10.1016/S0140-6736(99)08415-9. [DOI] [PubMed] [Google Scholar]
- 2.Finney SJ, Zekveld C, Elia A, Evans TW. Glucose control and mortality in critically ill patients. JAMA. 2003;290(15):2041–2047. doi: 10.1001/jama.290.15.2041. [DOI] [PubMed] [Google Scholar]
- 3.Krinsley JS. Association between hyperglycemia and increased hospital mortality in a heterogeneous population of critically ill patients. Mayo Clin Proc. 2003;78(12):1471–1478. doi: 10.4065/78.12.1471. [DOI] [PubMed] [Google Scholar]
- 4.McCowen KC, Malhotra A, Bistrian BR. Stress-induced hyperglycemia. Crit Care Clin. 2001;17(1):107–124. doi: 10.1016/s0749-0704(05)70154-8. [DOI] [PubMed] [Google Scholar]
- 5.Mizock BA. Alterations in fuel metabolism in critical illness: hyper-glycaemia. Best Pract Res Clin Endocrinol Metab. 2001;15(4):533–551. doi: 10.1053/beem.2001.0168. [DOI] [PubMed] [Google Scholar]
- 6.Umpierrez GE, Isaacs SD, Bazargan N, You X, Thaler LM, Kitabchi AE. Hyperglycemia: an independent marker of in-hospital mortality in patients with undiagnosed diabetes. J Clin Endocrinol Metab. 2002;87(3):978–982. doi: 10.1210/jcem.87.3.8341. [DOI] [PubMed] [Google Scholar]
- 7.Van den Berghe G, Wouters P, Weekers F, Verwaest C, Bruyninckx F, Schetz M, Vlasselaers D, Ferdinande P, Lauwers P, Bouillon R. Intensive insulin therapy in critically ill patients. N Engl J Med. 2001;345(19):1359–1367. doi: 10.1056/NEJMoa011300. [DOI] [PubMed] [Google Scholar]
- 8.Bistrian BR. Hyperglycemia and infection: which is the chicken and which is the egg? JPEN J Parenter Enteral Nutr. 2001;25(4):180–181. doi: 10.1177/0148607101025004180. [DOI] [PubMed] [Google Scholar]
- 9.Chase JG, Shaw G, Le Compte A, Lonergan T, Willacy M, Wong XW, Lin J, Lotz T, Lee D, Hann C. Implementation and evaluation of the SPRINT protocol for tight glycaemic control in critically ill patients: a clinical practice change. Crit Care. 2008;12(2):R49. doi: 10.1186/cc6868. [DOI] [PMC free article] [PubMed] [Google Scholar]
- 10.Krinsley JS. Effect of an intensive glucose management protocol on the mortality of critically ill adult patients. Mayo Clin Proc. 2004;79(8):992–1000. doi: 10.4065/79.8.992. [DOI] [PubMed] [Google Scholar]
- 11.Brunkhorst FM, Engel C, Bloos F, Meier-Hellmann A, Ragaller M, Weiler N, Moerer O, Gruendling M, Oppert M, Grond S, Olthoff D, Jaschinski U, John S, Rossaint R, Welte T, Schaefer M, Kern P, Kuhnt E, Kiehntopf M, Hartog C, Natanson C, Loeffler M, Reinhart K. German Competence Network Sepsis (SepNet). Intensive insulin therapy and pentastarch resuscitation in severe sepsis. N Engl J Med. 2008;358(2):125–139. doi: 10.1056/NEJMoa070716. [DOI] [PubMed] [Google Scholar]
- 12.Finfer S, Delaney A. Tight glycemic control in critically ill adults. JAMA. 2008;300(8):963–965. doi: 10.1001/jama.300.8.963. [DOI] [PubMed] [Google Scholar]
- 13.Preiser JC, Devos P, Ruiz-Santana S, Mélot C, Annane D, Groeneveld J, Iapichino G, Leverve X, Nitenberg G, Singer P, Wernerman J, Joannidis M, Stecher A, Chioléro R. A prospective randomised multi-centre controlled trial on tight glucose control by intensive insulin therapy in adult intensive care units: the Glucontrol study. Intensive Care Med. 2009;35(10):1738–1748. doi: 10.1007/s00134-009-1585-2. [DOI] [PubMed] [Google Scholar]
- 14.Preiser JC, Devos P, Ruiz-Santana S, Mélot C, Annane D, Groeneveld J, Iapichino G, Leverve X, Nitenberg G, Singer P, Wernerman J, Joannidis M, Stecher A, Chioléro R. Intensive insulin therapy and mortality among critically ill patients: a meta-analysis including NICE-SUGAR study data. Intensive Care Med. 2009;35(10):1738–1748. doi: 10.1007/s00134-009-1585-2. [DOI] [PubMed] [Google Scholar]
- 15.Mackenzie I, Ingle S, Zaidi S, Buczaski S. Tight glycaemic control: a survey of intensive care practice in large English hospitals. Intensive Care Med. 2005;31(8):1136. doi: 10.1007/s00134-005-2677-2. [DOI] [PubMed] [Google Scholar]
- 16.Schultz MJ, Spronk PE, Moeniralam HS. Tight glycaemic control: a survey of intensive care practice in the Netherlands. Intensive Care Med. 2006;32(4):618–621. doi: 10.1007/s00134-006-0099-4. [DOI] [PubMed] [Google Scholar]
- 17.Gale SC, Gracias VH. Glycemic control needs a standard reference point. Crit Care Med. 2006;34(6):1856–1858. doi: 10.1097/01.CCM.0000220201.72591.43. [DOI] [PubMed] [Google Scholar]
- 18.Meijering S, Corstjens AM, Tulleken JE, Meertens JH, Zijlstra JG, Ligtenberg JJ. Towards a feasible algorithm for tight glycaemic control in critically ill patients: a systematic review of the literature. Crit Care. 2006;10(1):R19. doi: 10.1186/cc3981. [DOI] [PMC free article] [PubMed] [Google Scholar]
- 19.Egi M, Bellomo R, Stachowski E, French CJ, Hart G. Variability of blood glucose concentration and short-term mortality in critically ill patients. Anesthesiology. 2006;105(2):244–252. doi: 10.1097/00000542-200608000-00006. [DOI] [PubMed] [Google Scholar]
- 20.Egi M, Bellomo R, Stachowski E, French CJ, Hart GK, Taori G, Hegarty C, Bailey M. Hypoglycemia and outcome in critically ill patients. Mayo Clin Proc. 2010;85(3):217–224. doi: 10.4065/mcp.2009.0394. [DOI] [PMC free article] [PubMed] [Google Scholar]
- 21.Hermanides J, Bosman RJ, Vriesendorp TM, Dotsch R, Rosendaal FR, Zandstra DF, Hoekstra JB, DeVries JH. Hypoglycemia is associated with intensive care unit mortality. Crit Care Med. 2010;38(6):1430–1434. doi: 10.1097/CCM.0b013e3181de562c. [DOI] [PubMed] [Google Scholar]
- 22.Krinsley JS. Glycemic variability: a strong independent predictor of mortality in critically ill patients. Crit Care Med. 2008;36(11):3008–3013. doi: 10.1097/CCM.0b013e31818b38d2. [DOI] [PubMed] [Google Scholar]
- 23.Chase JG, Pretty CG, Pfeifer L, Shaw GM, Preiser JC, Le Compte AJ, Lin J, Hewett D, Moorhead KT, Desaive T. Organ failure and tight glycemic control in the SPRINT study. Crit Care. 2010;14(4):R154. doi: 10.1186/cc9224. [DOI] [PMC free article] [PubMed] [Google Scholar]
- 24.Rady MY, Johnson DJ, Patel BM, Larson JS, Helmers RA. Influence of individual characteristics on outcome of glycemic control in intensive care unit patients with or without diabetes mellitus. Mayo Clin Proc. 2005;80(12):1558–1567. doi: 10.4065/80.12.1558. [DOI] [PubMed] [Google Scholar]


